ETH/USD – Market Trades Inside Symmetrical Triangle Pattern Key Support Levels: 00, 80, 62.Key Resistance Levels: 17, 42, 80. Etheruem saw a strong 10% price hike today as the cryptocurrency pushed higher from 00 to reach the current level. With today’s movement, ETH managed to break the resistance at 02.50 (1.414 Fib Extension) that it failed to close a daily candle above last week. If today’s daily candle can close above here, it will be a solid bullish signal for the week ahead. The coin found support at 62 (.382 Fib) over the weekend and managed to close each daily candle above the lower angle of a symmetrical triangle pattern. The recent move higher now allows ETH to test the upper boundary of this triangle which would need to be broken
Topics:
Yaz Sheikh considers the following as important: ETH Analysis, ETHBTC, Ethereum (ETH) Price, ethusd
This could be interesting, too:
Mandy Williams writes Ethereum Derivatives Metrics Signal Modest Downside Tail Risk Ahead: Nansen
Jordan Lyanchev writes Weekly Bitcoin, Ethereum ETF Recap: Light at the End of the Tunnel for BTC
CryptoVizArt writes Will Weak Momentum Drive ETH to .5K? (Ethereum Price Analysis)
Jordan Lyanchev writes Bybit Hack Fallout: Arthur Hayes, Samson Mow Push for Ethereum Rollback
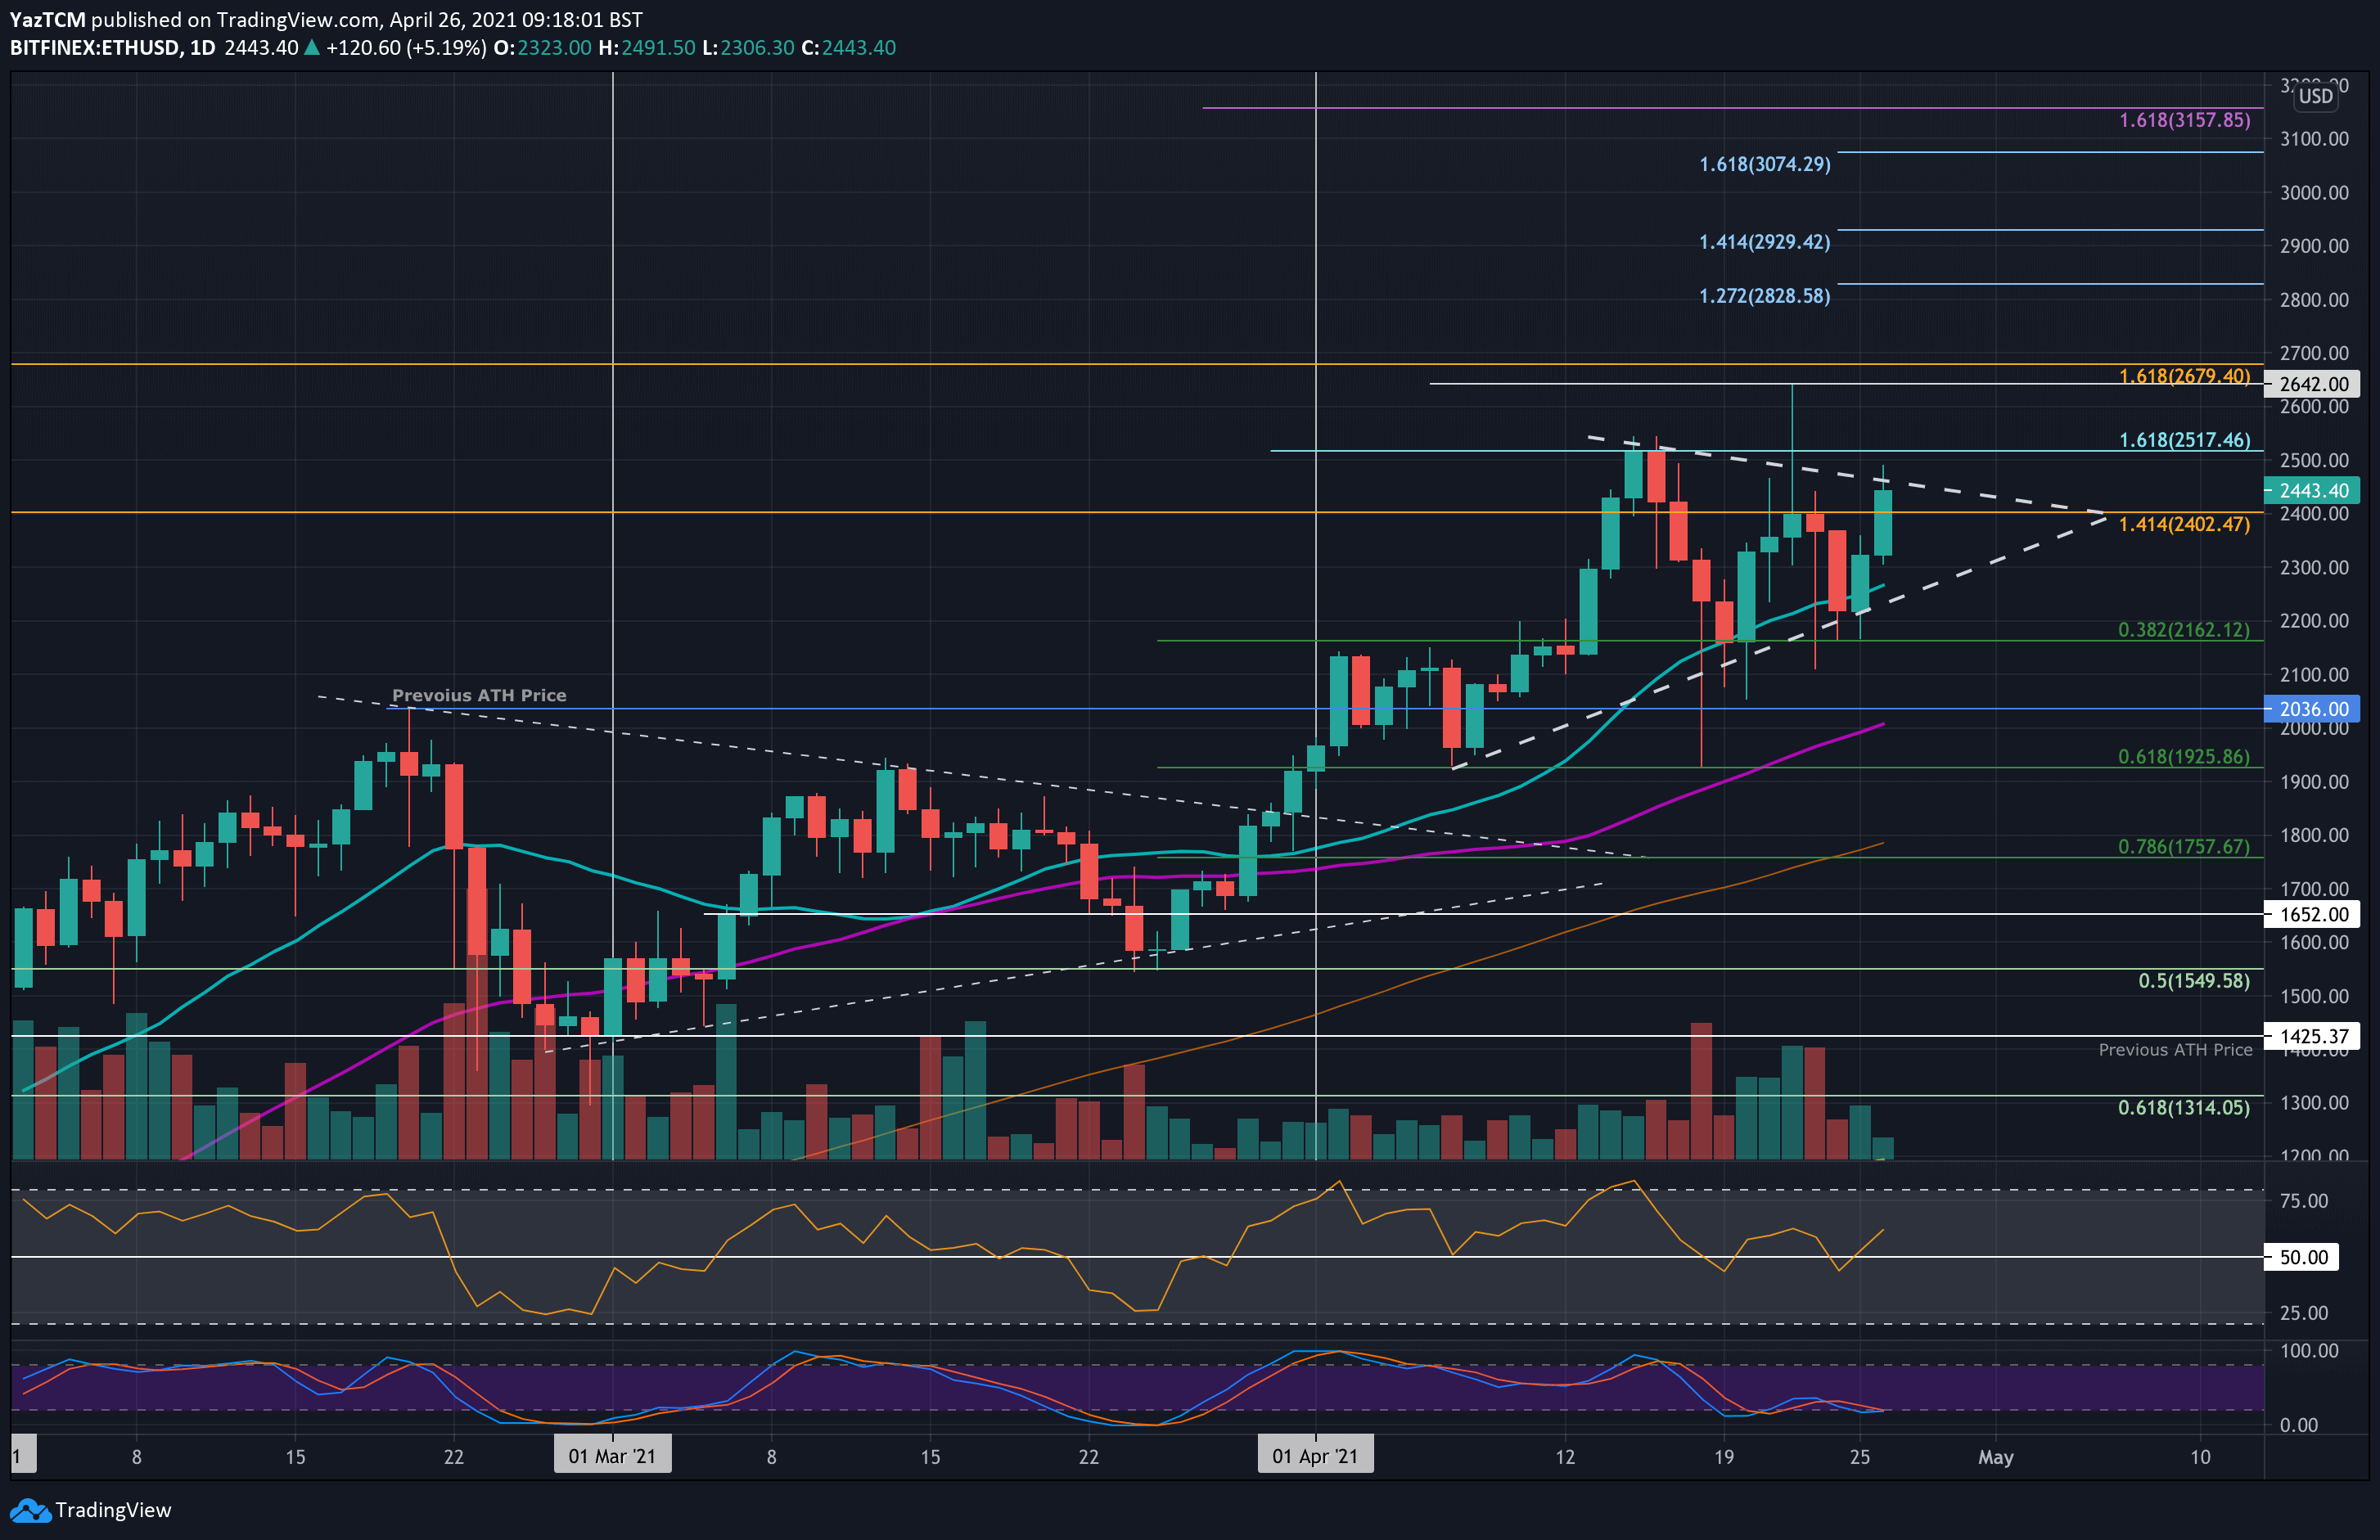
ETH/USD – Market Trades Inside Symmetrical Triangle Pattern
Key Support Levels: $2400, $2280, $2162.
Key Resistance Levels: $2517, $2642, $2680.
Etheruem saw a strong 10% price hike today as the cryptocurrency pushed higher from $2300 to reach the current level. With today’s movement, ETH managed to break the resistance at $2402.50 (1.414 Fib Extension) that it failed to close a daily candle above last week. If today’s daily candle can close above here, it will be a solid bullish signal for the week ahead.
The coin found support at $2162 (.382 Fib) over the weekend and managed to close each daily candle above the lower angle of a symmetrical triangle pattern. The recent move higher now allows ETH to test the upper boundary of this triangle which would need to be broken before being able to make a test of last week’s ATH price of $2642.
ETH-USD Short Term Price Prediction
Looking ahead, if the bulls break the upper boundary of the triangle, the first resistance lies at $2517.50 (1.618 Fib Extension). This is followed by $2642 (ATH price), $2680 (1.618 Fib Extension), $2830 (1.272 Fib Extension – blue), $2929 (1.414 Fib Extension – blue), and $3,000.
On the other side, the first support lies at $2400. This is followed by the lower angle of the symmetrical triangle (around $2280), $2162 (.382 Fib), $2100, and $2000 (50-days MA).
The daily RSI has now returned back above the midline, indicating that the buyers have regained control of the market momentum. Additionally, the Stochastic RSI is primed for a bullish crossover signal.
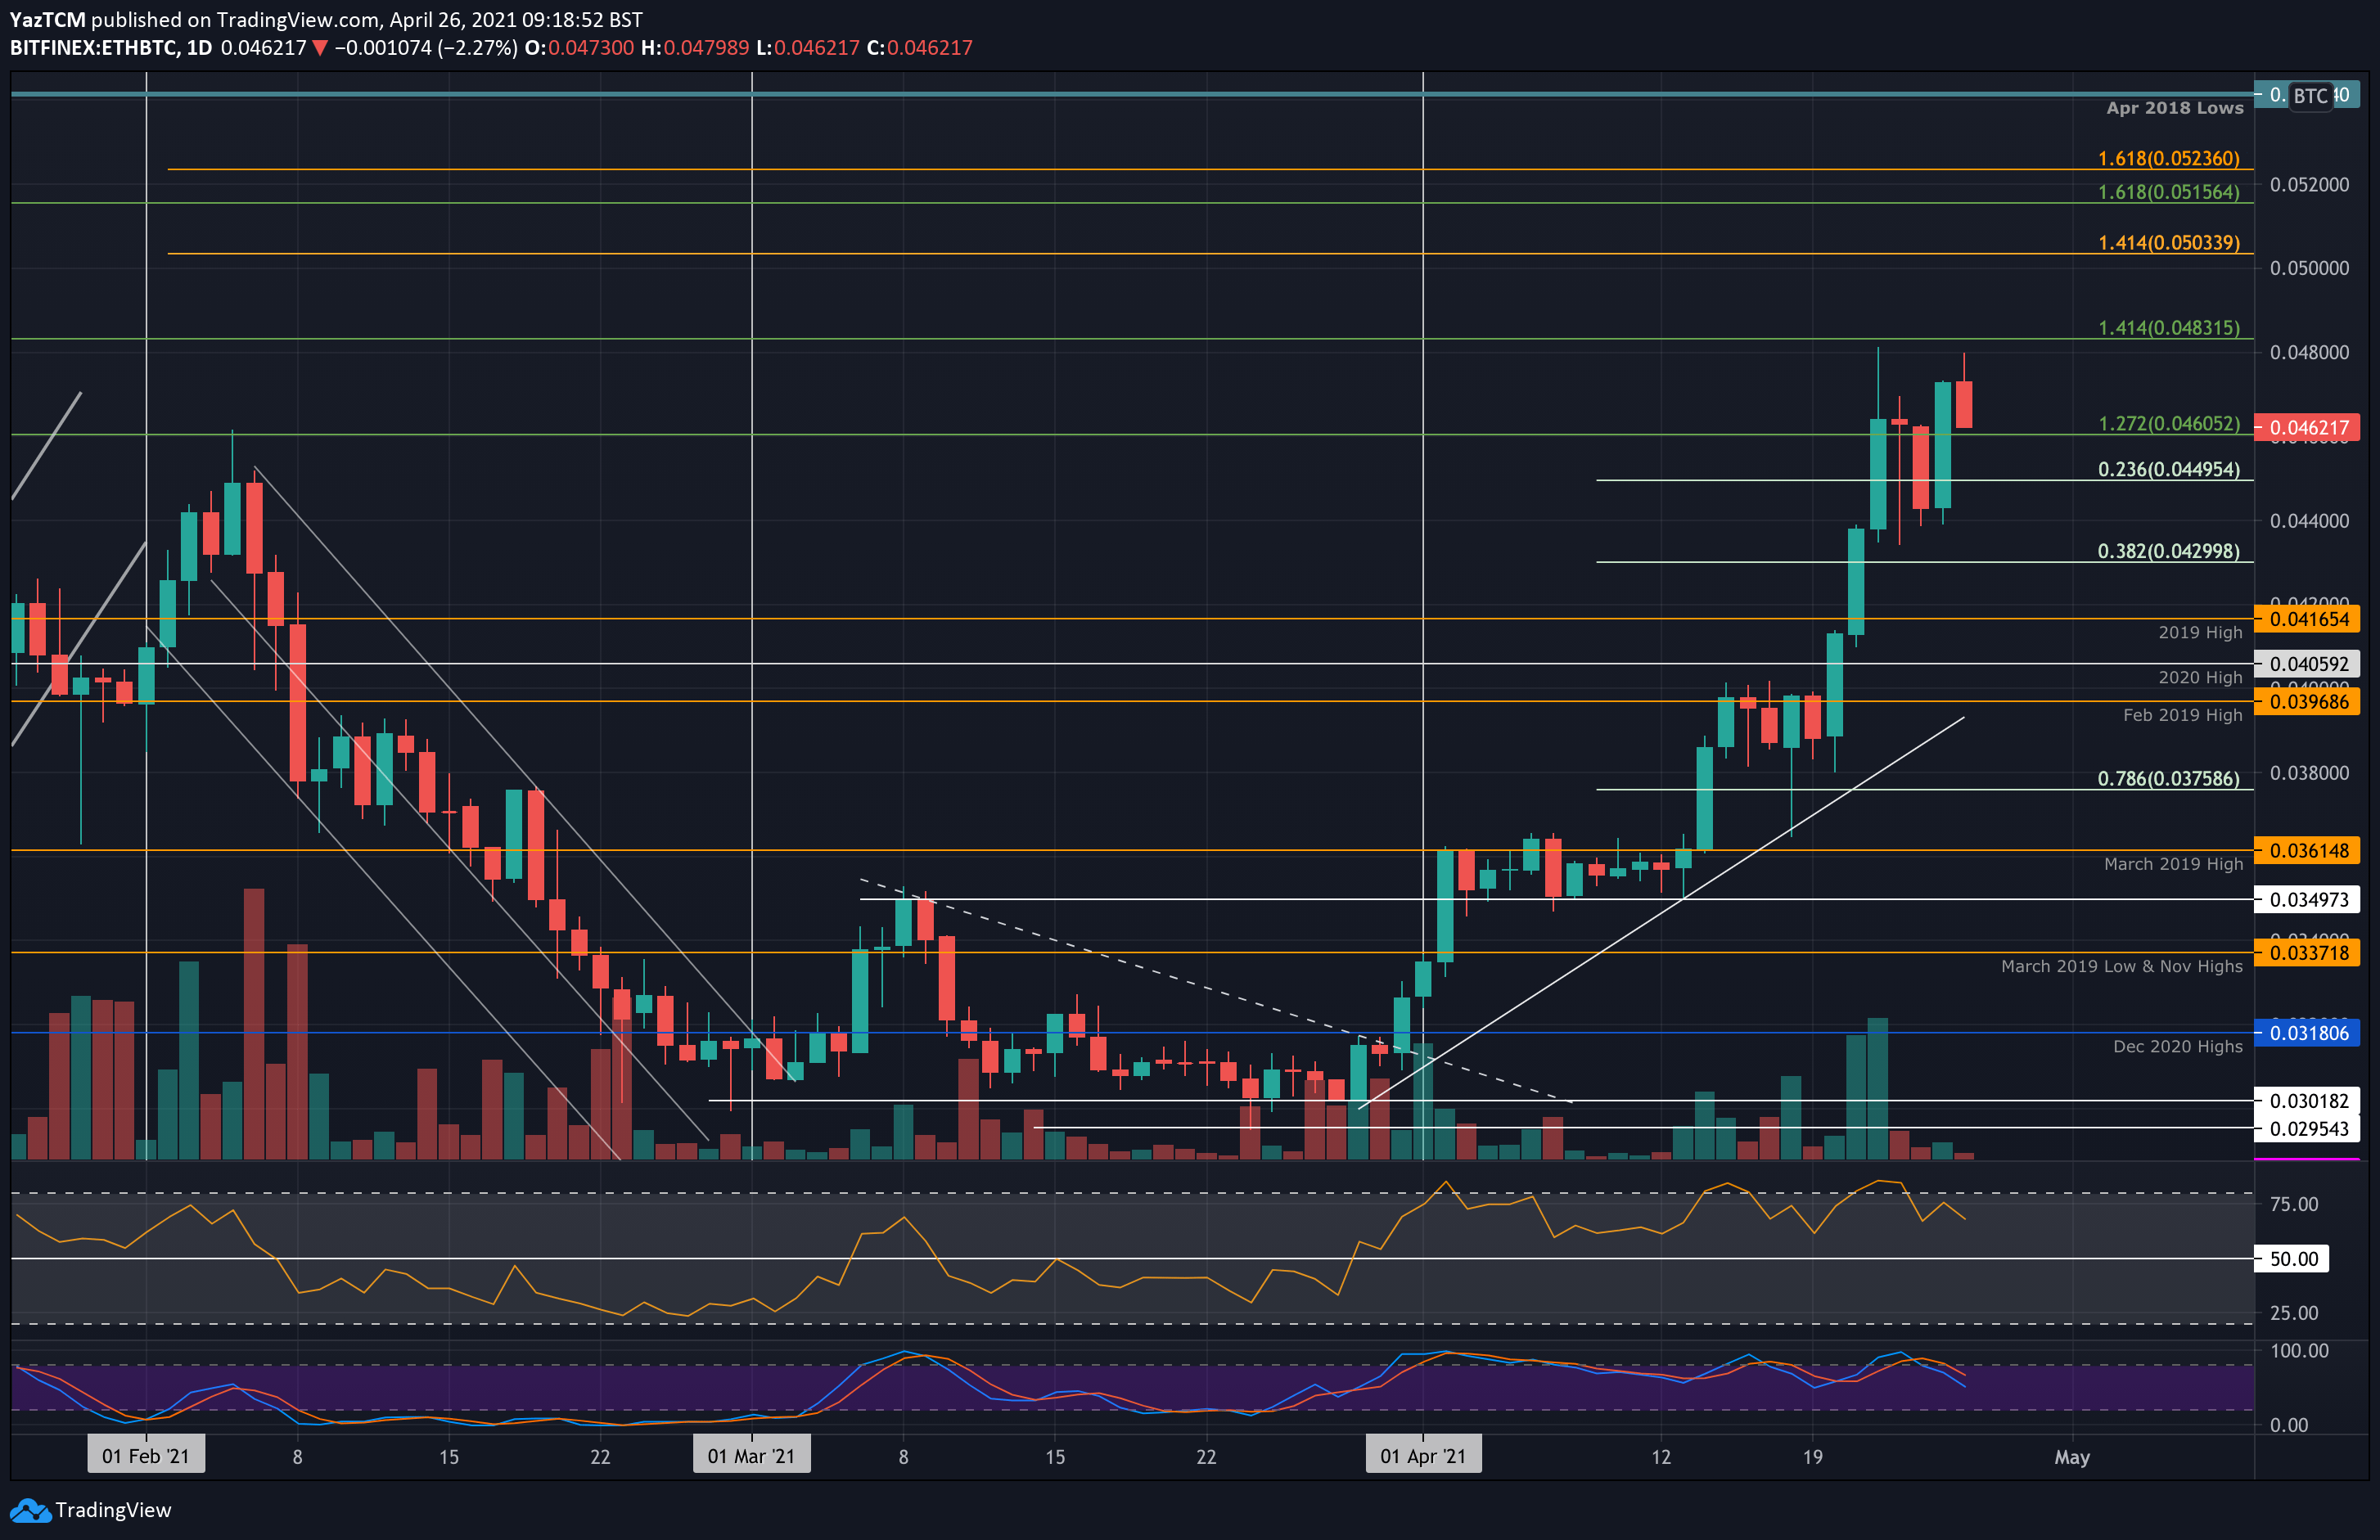
ETH/BTC – Buyers Bounce From 0.044 BTC Weekend Support.
Key Support Levels: 0.046 BTC, 0.044 BTC, 0.0429 BTC.
Key Resistance Levels: 0.048 BTC, 0.0483 BTC, 0.05 BTC.
Ethereum is performing very well against bitcoin as it reached 0.048 BTC today. The cryptocurrency had found support at 0.044 BTC over the weekend and rebounded from there yesterday to produce a new daily closing high for 2021 at 0.0472 BTC.
Today, ETH started by pushing higher to reach 0.048 BTC but has since reversed from there as it dropped to the current 0.0462 BTC level.
ETH-BTC Short Term Price Prediction
Looking ahead, the first level of strong support lies at 0.046 BTC. This is followed by 0.044 BTC, 0.0429 BTC (.382 Fib), 0.0416 BTC (2019 High), and 0.0405 BTC (2020 High).
On the other side, the first resistance lies at 0.048 BTC. This is followed by 0.0483 BTC (1.414 Fib Extension), 0.05 BTC, 0.0516 BTC (1.618 Fib Extension), and 0.0523 BTC.
The RSI is showing hints of bearish divergence, which is a worrying sign for the bulls as it could signal a possible retracement is incoming. However, it still remains well within the buyer’s favor as they dominate the market momentum.