ETH/USD – Ether Breaks Consolidation & Hits 00. Key Support Levels: 00, 25, 88.Key Resistance Levels: 00, 40, 00. Ethereum is now down a sharp 20% on the week as the cryptocurrency crashes into the 00 support. It had been trading inside a symmetrical triangle pattern over the past three weeks but ended up breaking this consolidation on Friday as it dropped to 00. Yesterday, ETH showed signs of weakness after spiking into the Feb 2021 highs at 36. It rebounded to close the daily candle for around 45. Today, however, the sellers retook control and pushed ETH as low as 75. It has found support at 00, a round psychological number bolstered by a .786 Fib Retracement. A break beneath here could send ETH much lower over the coming weeks.
Topics:
Yaz Sheikh considers the following as important: ETH Analysis, ETHBTC, Ethereum (ETH) Price, ethusd
This could be interesting, too:
Mandy Williams writes Ethereum Derivatives Metrics Signal Modest Downside Tail Risk Ahead: Nansen
Jordan Lyanchev writes Weekly Bitcoin, Ethereum ETF Recap: Light at the End of the Tunnel for BTC
CryptoVizArt writes Will Weak Momentum Drive ETH to .5K? (Ethereum Price Analysis)
Jordan Lyanchev writes Bybit Hack Fallout: Arthur Hayes, Samson Mow Push for Ethereum Rollback
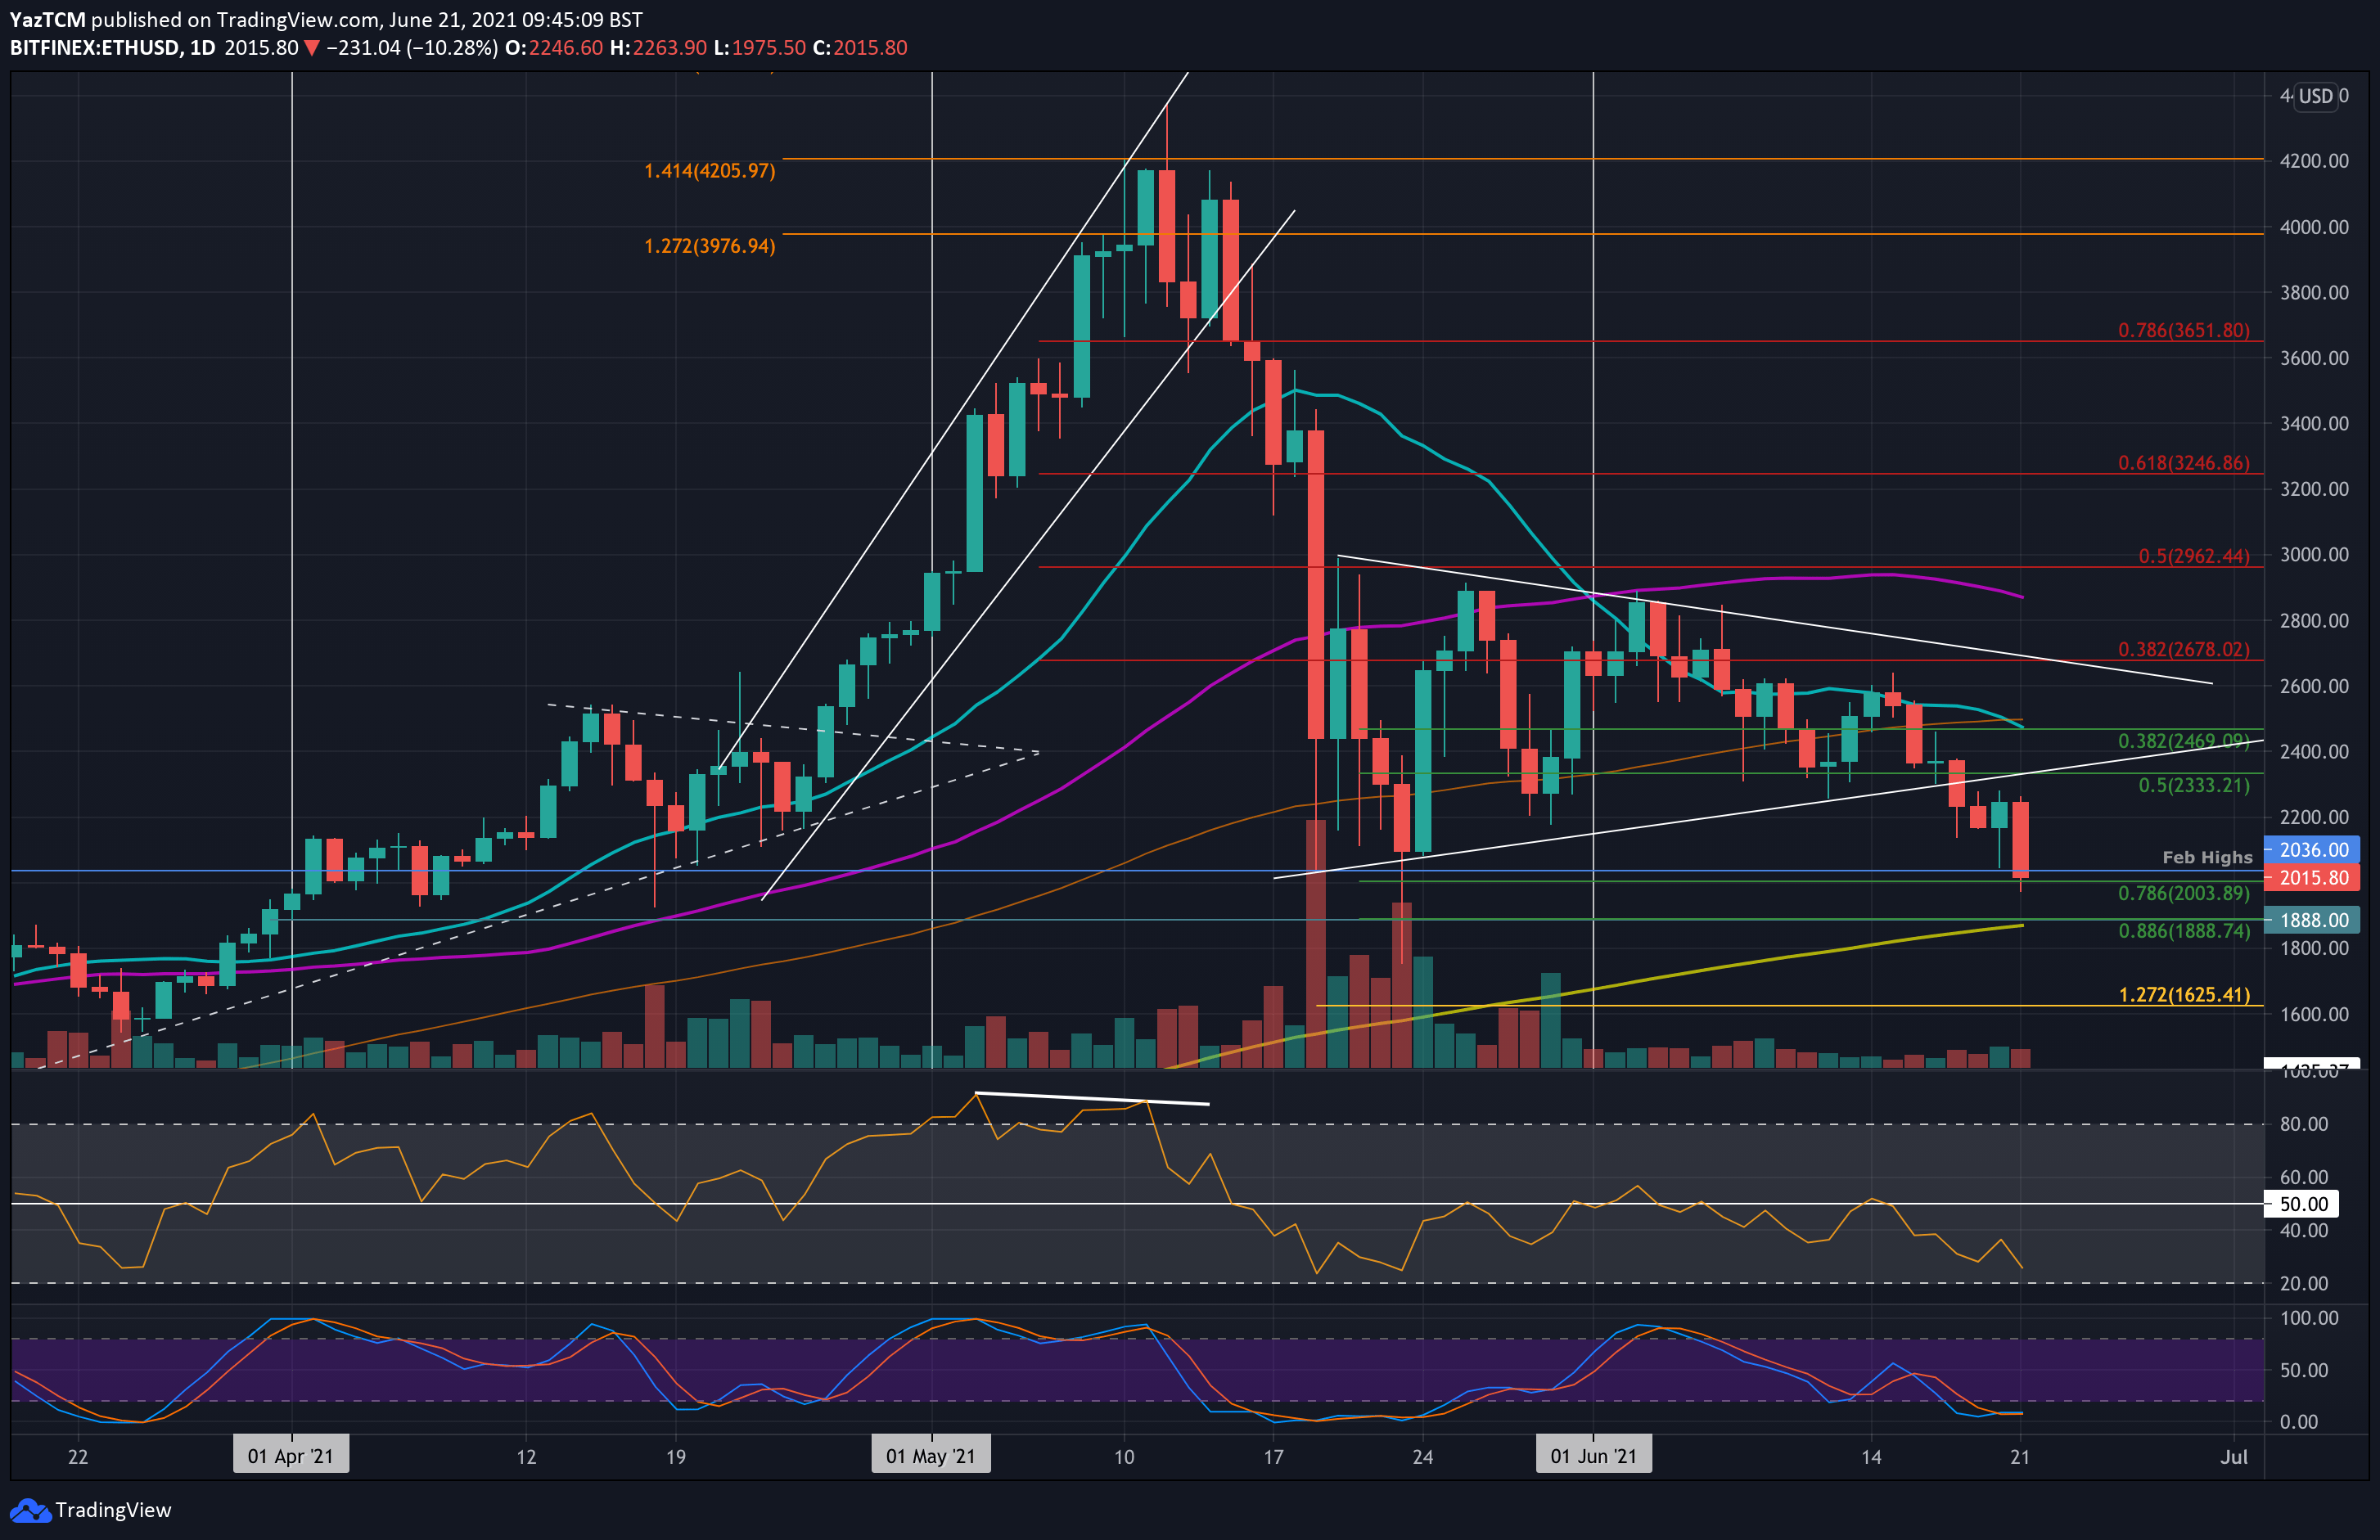
ETH/USD – Ether Breaks Consolidation & Hits $2000.
Key Support Levels: $2000, $1925, $1888.
Key Resistance Levels: $2200, $2340, $2400.
Ethereum is now down a sharp 20% on the week as the cryptocurrency crashes into the $2000 support. It had been trading inside a symmetrical triangle pattern over the past three weeks but ended up breaking this consolidation on Friday as it dropped to $2200.
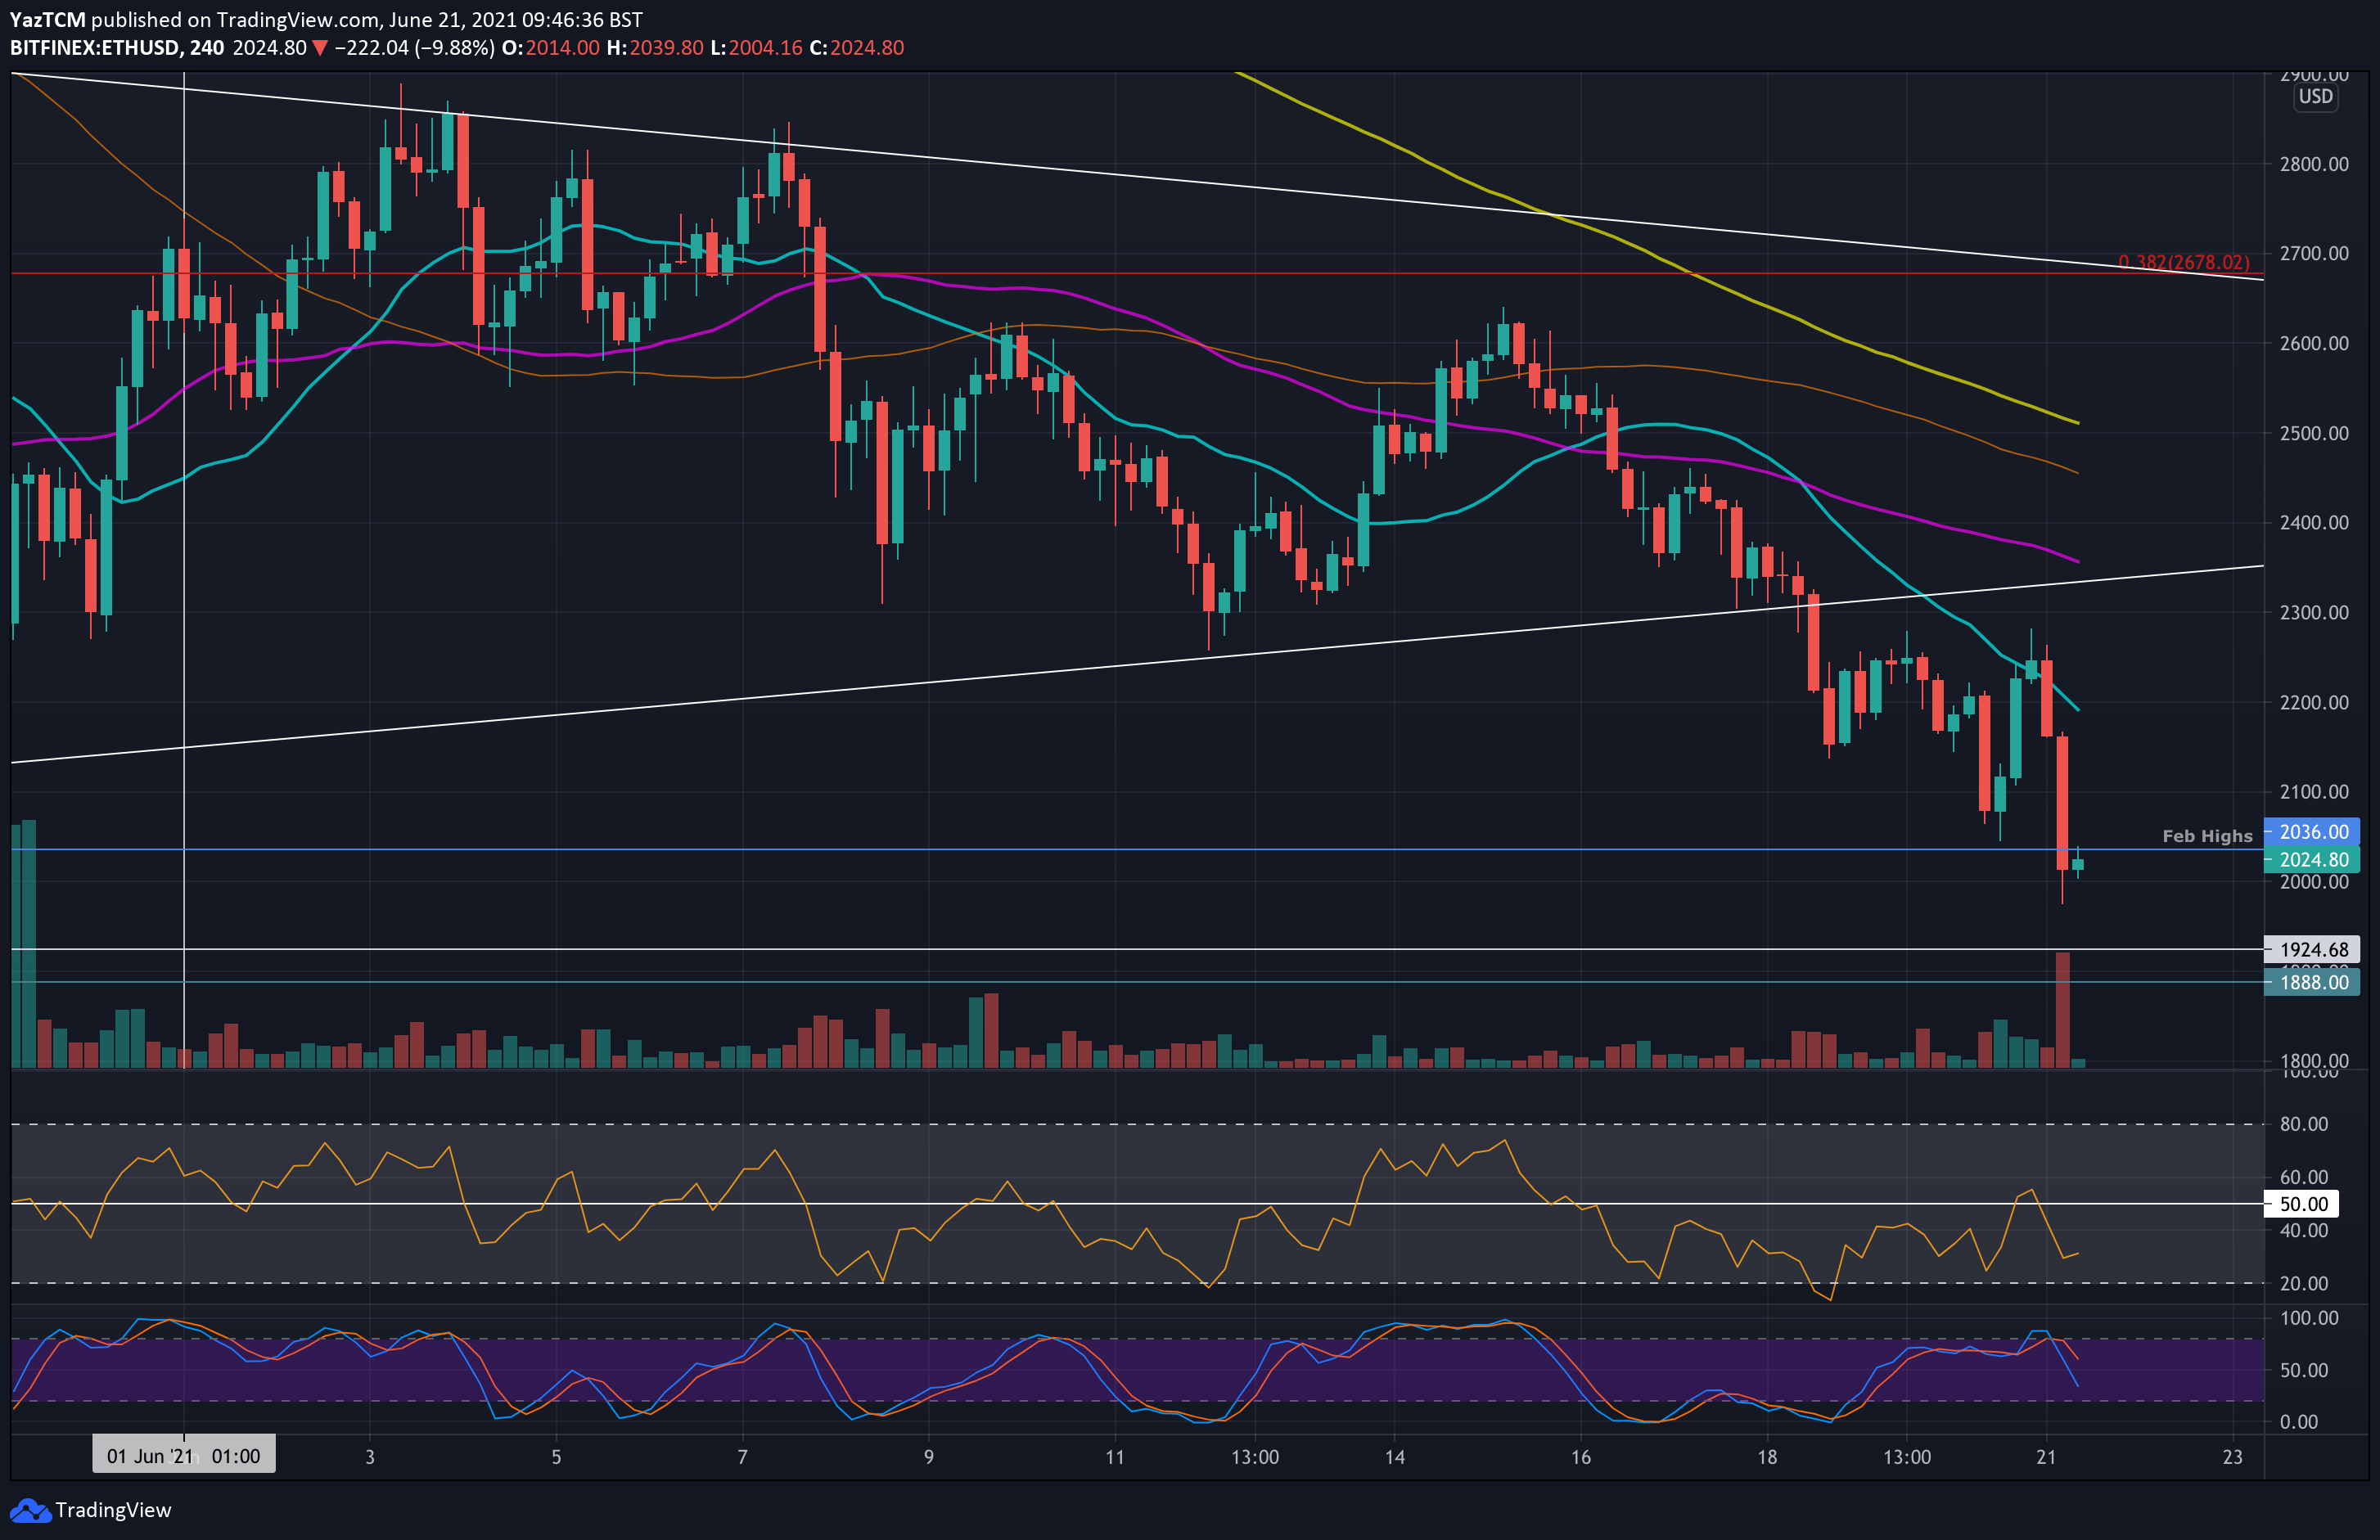
Yesterday, ETH showed signs of weakness after spiking into the Feb 2021 highs at $2036. It rebounded to close the daily candle for around $2245. Today, however, the sellers retook control and pushed ETH as low as $1975.
It has found support at $2000, a round psychological number bolstered by a .786 Fib Retracement. A break beneath here could send ETH much lower over the coming weeks.
ETH-USD Short Term Price Prediction
Looking ahead, if the bears break $2000, the first support lies at $1925 (May 23rd 4-HR rebound). This is followed by $1888 (.886 Fib & 200-day MA), $1800, and $1625 (downside 1.272 Fib Extension).
On the other side, the first resistance lies at $2200. This is followed by $2340, $2400, and $2500 (20-day & 50-day MA).
The daily RSI is now the lowest level since the May price capitulation and looks to be heading lower, indicating the bearish momentum is increasing. There is some hope on the 4HR chart as a hint of bullish divergence is emerging.
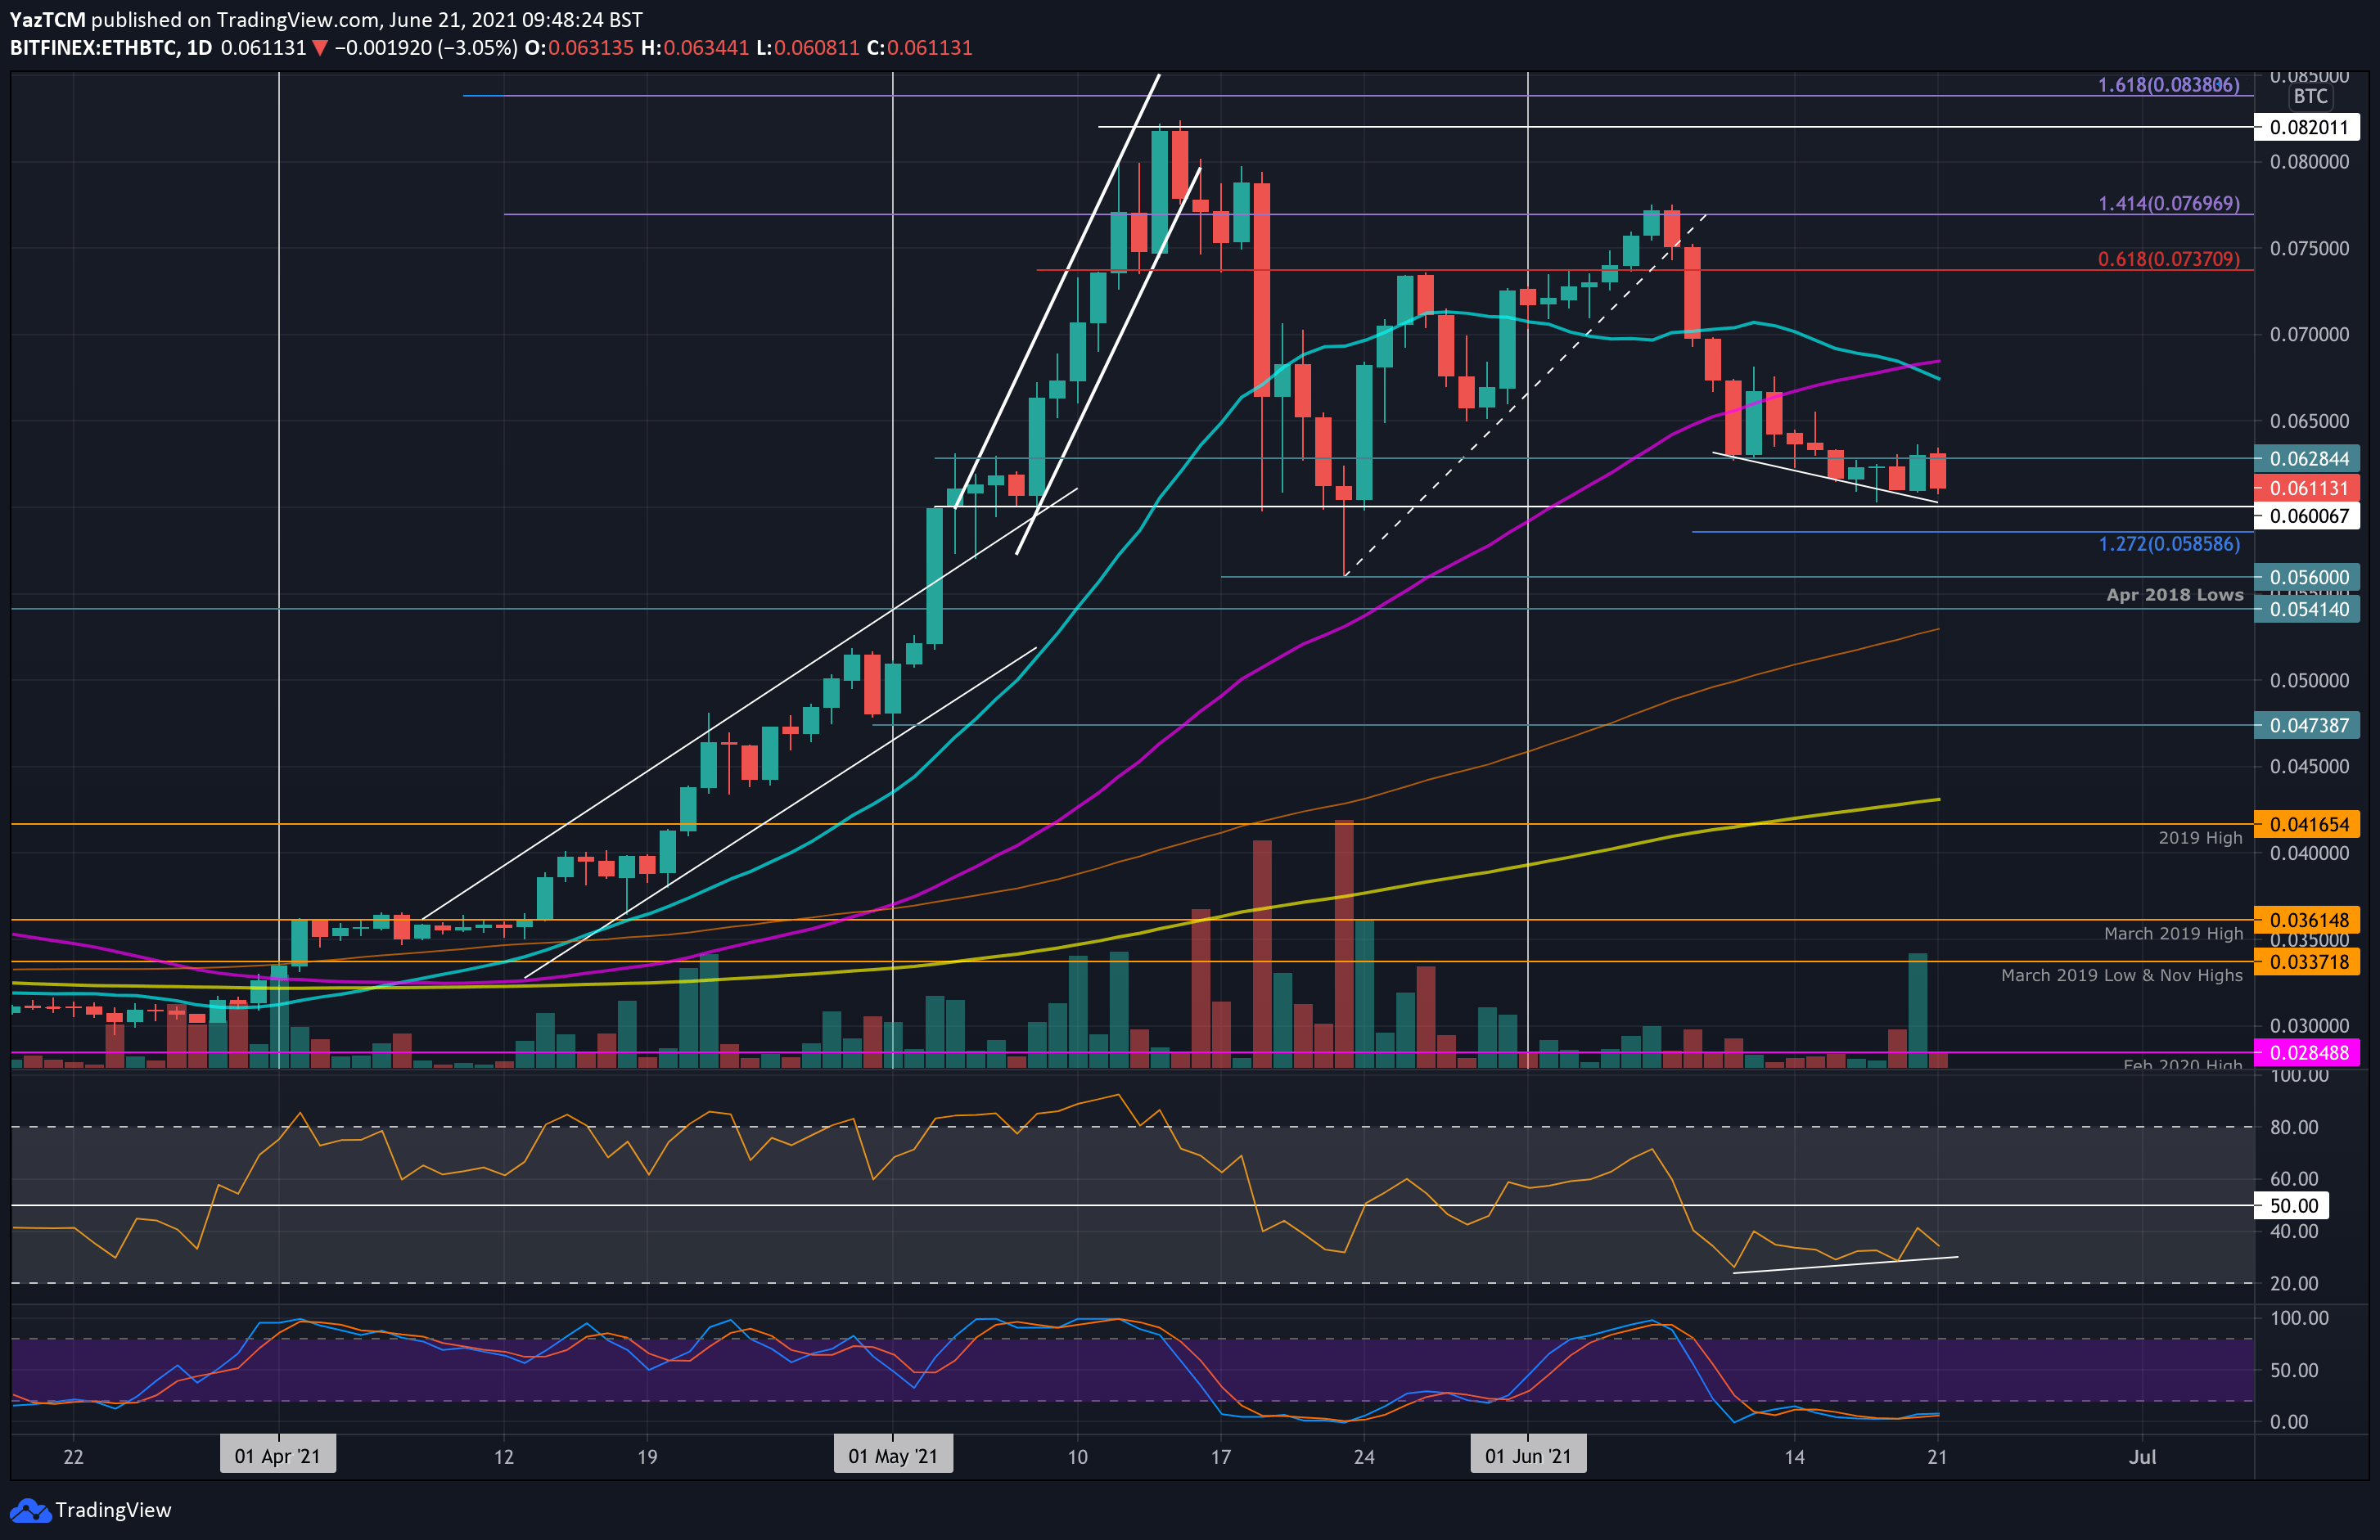
ETH/BTC – ETH Bearish Trend Continues To Develop With 0.06 BTC Critical Support
Key Support Levels: 0.06 BTC, 0.0585 BTC, 0.056 BTC.
Key Resistance Levels: 0.063 BTC, 0.065 BTC, 0.068 BTC.
Against BTC, the buyers are attempting to defend the support at 0.06 BTC. The sellers had penetrated support at 0.0628 BTC last week, but the buyers established 0.061 BTC as the next support.
With the increased bearish momentum in the market, it is not likely that this support will hold, and ETH is potentially heading beneath 0.06 BTC toward the late-May lows at 0.056 BTC.
ETH-BTC Short Term Price Prediction
Beneath 0.061 BTC, the first support lies at 0.06 BTC. This is followed by 0.0585 BTC (downside 1.272 Fib Extension), 0.056 BTC, 0.0541 BTC (April 2018 lows), and 0.0529 BTC (100-day MA).
On the other side, the first resistance lies at 0.063 BTC. This is followed by 0.065 BTC, 0.068 BTC (50-day MA), and 0.07 BTC.
The RSI is also well within the bearish territory but is slowly starting to rise. This could be the first signal that the bearish momentum is beginning to ease up a little. However, it could also indicate that the bears are taking a short break before increasing their selling pressure. Only time will tell if the RSI breaks beneath the highlighted rising support trend.