ETH/USD – Ether Plummets Into 00 Support Key Support Levels: 90, 70, 20.Key Resistance Levels: 00, 00, 50. Ethereum fell a sharp 11.5% today as it crashed back to 00. The cryptocurrency had dropped from near 00 at the start of September as it fell into support around 00 (.5 Fib Retracement) last week. A rising trend line bolstered the support, and it allowed ETH to rebound during the week. It reached as high as 00 last week but rolled over on Wednesday. By the weekend, ETH had returned to the support at the rising trend line and the 50-day MA around 80. Today, it collapsed beneath the trend line and the 50-day MA to reach as low as 20. It has since bounced from the low and is battling to hold above 00. The break beneath the trend
Topics:
Yaz Sheikh considers the following as important: ETH Analysis, ETHBTC, Ethereum (ETH) Price, ethusd
This could be interesting, too:
Mandy Williams writes Ethereum Derivatives Metrics Signal Modest Downside Tail Risk Ahead: Nansen
Jordan Lyanchev writes Weekly Bitcoin, Ethereum ETF Recap: Light at the End of the Tunnel for BTC
CryptoVizArt writes Will Weak Momentum Drive ETH to .5K? (Ethereum Price Analysis)
Jordan Lyanchev writes Bybit Hack Fallout: Arthur Hayes, Samson Mow Push for Ethereum Rollback
ETH/USD – Ether Plummets Into $3000 Support
Key Support Levels: $2890, $2770, $2720.
Key Resistance Levels: $3200, $3300, $3350.
Ethereum fell a sharp 11.5% today as it crashed back to $3000. The cryptocurrency had dropped from near $4000 at the start of September as it fell into support around $3200 (.5 Fib Retracement) last week. A rising trend line bolstered the support, and it allowed ETH to rebound during the week.
It reached as high as $3600 last week but rolled over on Wednesday. By the weekend, ETH had returned to the support at the rising trend line and the 50-day MA around $3280. Today, it collapsed beneath the trend line and the 50-day MA to reach as low as $2920. It has since bounced from the low and is battling to hold above $3000.
The break beneath the trend line is quite significant as it signals the discontinuation of a head and shoulders neckline that could see ETH reaching as low as $2600 (200-day MA).
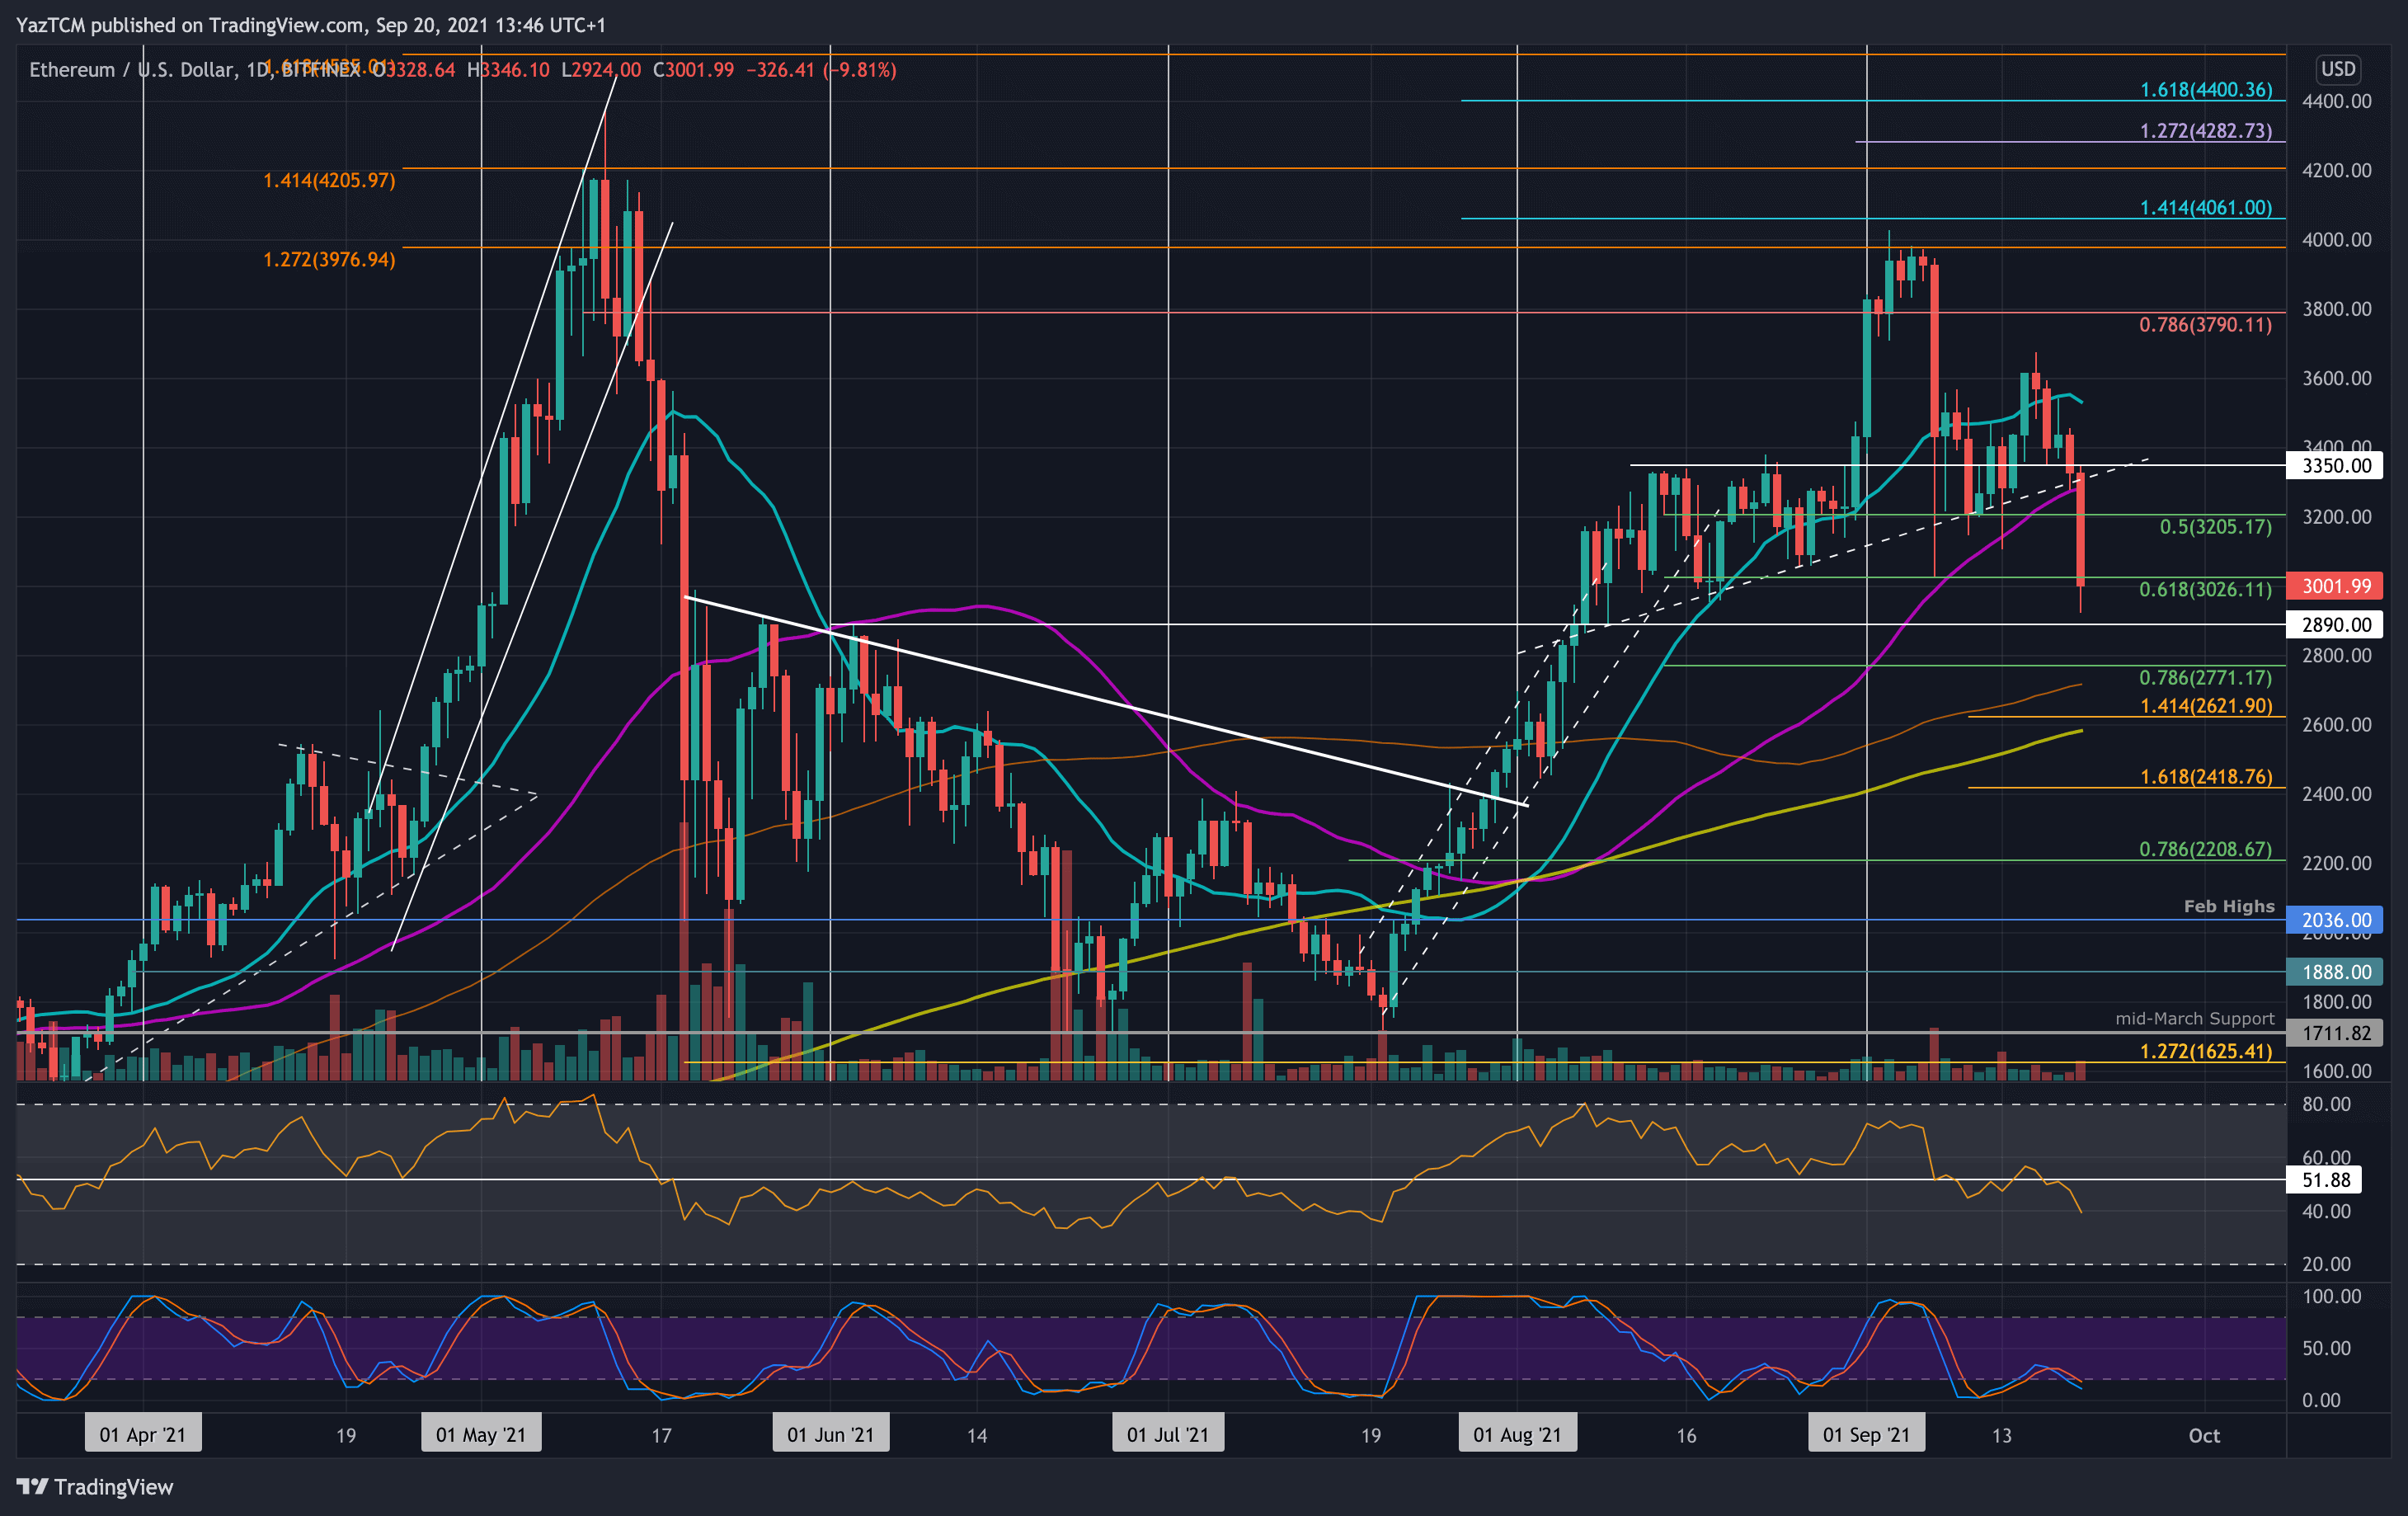
ETH-USD Short Term Price Prediction
Looking ahead, the first strong support lies at $2890 (June highs). This is followed by $2770 (.786 Fib), $2720 (100-day MA), and $2600 (200-day MA).
On the other side, the first resistance lies at $3200. This is followed by $3300 (50-day MA), $3350, $3550 (20-day MA), and $3600.
The daily RSI is now well beneath the midline and is the lowest level since late July. This indicates the bearish momentum is increasing significantly.
ETH/BTC – ETH Falls Into July Highs
Key Support Levels: 0.0691 BTC, 0.068 BTC, 0.066 BTC.
Key Resistance Levels: 0.07 BTC, 0.072 BTC, 0.0733 BTC.
ETH has also been struggling against BTC for the entire period of September. The coin started the month at a high of around 0.0787 BTC and rolled over from there. During the early-September market wipeout, ETH had done well to maintain the support at the 20-day MA around 0.072 BTC.
Last Friday, ETH slipped back beneath the 20-day MA and fell to 0.072 BTC. Over the weekend, ETH fell beneath a rising trend line to find the support at the 50-day MA around 0.07 BTC yesterday.
Today, ETH fell beneath the 50-day MA to reach the July highs at 0.0691 BTC.
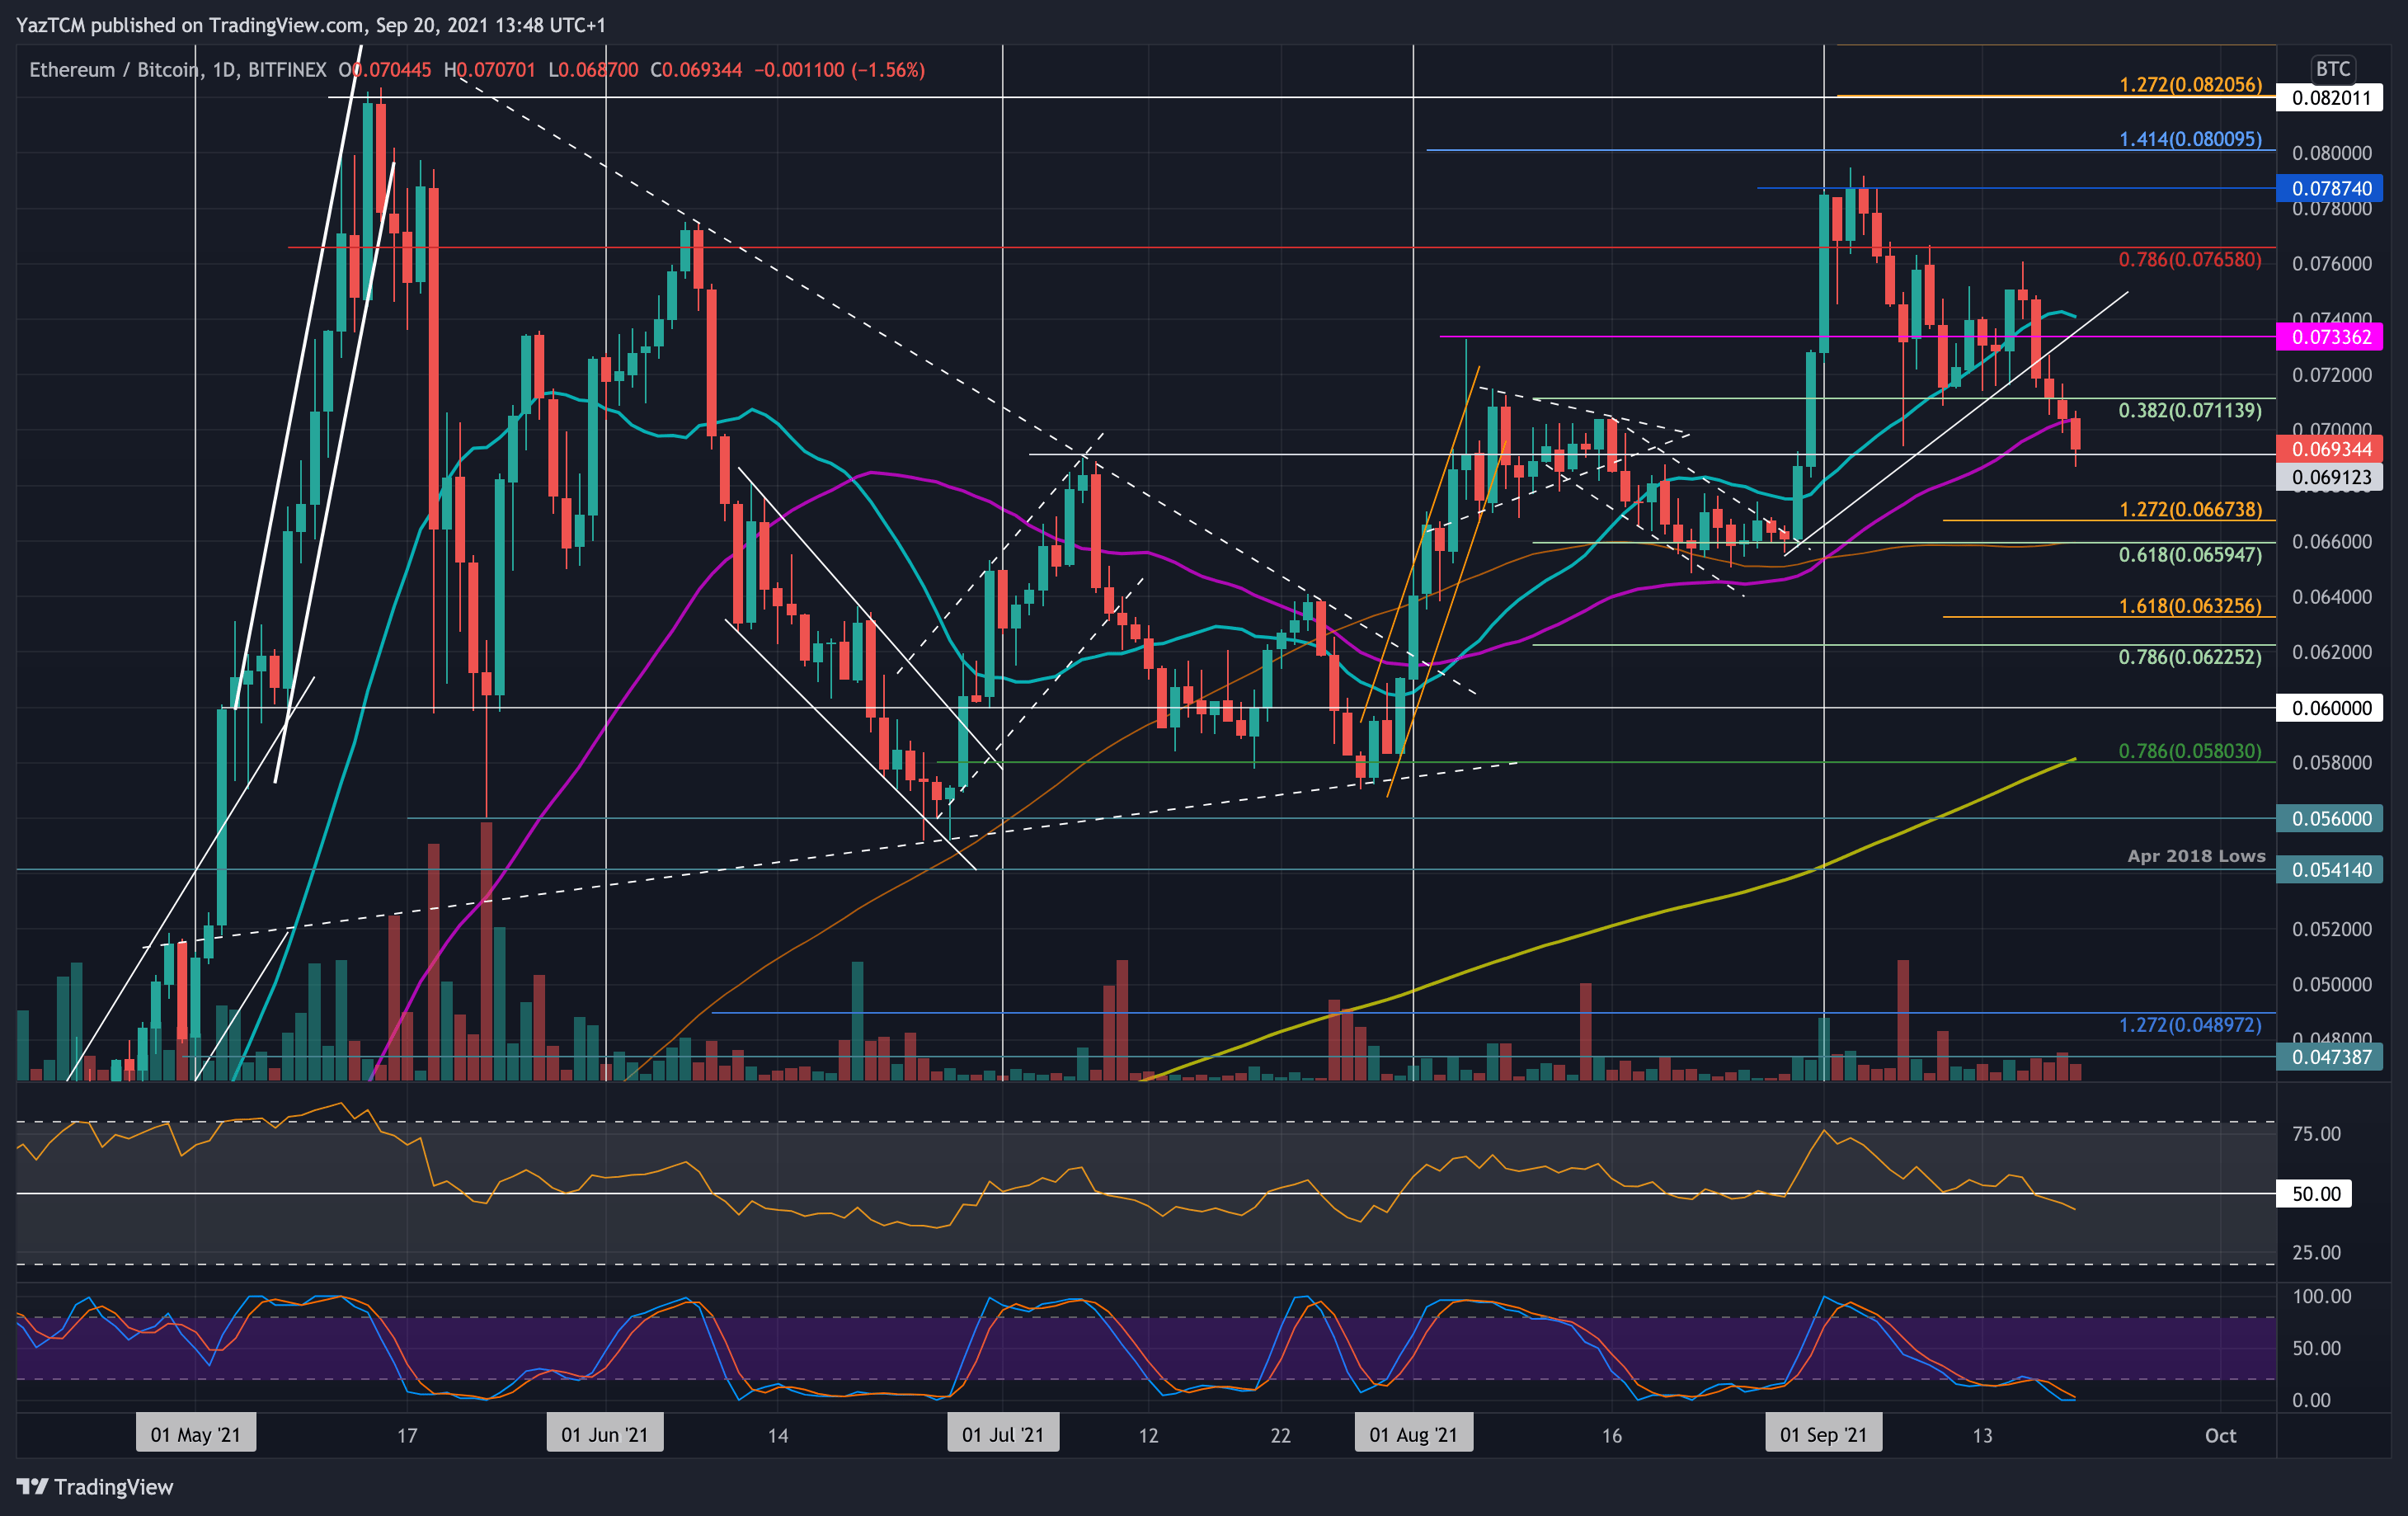
ETH-BTC Short Term Price Prediction
Moving forward, if the bears break the July highs at 0.0691 BTC, the first support lies at 0.068 BTC. This is followed by 0.066 BTC (downside 1.272 FIb Extension), 0.066 BTC (.618 Fib & 100-day MA), and 0.0632 BTC (downside 1.618 Fib Extension).
On the other side, the first resistance lies at 0.07 BTC (50-day MA). This is followed by 0.072 BTC, 0.0733 BTC (August highs), 0.074 BTC (20-day MA), and 0.0765 BTC (bearish .786 Fib).
The daily RSI also recently slipped beneath the midline, indicating that the bears are in control of the market momentum.