ETH/USD – Can ETH Break the 50-day MA Resistance Key Support Levels: 00, 35 – 00, 60. Key Resistance Levels: 65, 00, 50. Ethereum rebounded from support at 10 (June lows) earlier this week, as it quickly surged back above 00 on Wednesday. It then continued to surpass the 20-day moving average (MA) line and the 200-day MA, on Friday, along with breaking above a descending trend line that dates back to the start of June. Yesterday, ETH managed to reach as high as 00. There, it found resistance upon the critical 50-day MA and has since reversed back towards the 00 price area, where it is trading as of writing these lines. The following short-term 4-hour chart shows that ETH is trading inside a steep ascending price channel. The coin hit
Topics:
Yaz Sheikh considers the following as important: ETH Analysis, ETHBTC, Ethereum (ETH) Price, ethusd
This could be interesting, too:
Mandy Williams writes Ethereum Derivatives Metrics Signal Modest Downside Tail Risk Ahead: Nansen
Jordan Lyanchev writes Weekly Bitcoin, Ethereum ETF Recap: Light at the End of the Tunnel for BTC
CryptoVizArt writes Will Weak Momentum Drive ETH to .5K? (Ethereum Price Analysis)
Jordan Lyanchev writes Bybit Hack Fallout: Arthur Hayes, Samson Mow Push for Ethereum Rollback
ETH/USD – Can ETH Break the 50-day MA Resistance
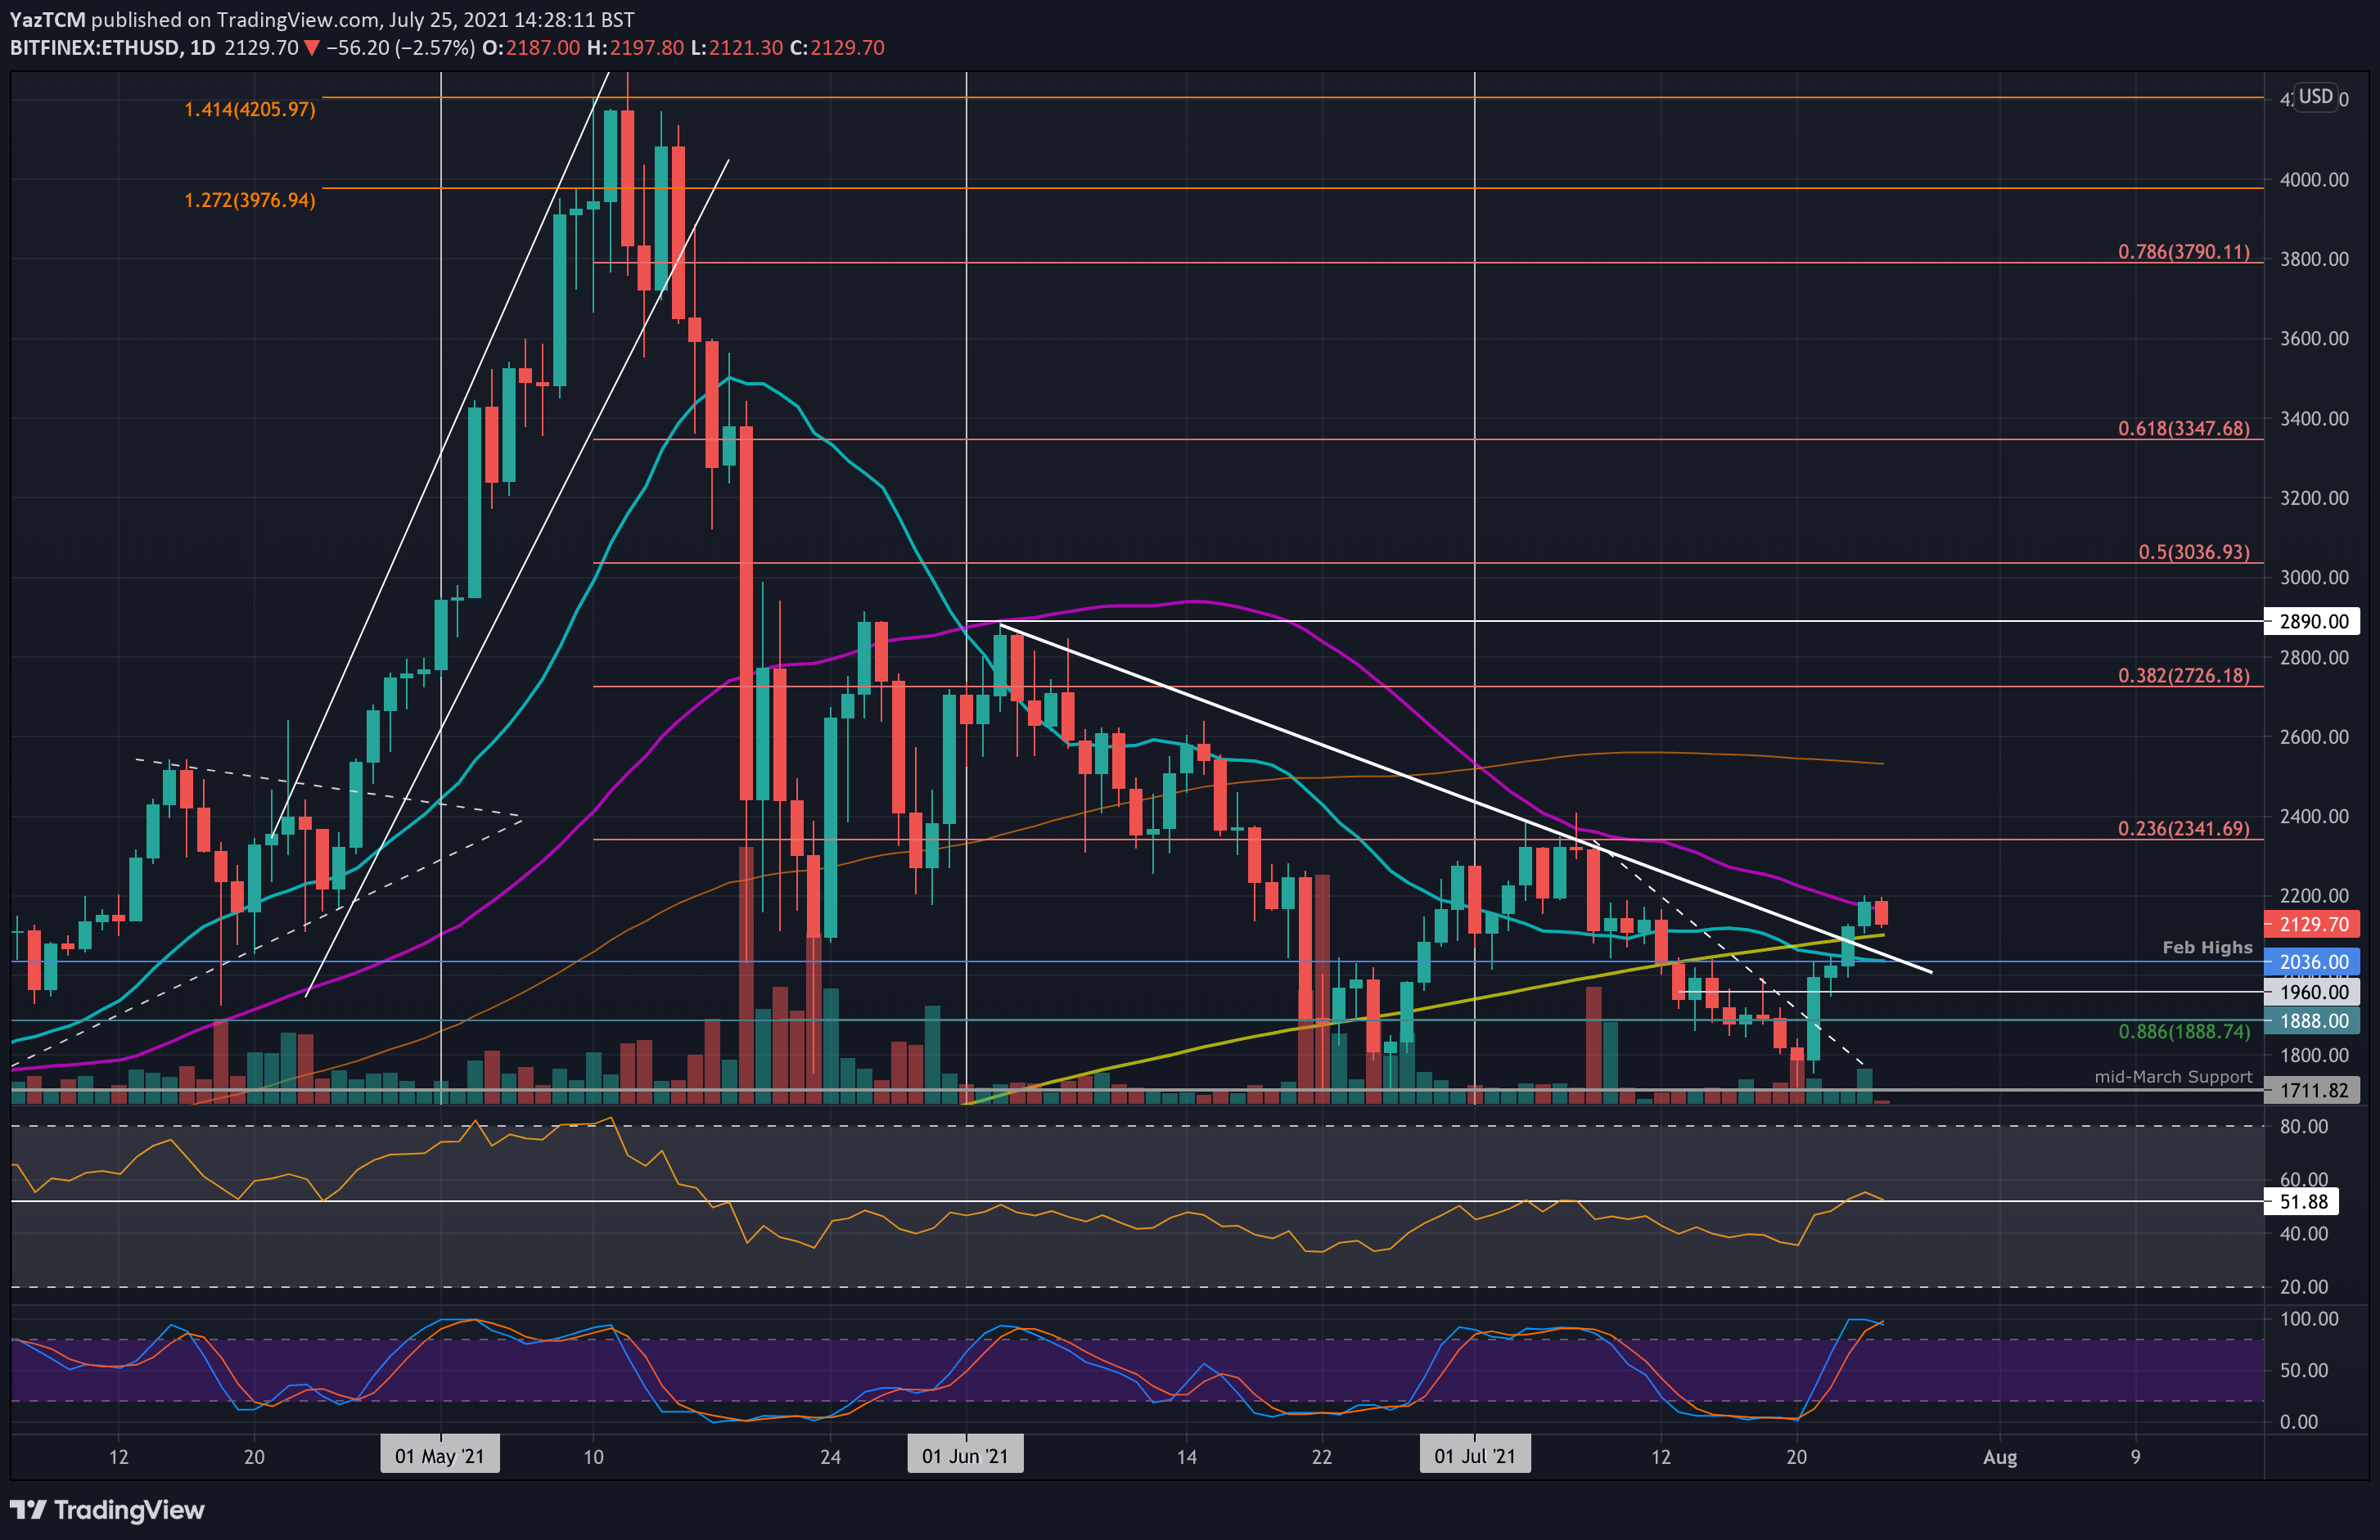
Key Support Levels: $2100, $2035 – $2000, $1960.
Key Resistance Levels: $2165, $2200, $2250.
Ethereum rebounded from support at $1710 (June lows) earlier this week, as it quickly surged back above $2000 on Wednesday. It then continued to surpass the 20-day moving average (MA) line and the 200-day MA, on Friday, along with breaking above a descending trend line that dates back to the start of June.
Yesterday, ETH managed to reach as high as $2200. There, it found resistance upon the critical 50-day MA and has since reversed back towards the $2100 price area, where it is trading as of writing these lines.
The following short-term 4-hour chart shows that ETH is trading inside a steep ascending price channel. The coin hit resistance at $2200 yesterday, provided by a 1.272 Fib Extnesion, and has since retraced to reach the lower boundary of the price channel.
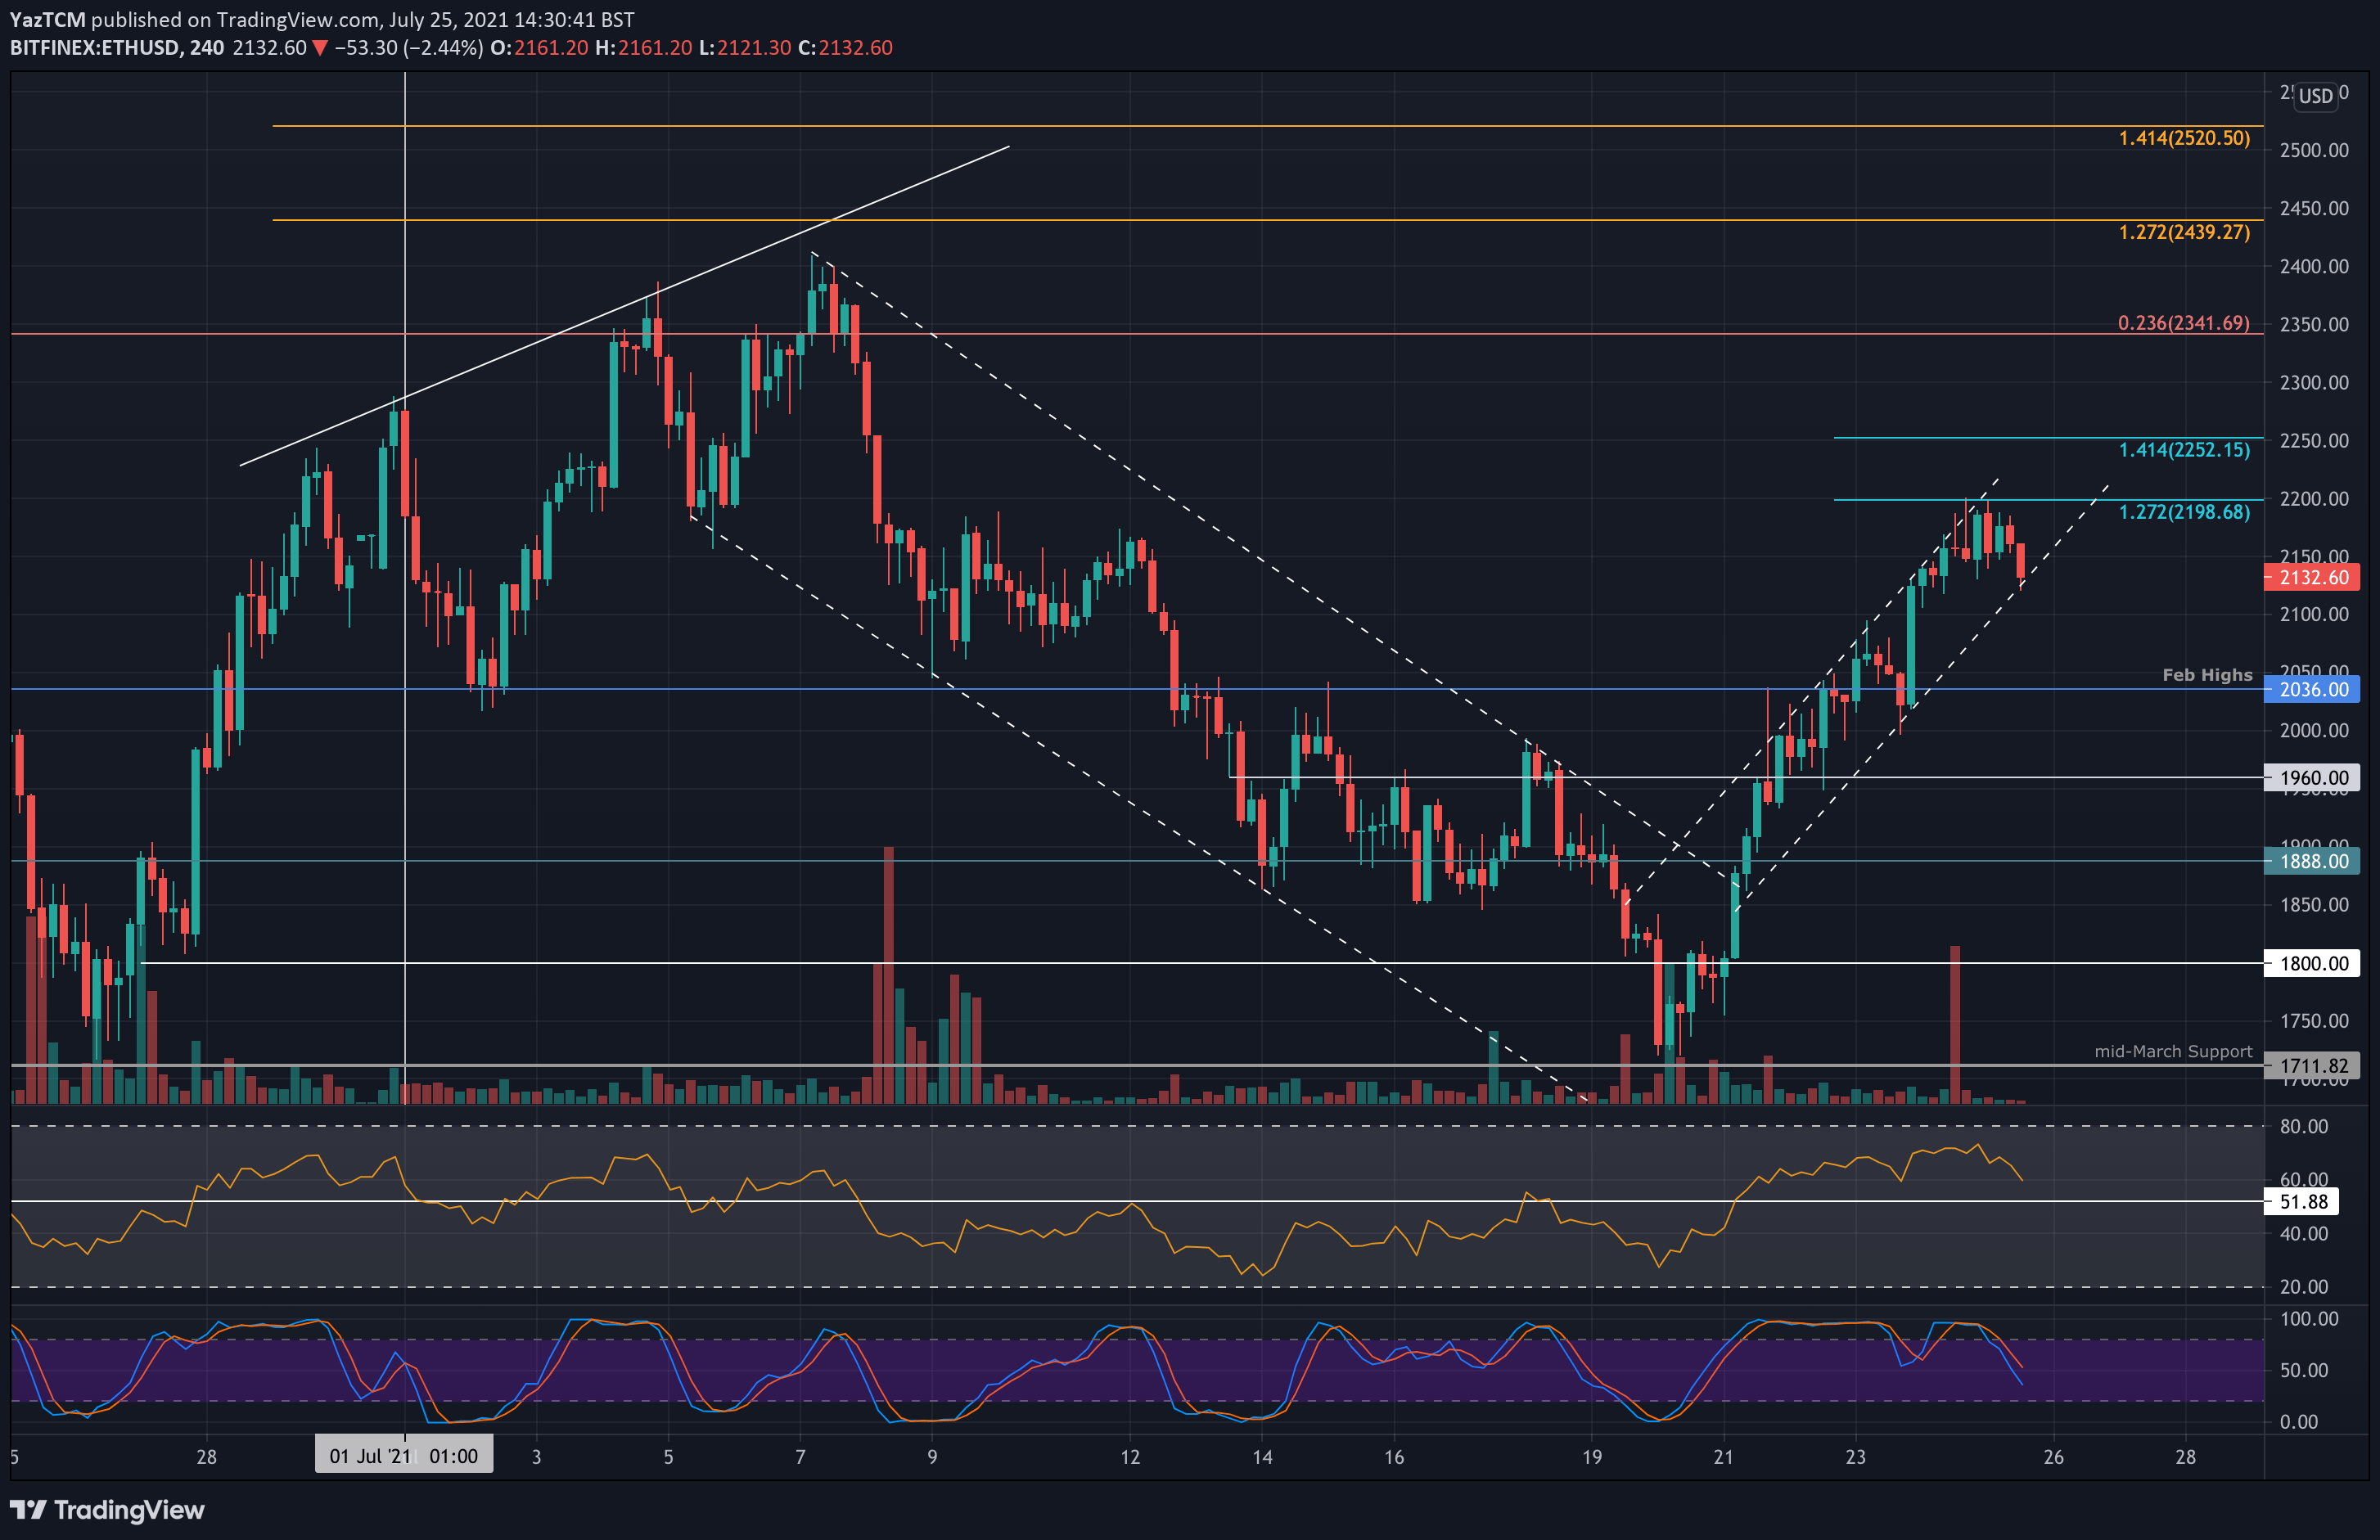
ETH-USD Short Term Price Prediction
Looking ahead, if the bears push beneath and break down the price channel, the first support lies at $2100 (200-day MA). This is followed by support between $2035 (20-day MA & Feb 2021 highs) and $2000. Further support lies around $1960.
On the other side, the first resistance lies at $2165 (50-day MA). This is closely followed by $2200 (1.272 Fib Extension), $2250 (1.414 Fib Extension), and $2340 (bearish .236 Fib Retracement & July resistance).
The daily RSI recently broke above the midline for the first time since mid-May, indicating the first bullish momentum within the market.
ETH/BTC – ETH Trades Inside Wide Symmetrical Triangle Pattern
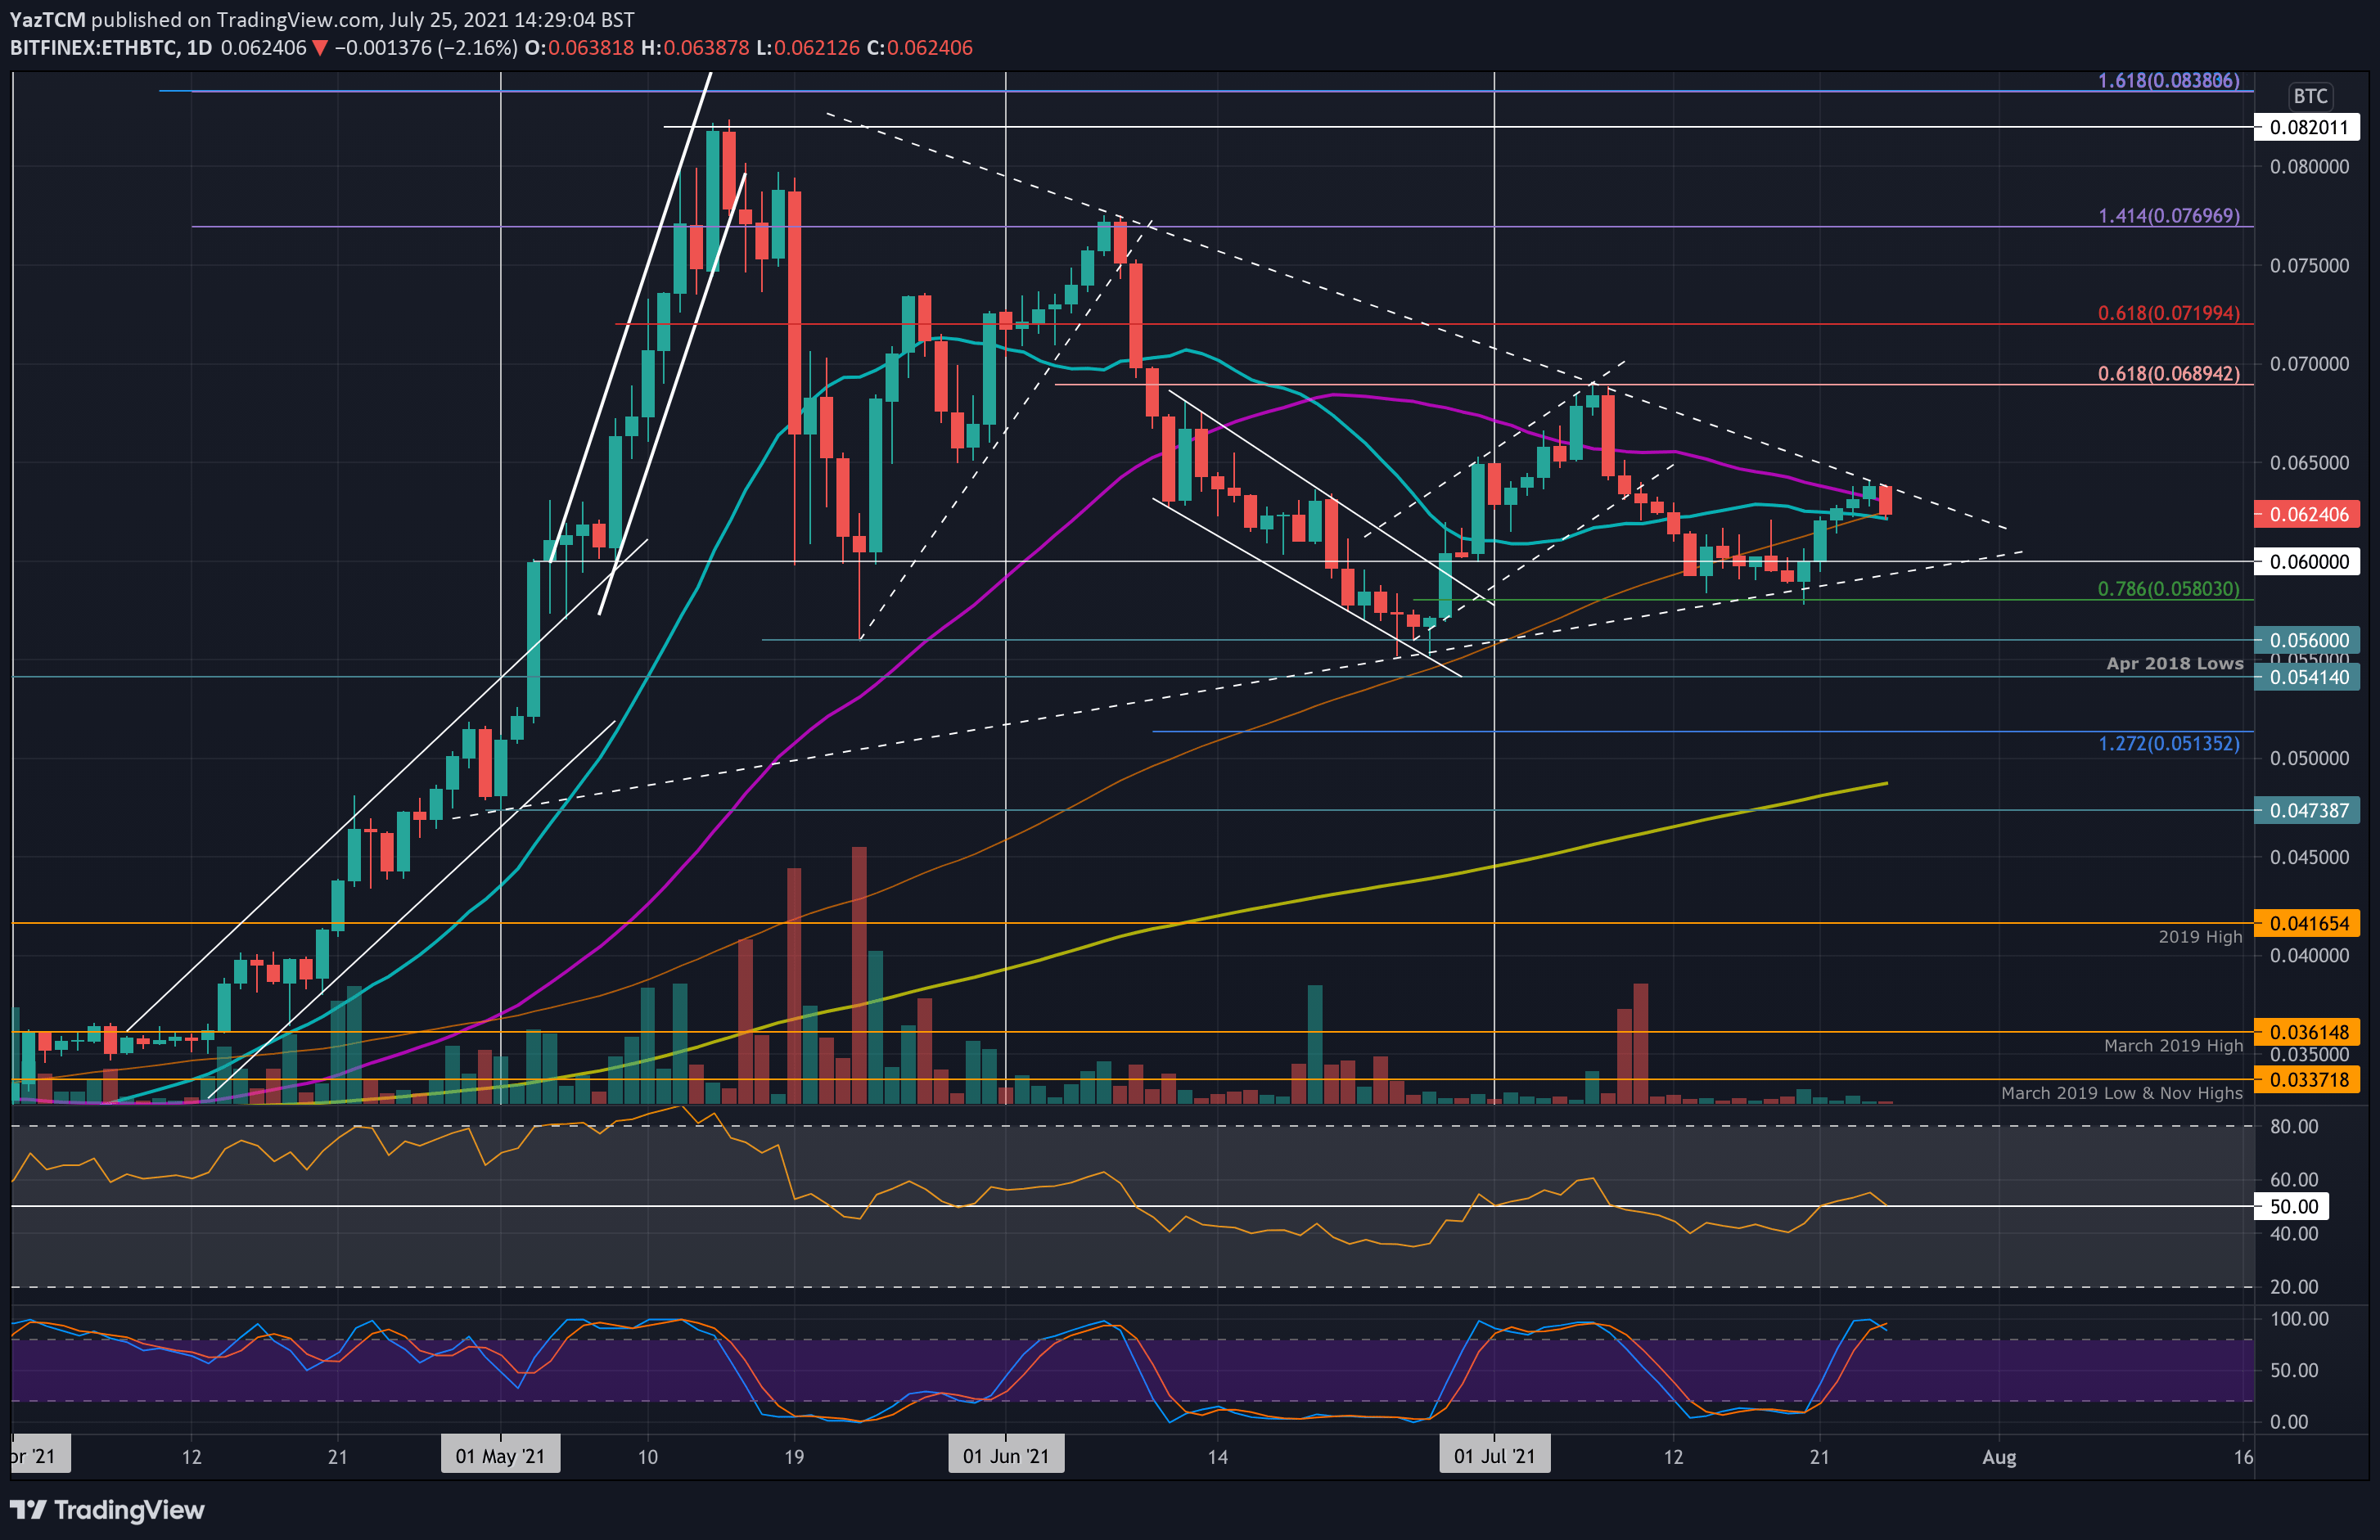
Key Support Levels: 0.0624 BTC, 0.06 BTC, 0.058 BTC.
Key Resistance Levels: 0.063 – 0.064 BTC, 0.069 – 0.07 BTC.
Against BTC, ETH found support around 0.058 BTC (.786 Fib) earlier in the week. This level was further supported by the lower angle of a symmetrical triangle, as shown below, and it allowed ETH to rebound back above 0.06 BTC.
ETH/BTC continued higher to break the 50-day MA yesterday. However, it found resistance at the upper angle of the marked symmetrical triangle and has since rolled over to trade at 0.0624 BTC, which is a key support level provided by the 100 and 20 days MA lines.
ETH-BTC Short Term Price Prediction
Moving forward, if the sellers break the support at the 20-day MA, the first lower support lies at 0.06 BTC. Beneath the triangle, added support lie sat 0.058 BTC (.786 Fib) and 0.056 BTC.
On the other side, the first resistance lies between 0.063 BTC (50-day MA) and 0.064 BTC (triangle upper angle). The next resistance lies at 0.069 – 0.07 BTC (bearish .618 Fib & July resistance).
The RSI is at the midline as indecision looms within the market after it met resistance at the triangle’s upper angle.