ETH/USD – Ether Shows Sings Of Bearish Divergence At 60 Resistance. Key Support Levels: 00, 90, 80.Key Resistance Levels: 60, 00, 50. Since bouncing from 10 on July 20th, Etheruem has surged by a solid 90% to reach as high as 70. The coin initially moved inside an ascending price channel but eventually broke toward the upside over the weekend. After that, ETH pushed higher to meet resistance at 60. Since then, it struggled to produce a daily closing candle above the level. More recently, ETH is starting to show signs of bearish divergence on the 4-hour chart as the price makes higher highs, but the RSI produces lower highs. This could possibly be a hint that a retracement is imminent before ETH can continue higher. ETH/USD Daily Chart. Source:
Topics:
Yaz Sheikh considers the following as important: ETH Analysis, ETHBTC, Ethereum (ETH) Price, ethusd
This could be interesting, too:
Mandy Williams writes Ethereum Derivatives Metrics Signal Modest Downside Tail Risk Ahead: Nansen
Jordan Lyanchev writes Weekly Bitcoin, Ethereum ETF Recap: Light at the End of the Tunnel for BTC
CryptoVizArt writes Will Weak Momentum Drive ETH to .5K? (Ethereum Price Analysis)
Jordan Lyanchev writes Bybit Hack Fallout: Arthur Hayes, Samson Mow Push for Ethereum Rollback
ETH/USD – Ether Shows Sings Of Bearish Divergence At $3160 Resistance.
Key Support Levels: $3000, $2890, $2680.
Key Resistance Levels: $3160, $3200, $3350.
Since bouncing from $1710 on July 20th, Etheruem has surged by a solid 90% to reach as high as $3170. The coin initially moved inside an ascending price channel but eventually broke toward the upside over the weekend.
After that, ETH pushed higher to meet resistance at $3160. Since then, it struggled to produce a daily closing candle above the level. More recently, ETH is starting to show signs of bearish divergence on the 4-hour chart as the price makes higher highs, but the RSI produces lower highs.
This could possibly be a hint that a retracement is imminent before ETH can continue higher.


ETH-USD Short Term Price Prediction
Looking ahead, the first resistance lies at $3160. This is followed by $3200, $3350 (bearish .618 Fib), $3540 (1.618 Fib Extension), and $3600.
On the other side, the first strong support lies at $3000. This is followed by $2890 (June highs), $2680 (.382 Fib & 20-day MA), and $2550 (100-day MA).
As mentioned, the 4-hour RSI is showing signs of bearish divergence, signaling a potential retracement is incoming.
ETH/BTC – ETH Struggles To Reclaim 0.07 BTC.
Key Support Levels: 0.067 BTC, 0.066 BTC, 0.0651 BTC.
Key Resistance Levels: 0.07 BTC, 0.072 BTC, 0.074 BTC.
ETH is currently struggling to close a daily candle back above 0.07 BTC. It had penetrated above a symmetrical triangle at the beginning of August and surged higher inside an ascending price channel to reach 0.071 BTC.
Since hitting 0.071 BTC, ETH dropped lower to find support at 0.067 BTC (.382 Fib) and rebound. However, it is still struggling to close back above 0.07 BTC.
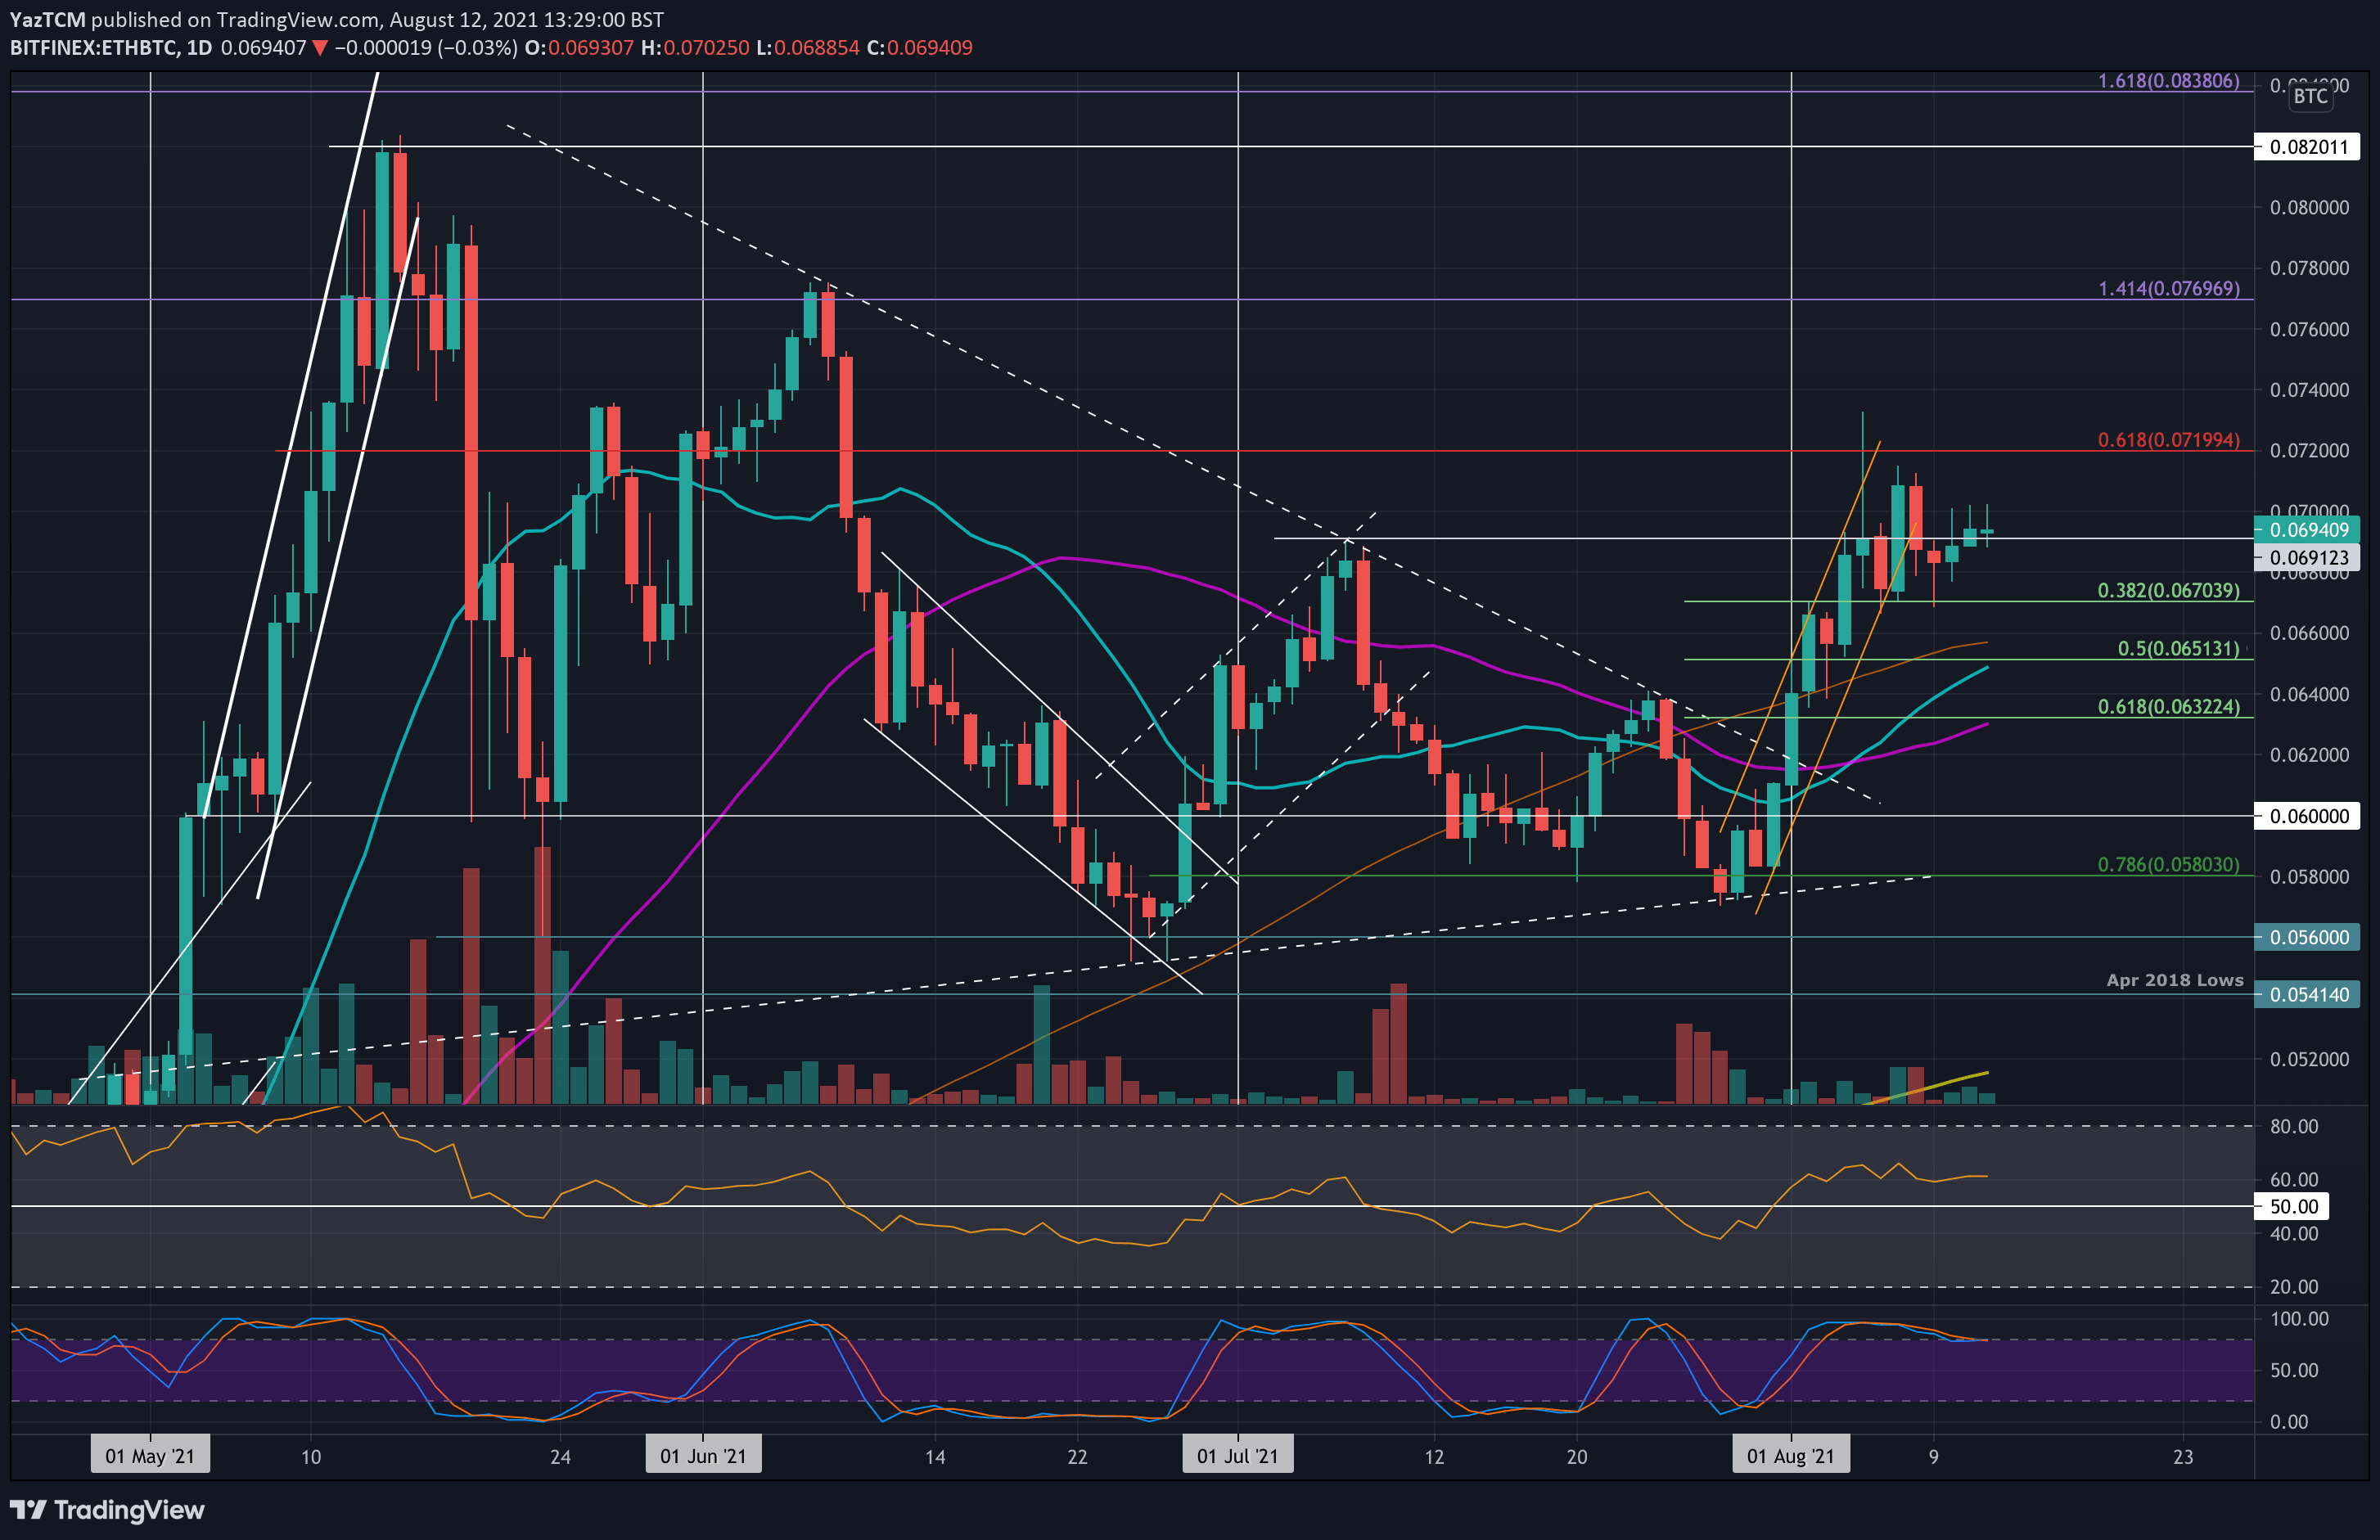
ETH-BTC Short Term Price Prediction
Moving forward, the first resistance lies at 0.07 BTC. This is followed by 0.072 BTC (bearish .618 Fib), 0.074 BTC, and 0.077 BTC (1.414 Fib Extension).
On the other side, the first support lies at 0.067 BTC (.382 Fib). This is followed by 0.066 BTC (100-day MA), 0.0651 BTC (.5 Fib & 20-day MA), and 0.0632 BTC (.618 Fib & 50-day MA).
The daily RSI is above 60 but is flatlining, indicating the bullish momentum might be starting to fade.
The daily RSI is above 60, indicating the bulls still remain in charge of the market momentum.