ETH/USD – Ether Forms Short Term Rising Wedge Key Support Levels: 00, 00, 35 – 00.Key Resistance Levels: 40, 00, 40. Ethereum has seen a promising start to July as it breaks above the 20-day MA and heads above 00. The cryptocurrency now faces resistance at 40, provided by a .236 Fib Retracement, and is trading above a rising trend line. The rising trend line also forms the lower angle of a rising wedge formation on the 4-hour chart. Typically, rising wedges are bearish patterns, and it could signal a potential retest of the July lows at around ,000. ETH/USD Daily Chart. Source: TradingView.ETH/USD 4-Hour Chart. Source: TradingView.ETH-USD Short Term Price Prediction Looking ahead, the first strong resistance lies at 40 (bearish .236 Fib).
Topics:
Yaz Sheikh considers the following as important: ETH Analysis, ETHBTC, Ethereum (ETH) Price, ethusd
This could be interesting, too:
Mandy Williams writes Ethereum Derivatives Metrics Signal Modest Downside Tail Risk Ahead: Nansen
Jordan Lyanchev writes Weekly Bitcoin, Ethereum ETF Recap: Light at the End of the Tunnel for BTC
CryptoVizArt writes Will Weak Momentum Drive ETH to .5K? (Ethereum Price Analysis)
Jordan Lyanchev writes Bybit Hack Fallout: Arthur Hayes, Samson Mow Push for Ethereum Rollback
ETH/USD – Ether Forms Short Term Rising Wedge
Key Support Levels: $2200, $2100, $2035 – $2000.
Key Resistance Levels: $2340, $2400, $2440.
Ethereum has seen a promising start to July as it breaks above the 20-day MA and heads above $2200. The cryptocurrency now faces resistance at $2340, provided by a .236 Fib Retracement, and is trading above a rising trend line.
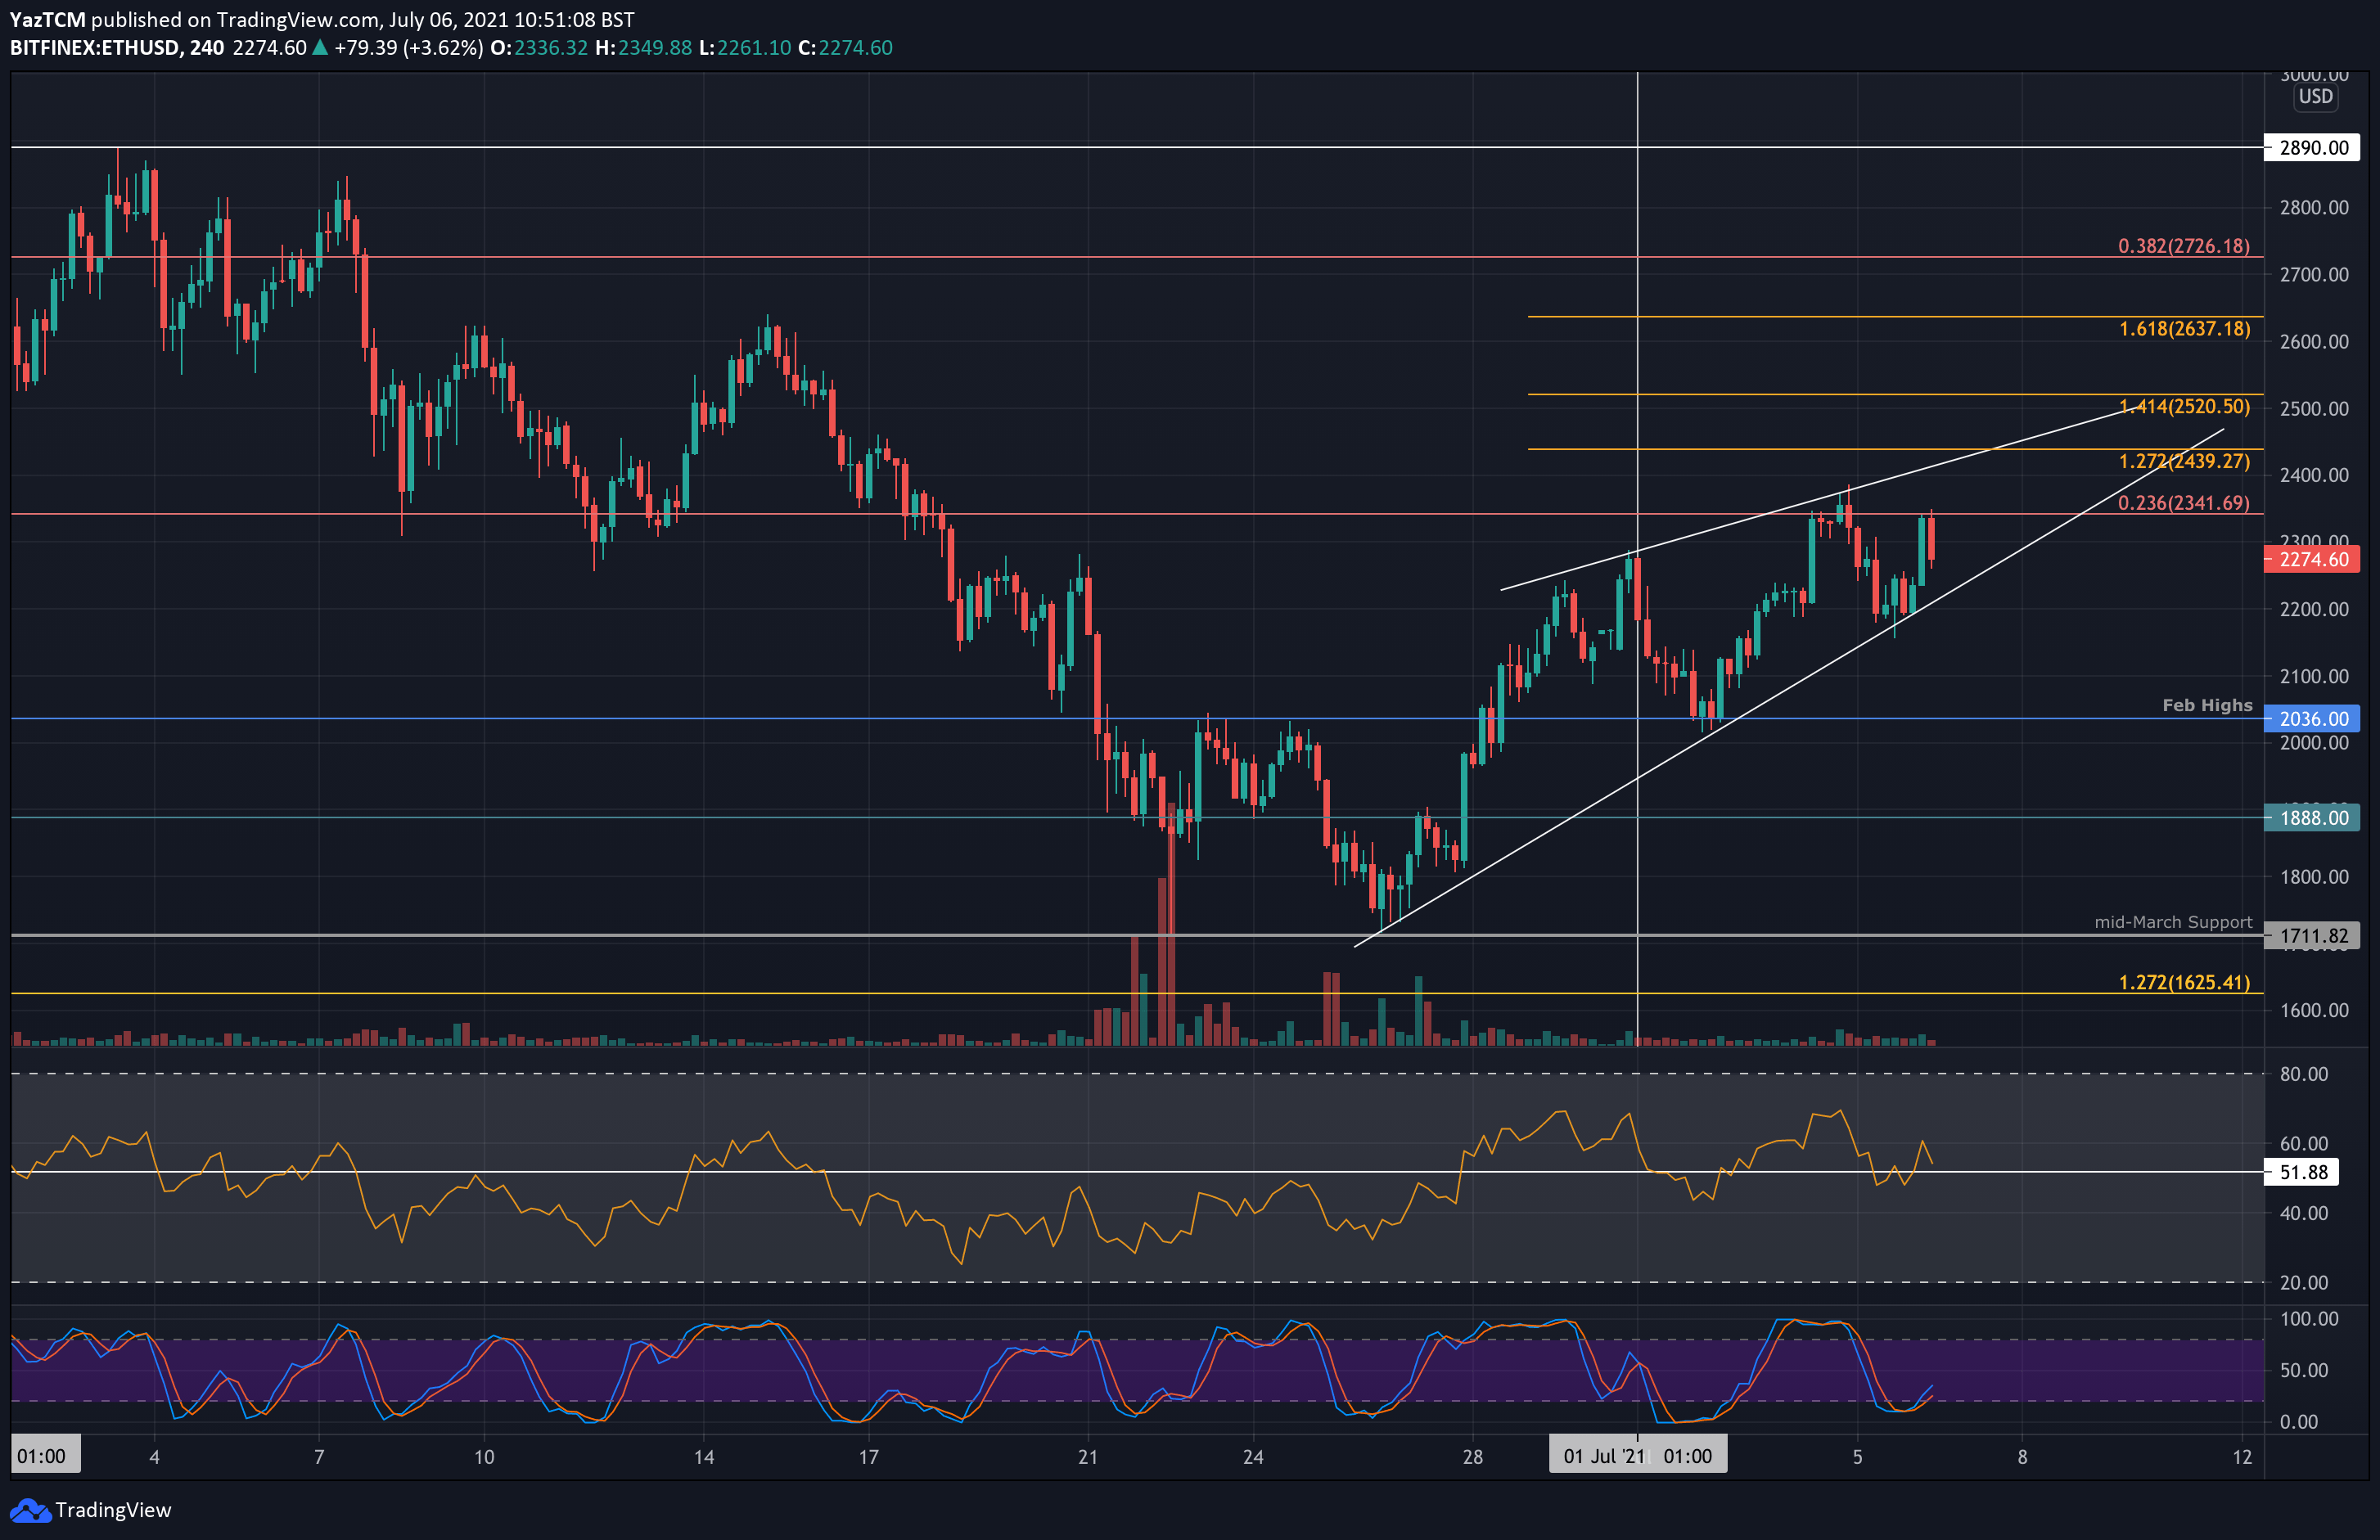
The rising trend line also forms the lower angle of a rising wedge formation on the 4-hour chart. Typically, rising wedges are bearish patterns, and it could signal a potential retest of the July lows at around $2,000.
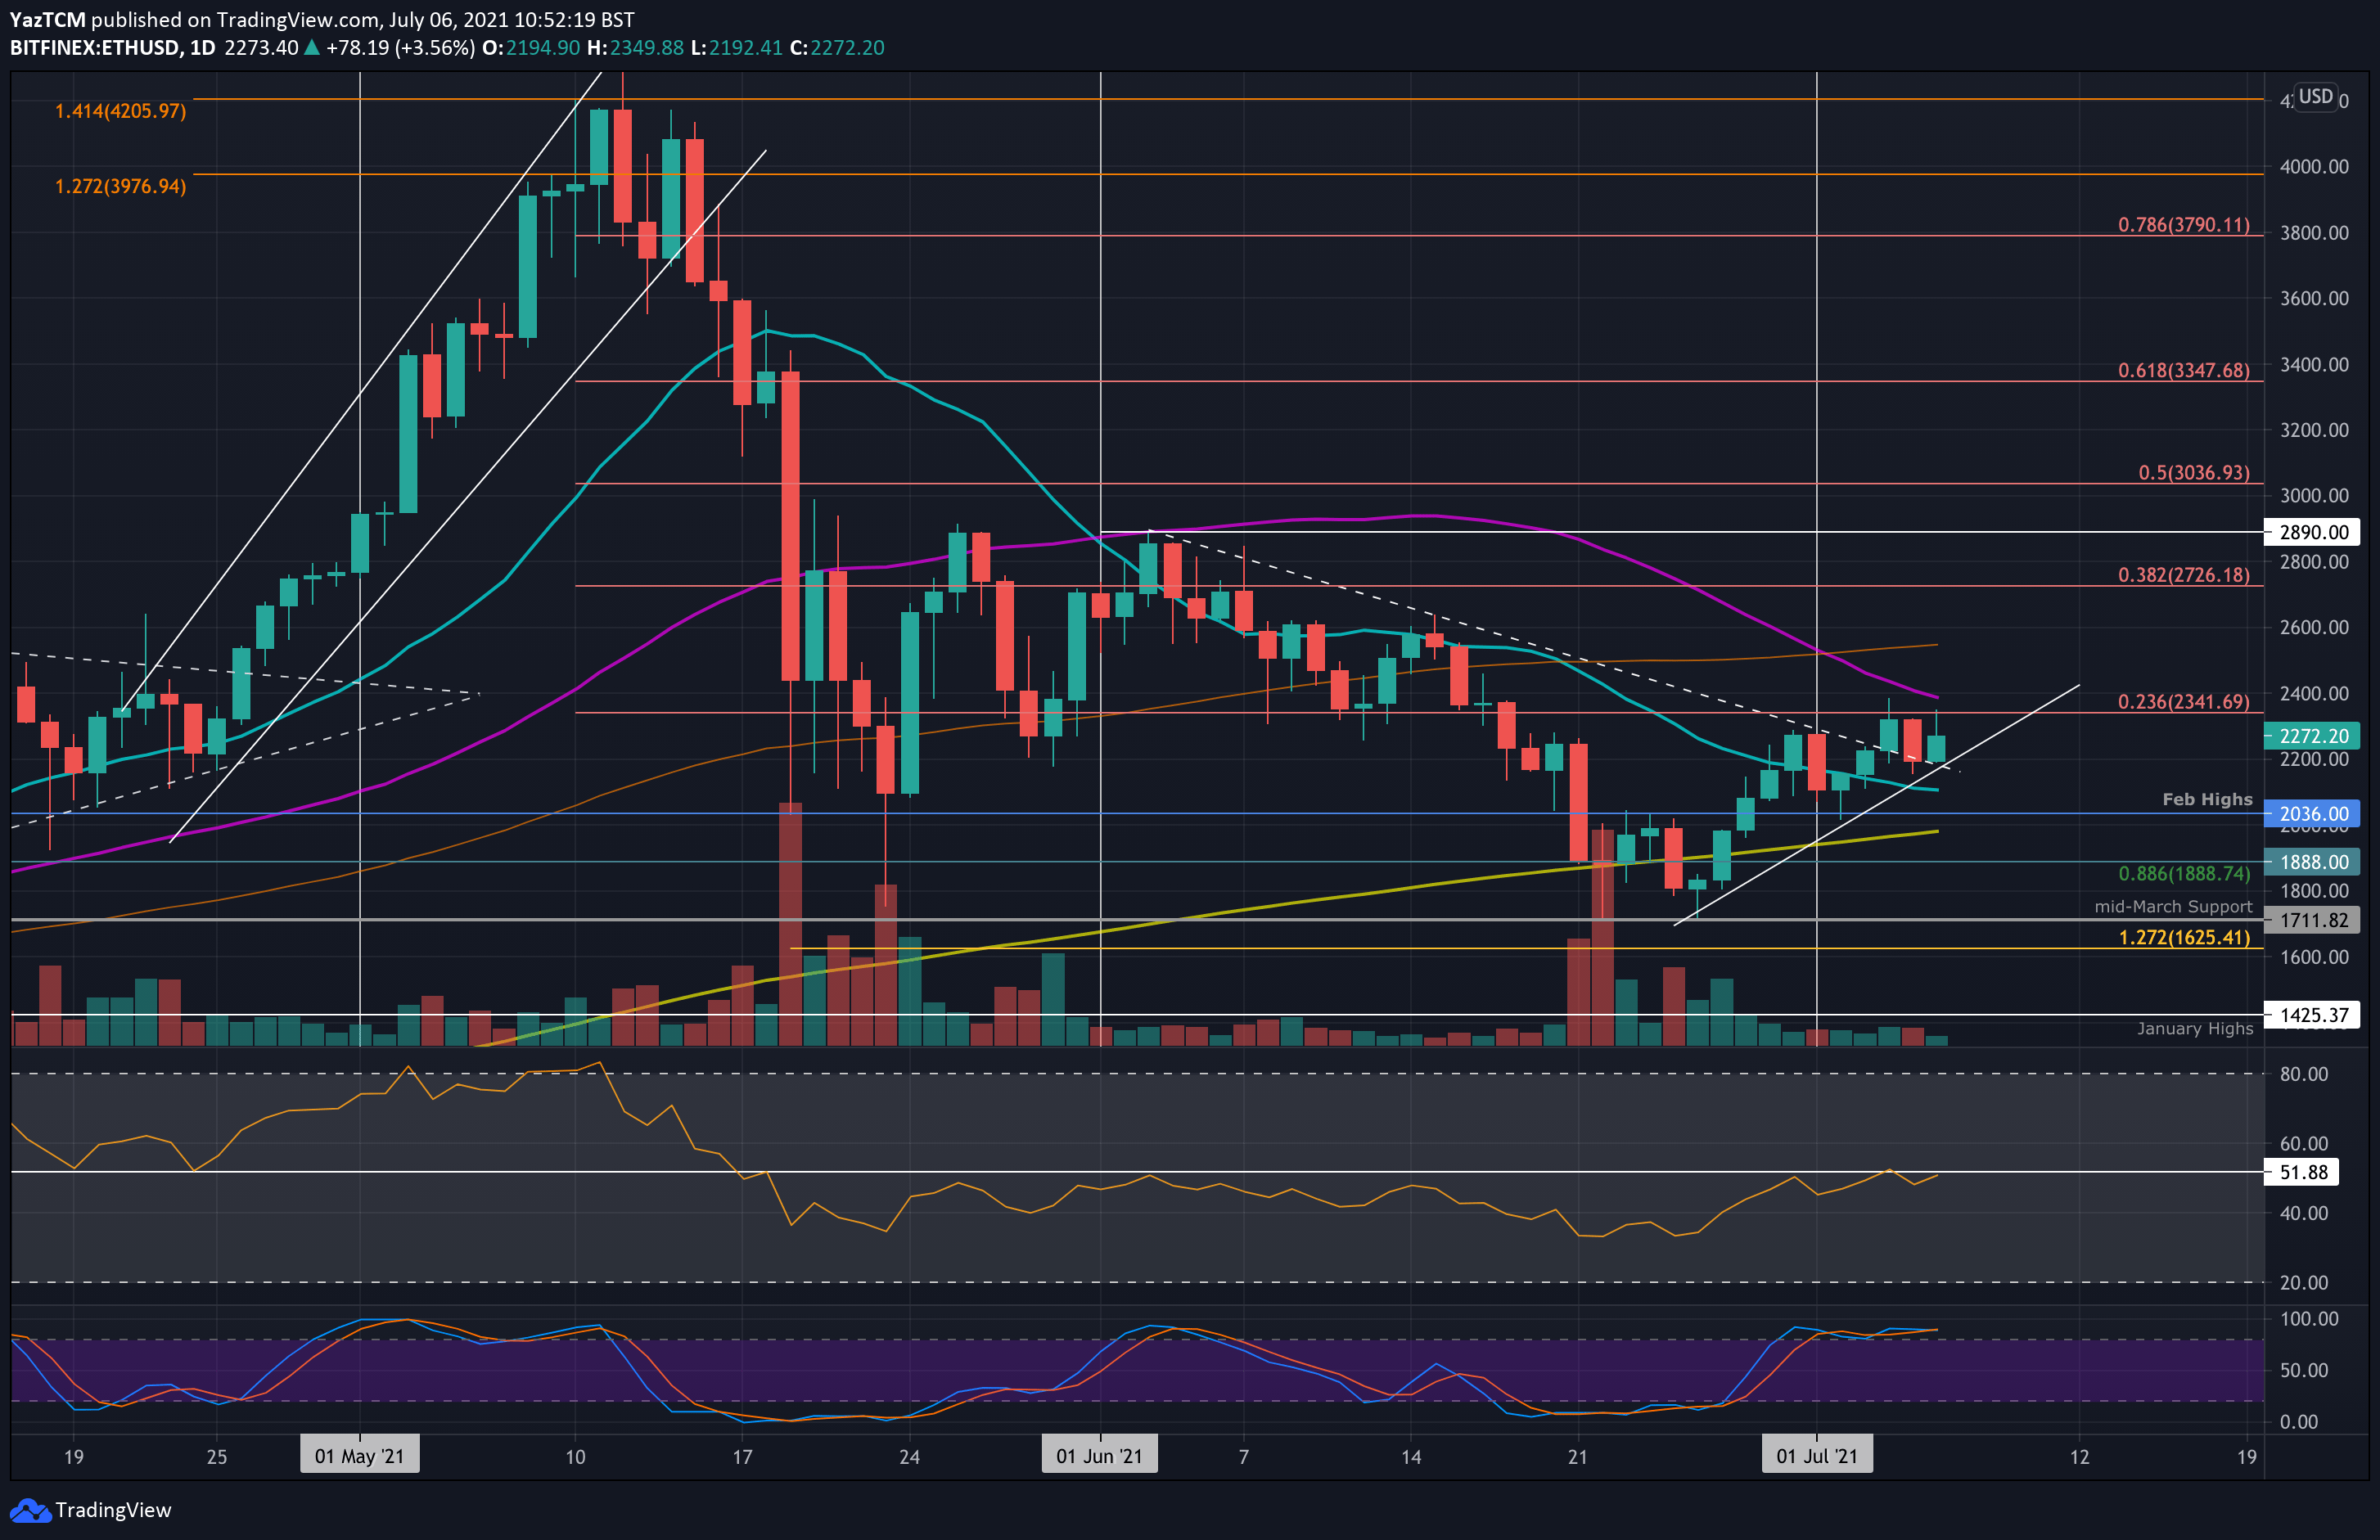
ETH-USD Short Term Price Prediction
Looking ahead, the first strong resistance lies at $2340 (bearish .236 Fib). This is followed by $2400 (50-day MA), $2440 (1.272 Fib Extension & upper angle of rising wedge), and $2550 (100-day MA).
On the other side, the first support lies at $2200 (lower angle of wedge). This is followed by $2100 (20-day MA), and then between $2035 (Feb 2021 highs) & $2000 (200-day MA).
The daily RSI continues to battle the midline, indicating indecision within the market. In addition, the 4-hour RSI is starting to show potential bearish divergence hints and could signal a breakdown of the wedge.
ETH/BTC – Bulls Break 50-day MA.
Key Support Levels: 0.066 BTC, 0.063 BTC, 0.061 BTC.
Key Resistance Levels: 0.068 BTC, 0.0689 BTC, 0.07 BTC.
Etheruem managed to push above the 50-day MA at 0.0659 BTC against bitcoin. If today’s candle can close above the 50-day MA, it would be the first closing candle above it since June 12th.
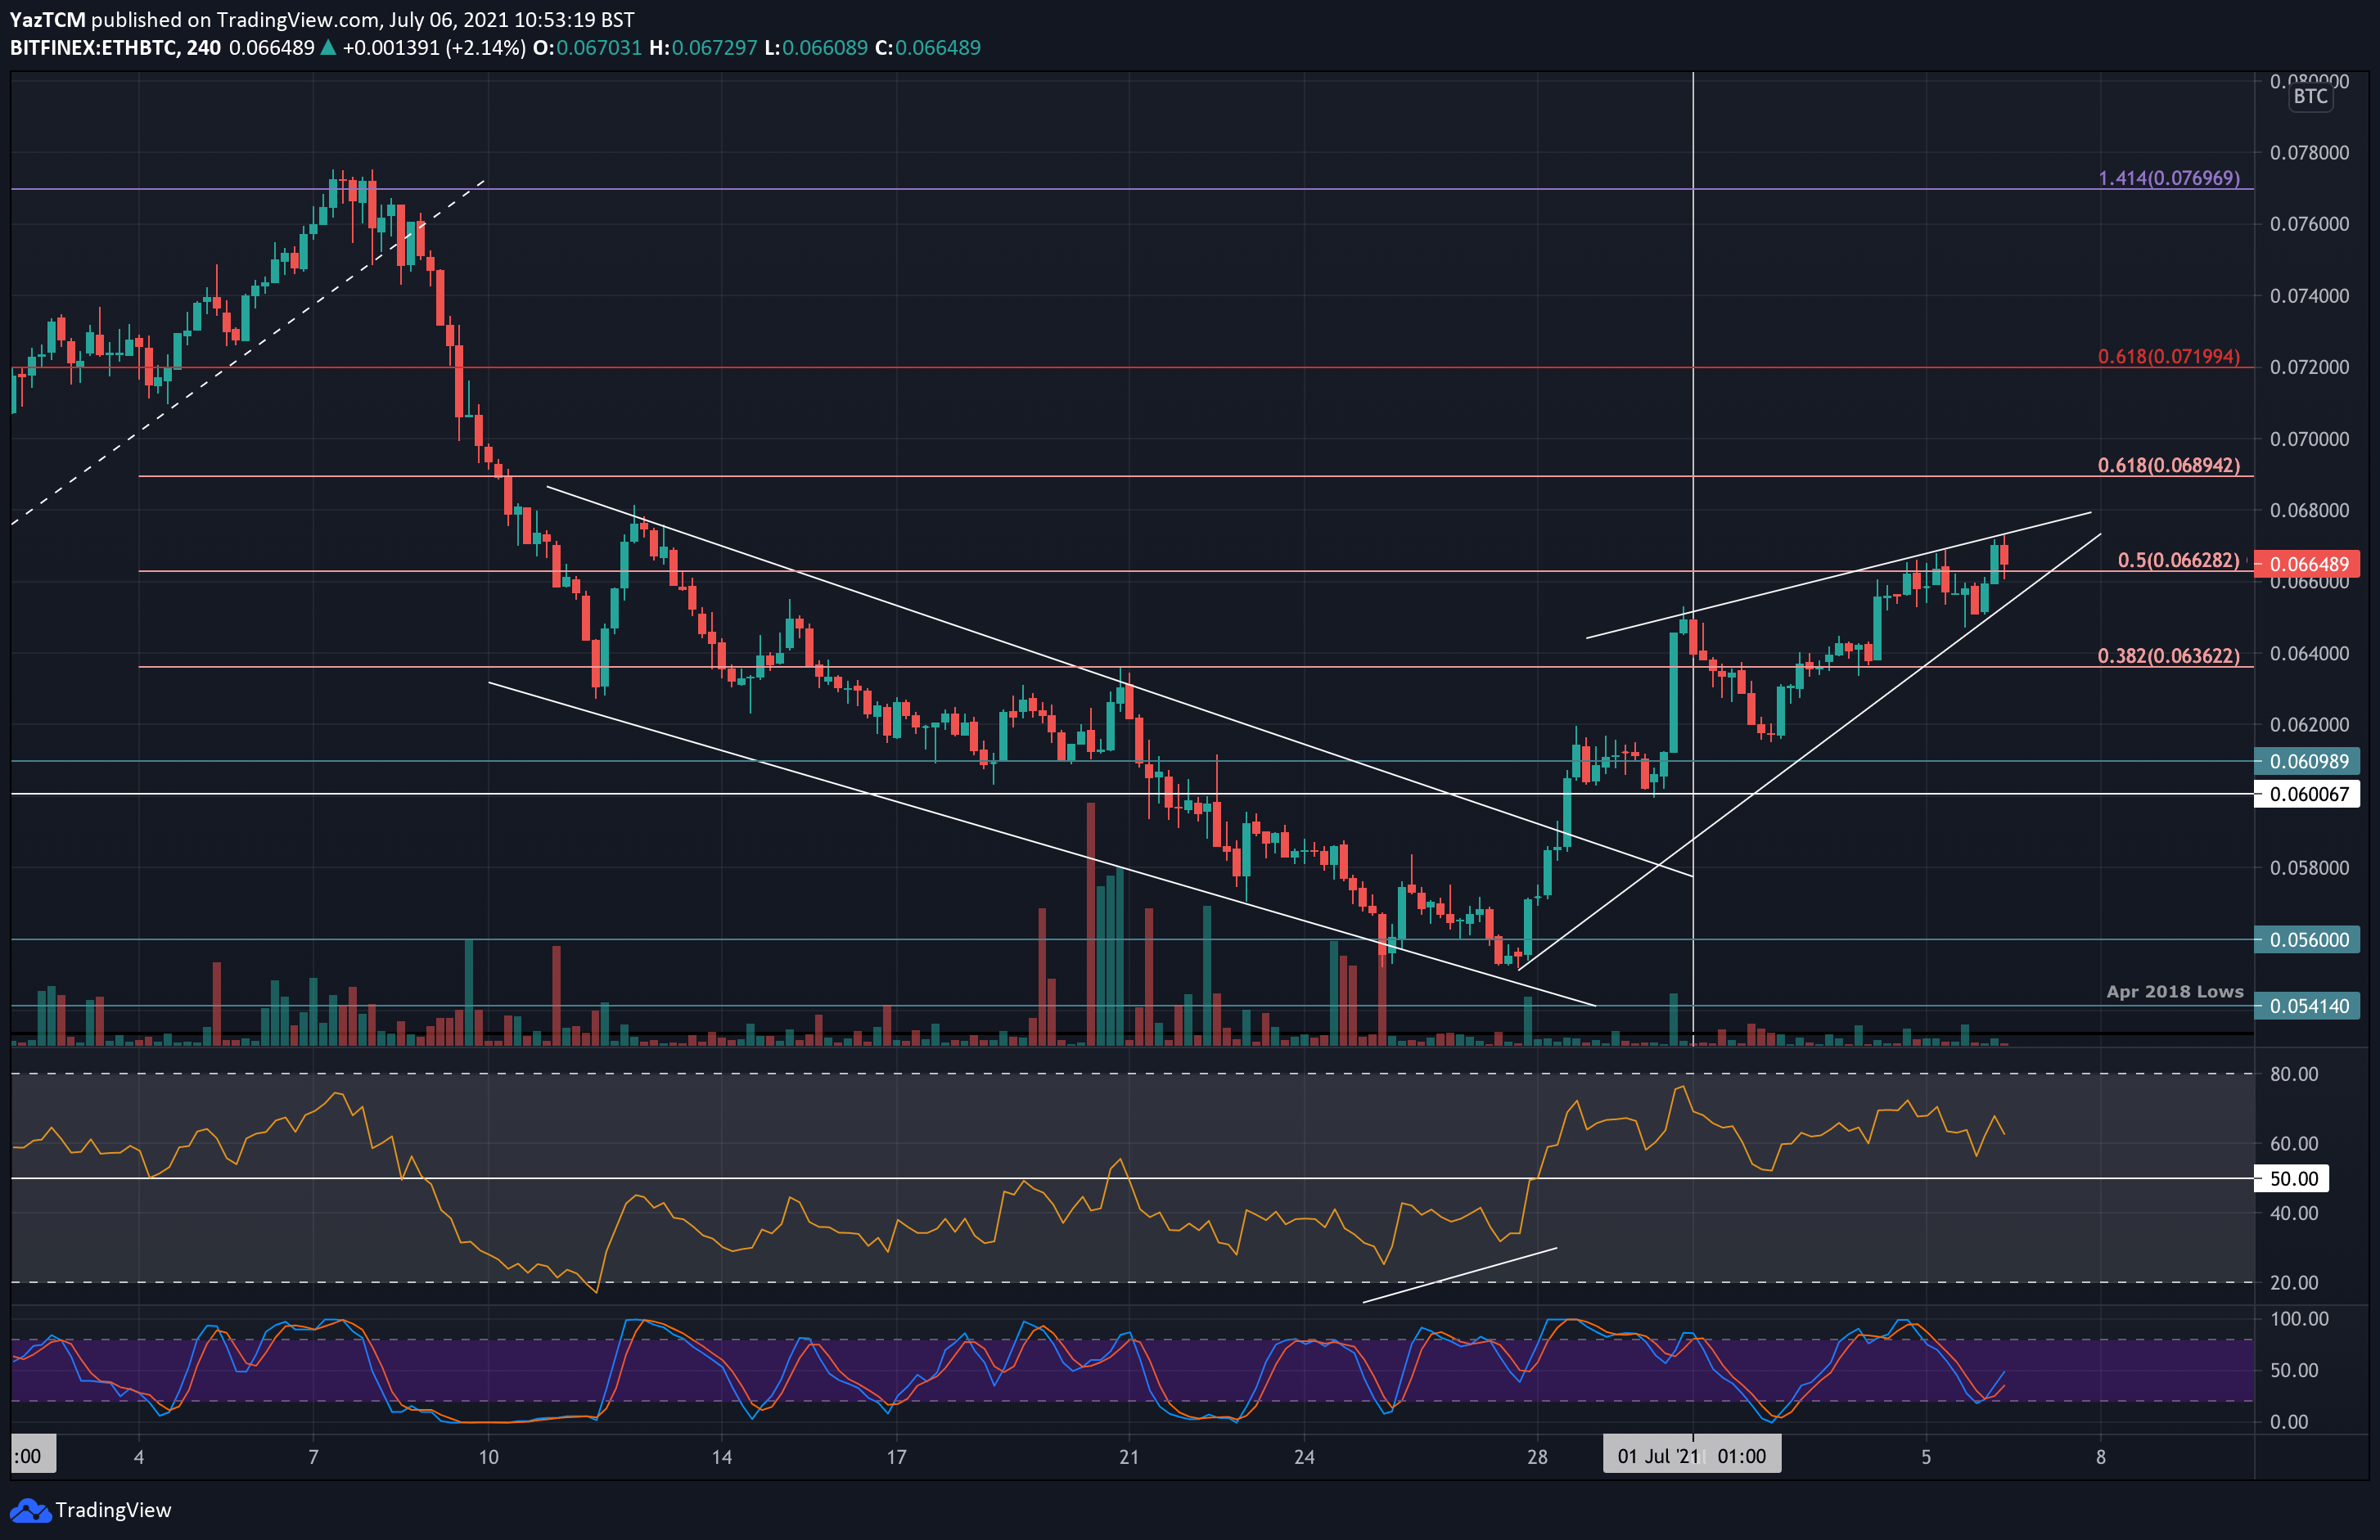
On the short-term chart, ETH is also forming the same rising wedge pattern against BTC. This is a potentially bearish signal that could see it heading back to 0.06 BTC if it breaks.
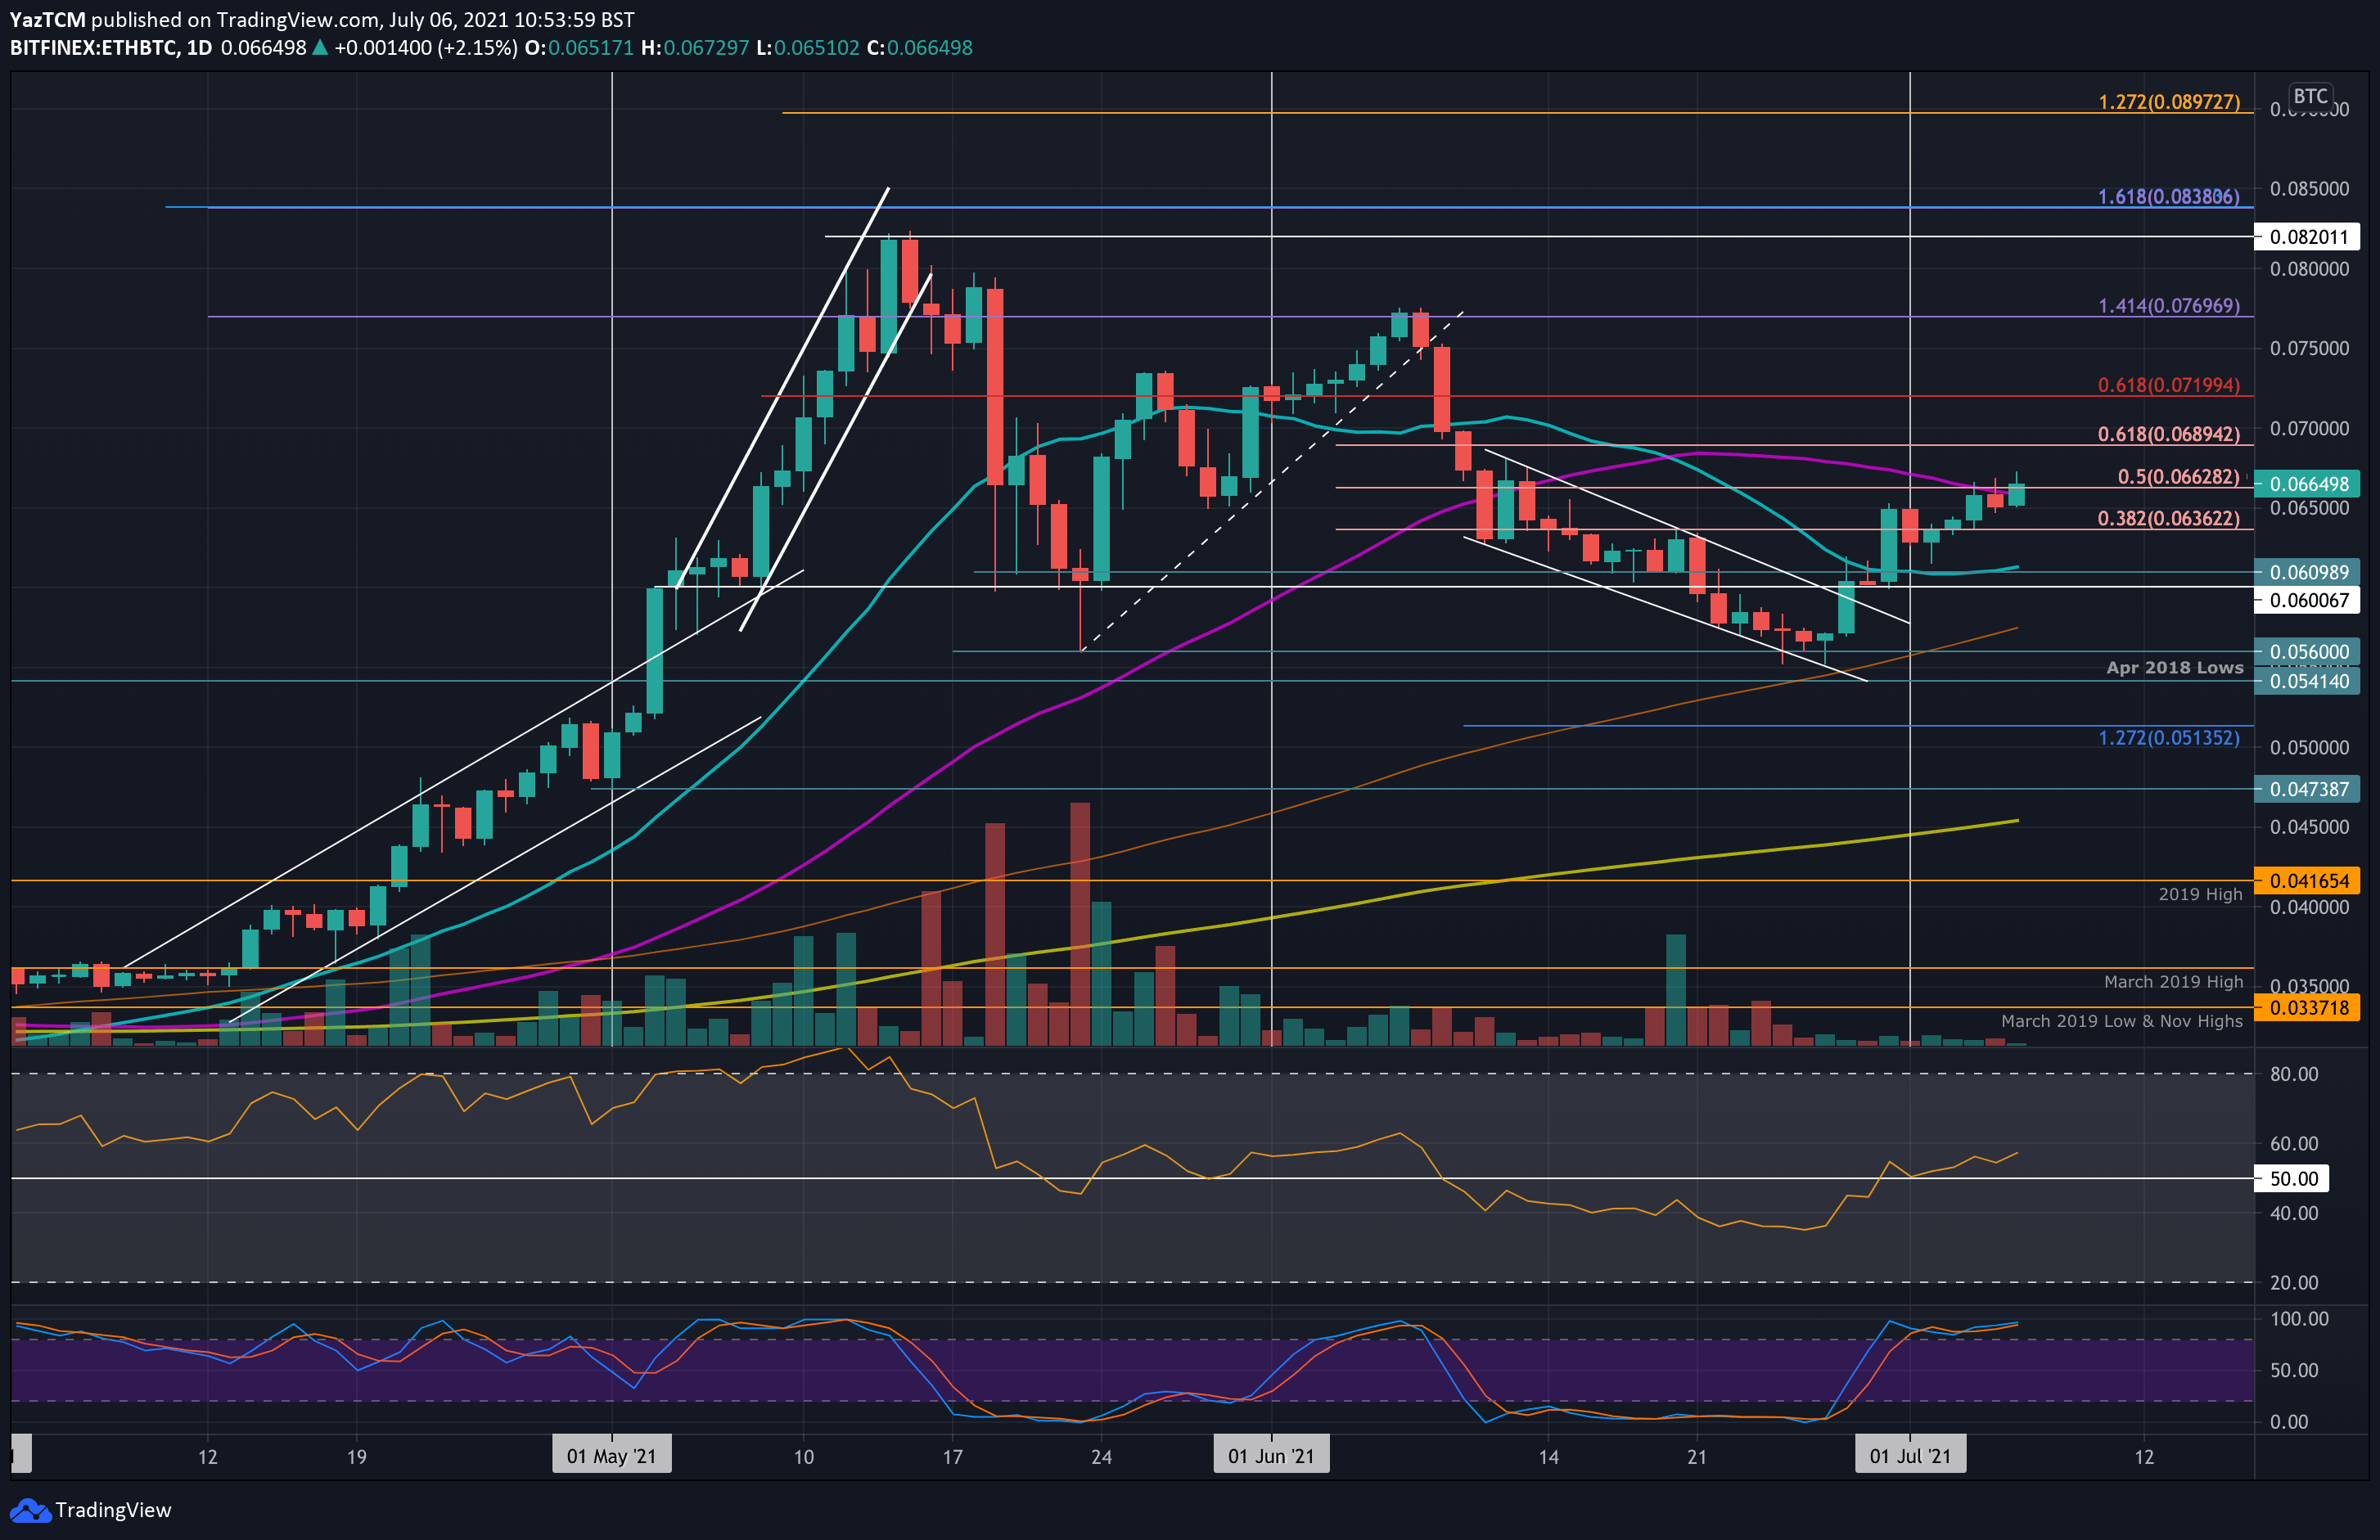
ETH-BTC Short Term Price Prediction
Moving forward, if the bulls can break above the wedge, the first resistance lies at 0.068 BTC. This is followed by 0.0689 BTC (bearish .618 Fib), 0.07 BTC, and 0.072 BTC.
On the other side, the first support lies at 0.066 BTC (lower angle of wedge & 50-day MA). This is followed by 0.063 BTC and 0.061 BTC (20-day MA).
The daily RSI is showing slightly bullish momentum as it sits above the midline. However, the 4-hour RSI shows a clear bearish divergence between momentum and price that could see the market breaking the lower angle of the wedge.