ETH/USD – Ethereum Bounces From .236 Fib SupportKey Support Levels: 00, 00, 80.Key Resistance Levels: 92, 25, 75.Ethereum had set a new ATH price at 73 on Monday. It could not close a daily candle above the 92 resistance and ended up rolling over the past few days.It continued to drop until support was found yesterday at 00 (.236 Fib), which allowed the coin to rebound. It pushed higher today and is now testing resistance at 50 (1.272 Fib Extension).ETH/USD Daily Chart. Source: TradingView.ETH-USD Short Term Price PredictionLooking ahead, the first level of strong resistance lies at 92 (1.618 Fib Extension & 2021 High-day Closing price). This is followed by 25 (previous ATH0, 72 (new ATH), and 00.Beyond 00, resistance is found at 30 (1.414
Topics:
Yaz Sheikh considers the following as important: ETH Analysis, ETHBTC, Ethereum (ETH) Price, ethusd
This could be interesting, too:
CryptoVizArt writes Will Weak Momentum Drive ETH to .5K? (Ethereum Price Analysis)
Jordan Lyanchev writes Bybit Hack Fallout: Arthur Hayes, Samson Mow Push for Ethereum Rollback
Mandy Williams writes Ethereum Key Metrics Point to Persistent Bullish Outlook for ETH: CryptoQuant
CryptoVizArt writes Ethereum Price Analysis: Following a 15% Weekly Crash, What’s Next for ETH?
ETH/USD – Ethereum Bounces From .236 Fib Support
Key Support Levels: $1300, $1200, $1080.
Key Resistance Levels: $1392, $1425, $1475.
Ethereum had set a new ATH price at $1473 on Monday. It could not close a daily candle above the $1392 resistance and ended up rolling over the past few days.
It continued to drop until support was found yesterday at $1200 (.236 Fib), which allowed the coin to rebound. It pushed higher today and is now testing resistance at $1350 (1.272 Fib Extension).
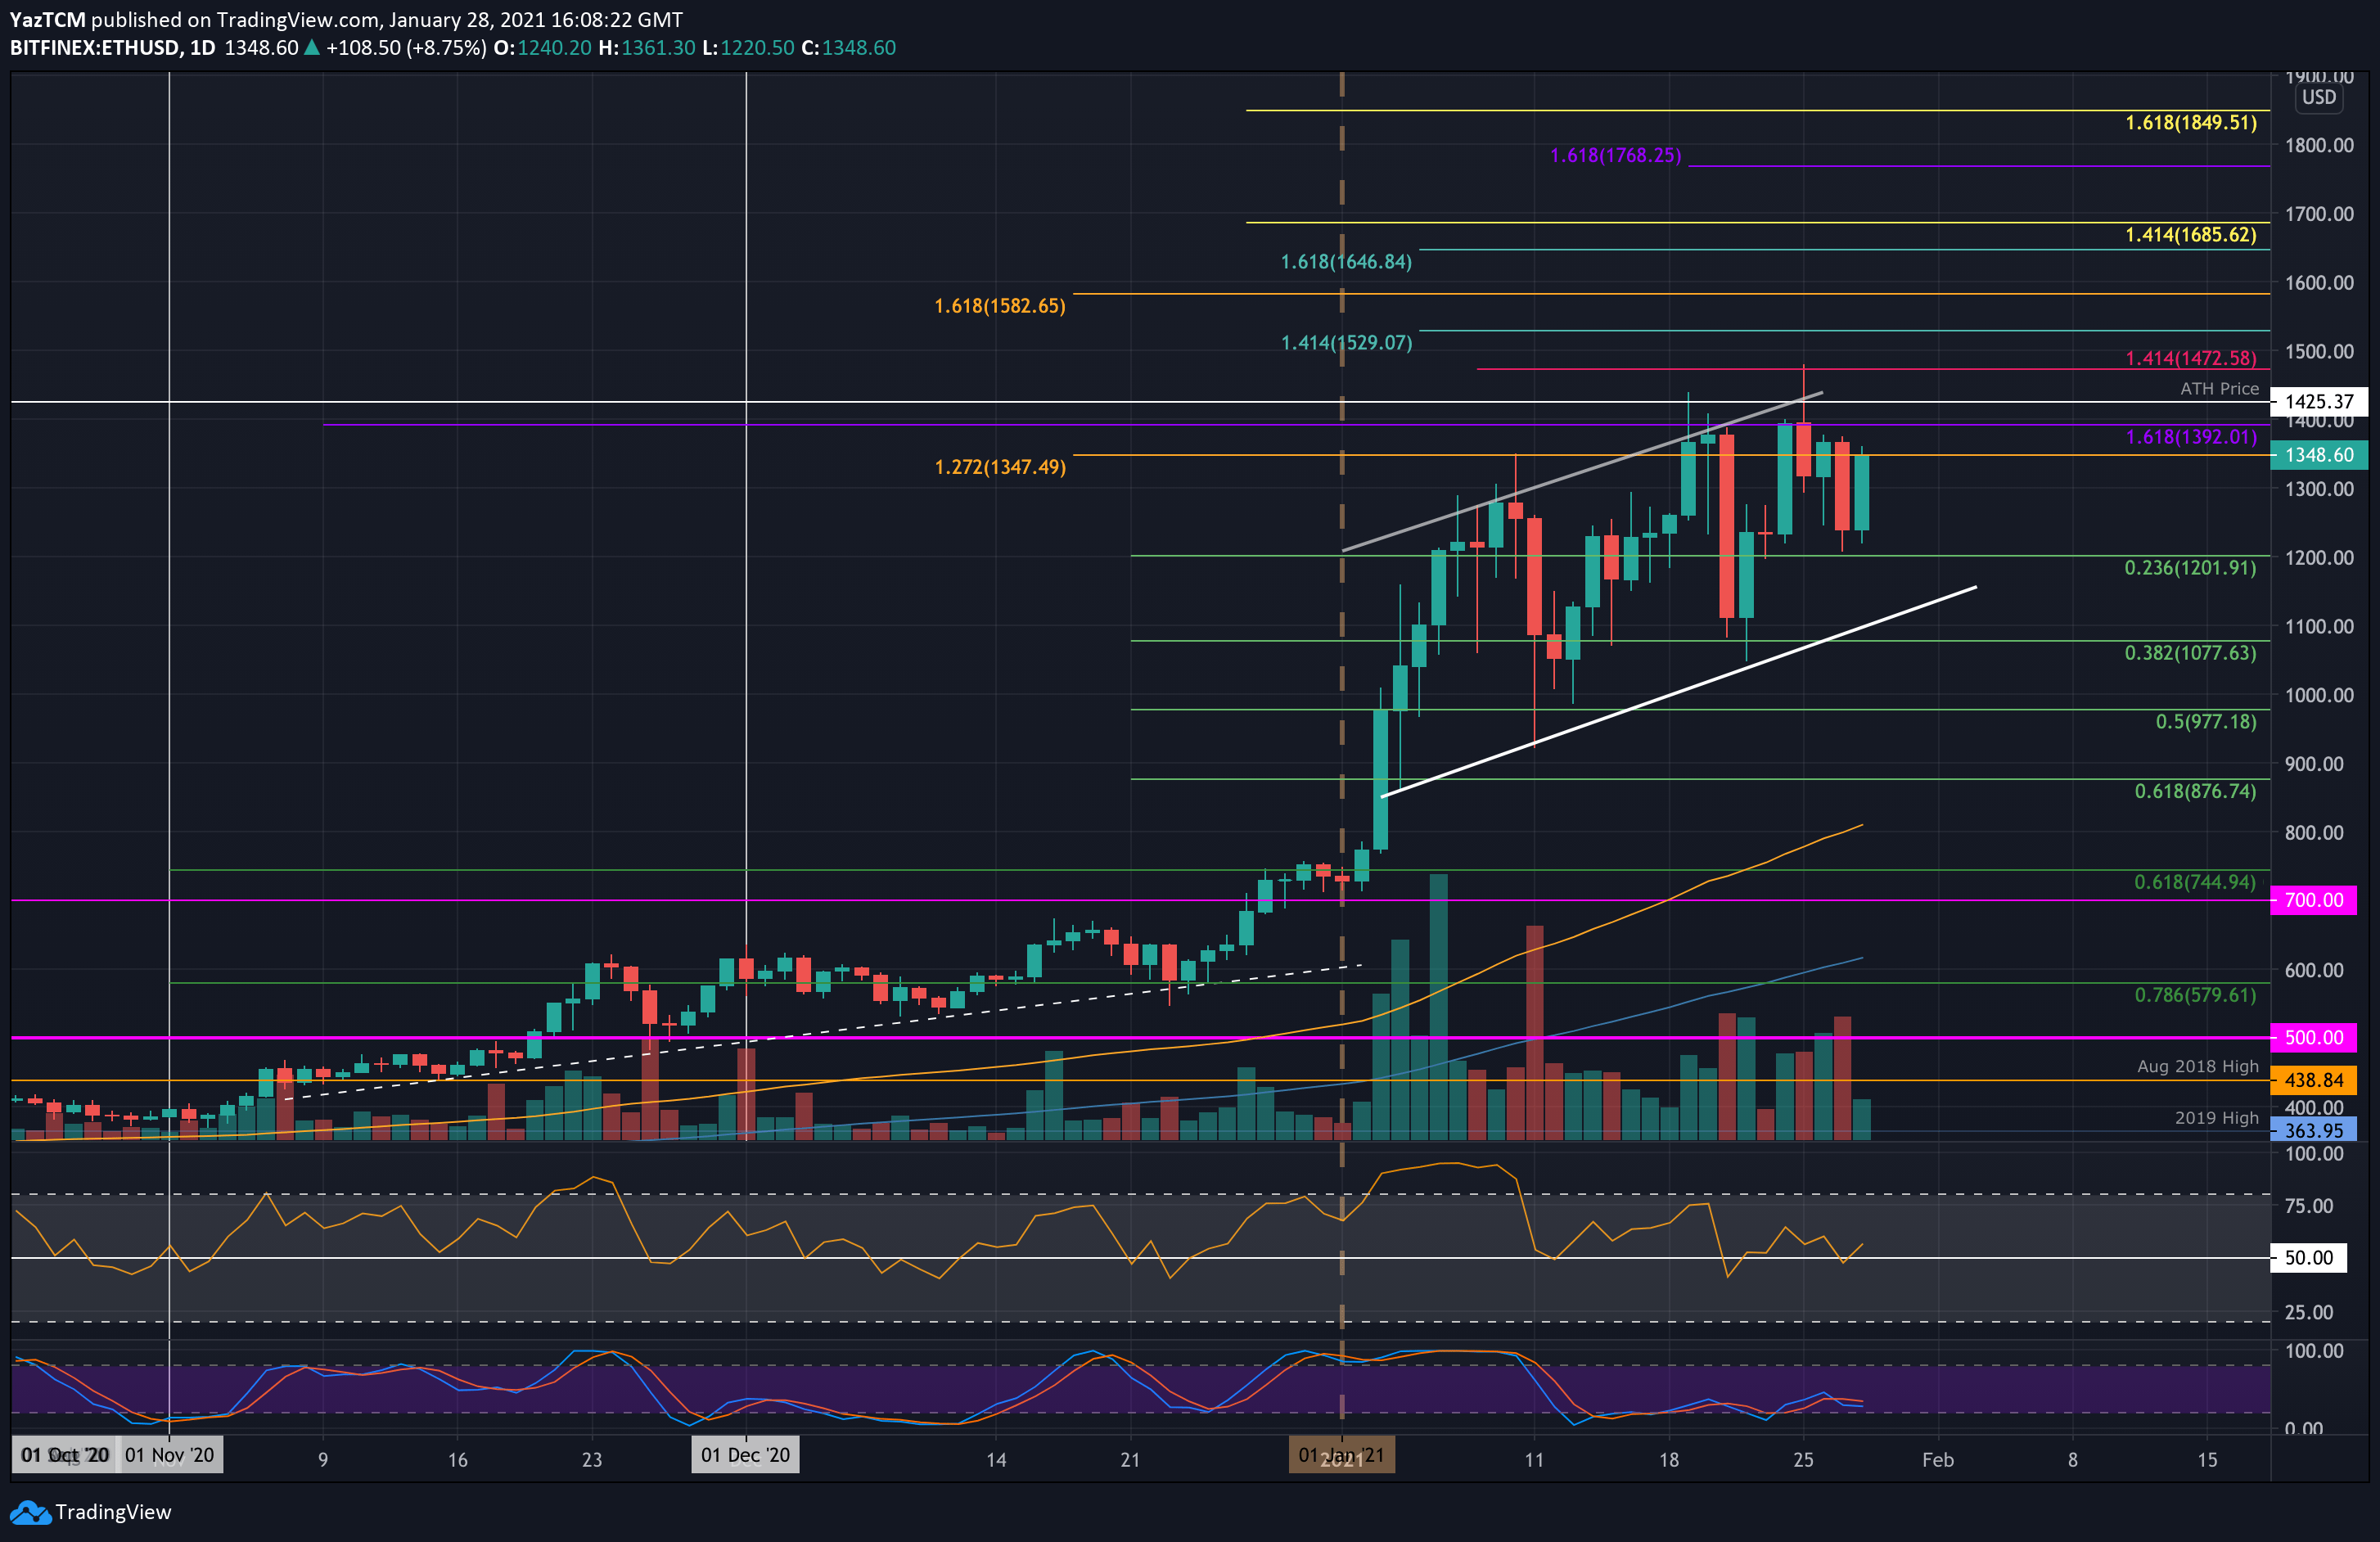
ETH-USD Short Term Price Prediction
Looking ahead, the first level of strong resistance lies at $1392 (1.618 Fib Extension & 2021 High-day Closing price). This is followed by $1425 (previous ATH0, $1472 (new ATH), and $1500.
Beyond $1500, resistance is found at $1530 (1.414 Fib Extension – blue), $1582 (1.618 Fib Extension – orange), and $1645 (1.618 Fib Extension – blue).
On the other side, the first level of support lies at $1300. This is followed by $1200 (.236 Fib), the lower boundary of the price channel ($1150), $1080 (.382 Fib), and $1000.
The daily RSI recently rebounded from the midline, indicating the bulls are still in charge of the momentum, which is increasing.
ETH/BTC – Bulls Bounce From 2020 Highs
Key Support Levels: 0.0416 BTC, 0.0405 BTC, 0.0396 BTC.
Key Resistance Levels: 0.0428 BTC, 0.0435 BTC, 0.045 BTC.
Against Bitcoin, Ethereum has been trapped within a steep ascending price channel since the start of January 2021. The coin hit the 2021 high at 0.045 BTC on Monday and started to head lower from there.
It found support at 0.0405 BTC over the past few days and recently bounced from the lower boundary of the price channel today to hit the current 0.0421 BTC level.
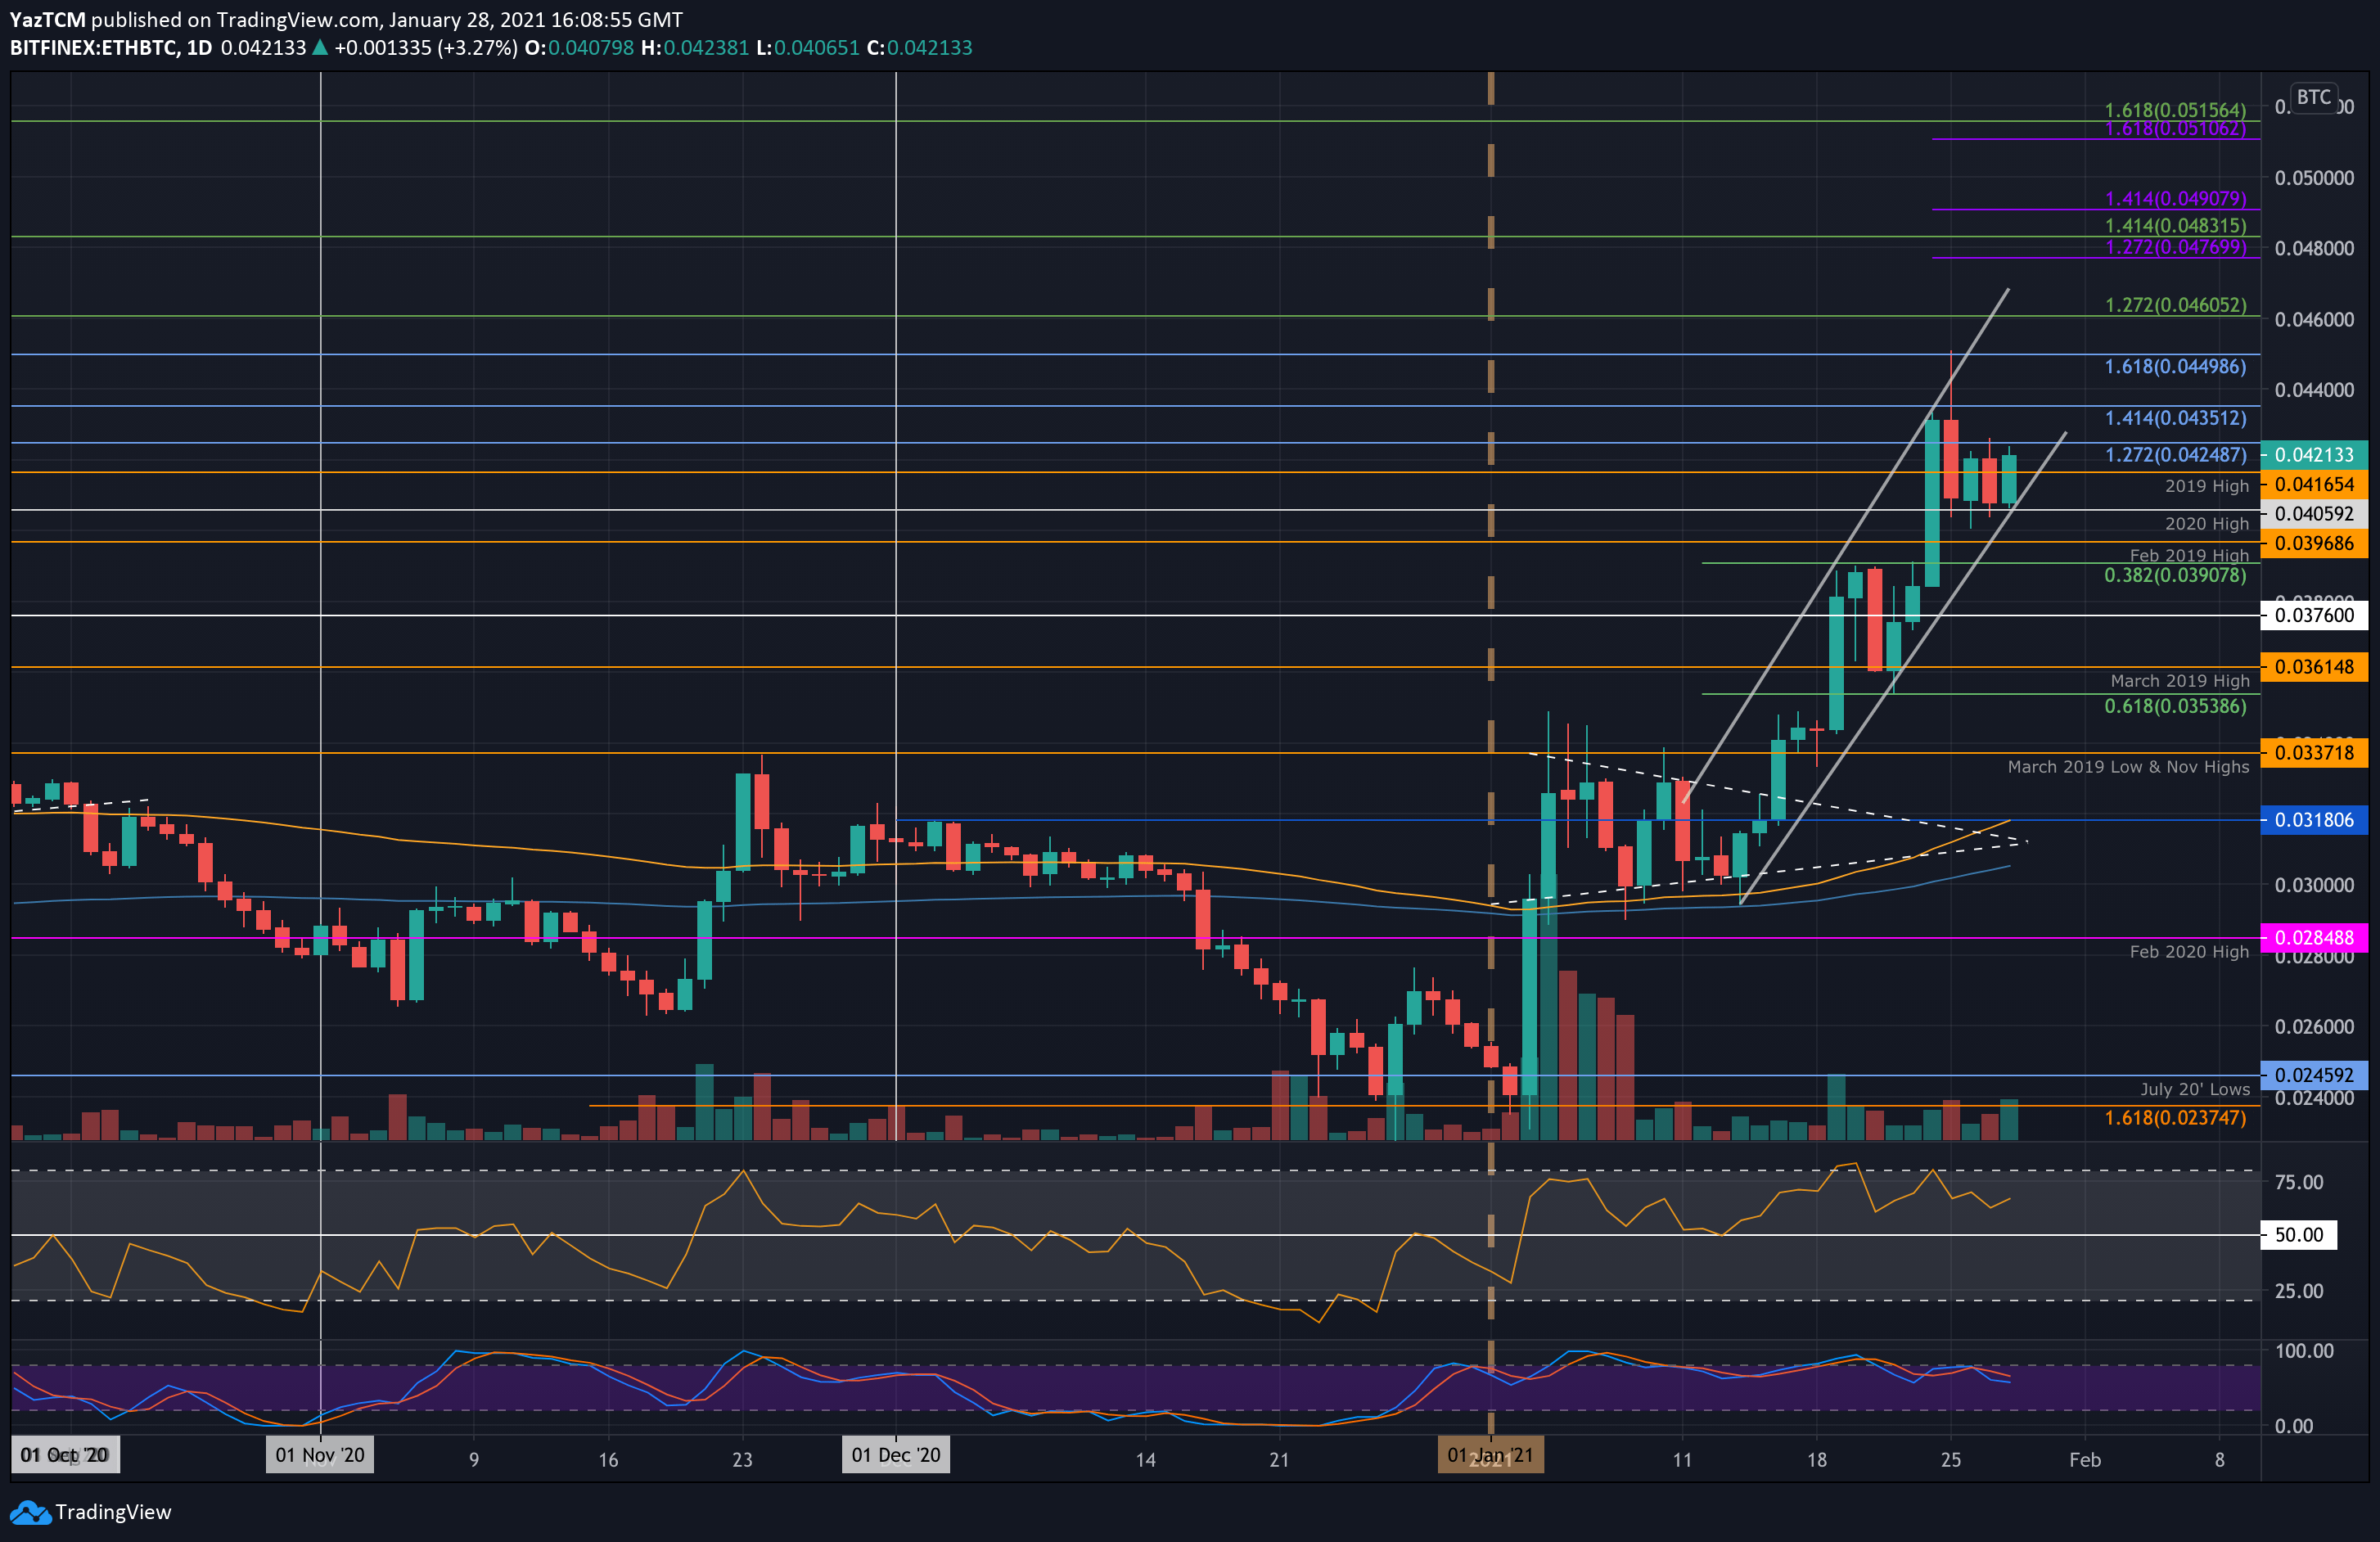
ETH-BTC Short Term Price Prediction
Looking ahead, the first level of resistance lies at 0.0428 BTC (1.272 Fib Extension). This is followed by 0.0435 BTC (1.414 Fib Exnteison) and 0.045 BTC (1.618 Fib Extension). Added resistance is found at 0.046 BTC and 0.0483 BTC.
On the other side, the first level of support lies at 0.0416 BTC (2019 High). This is followed by the rising price channel, 0.0405 BTC (2020 High), and 0.0396 BTC (Feb 2019 High). Added support lies at 0.039 BTC (.382 Fib) and 0.0376 BTC.
The RSI is slowly fading from overbought conditions, indicating the previous bullish momentum is fading slightly. However, the bulls are still in charge, and this should help keep it above the price channel.