ETH/USD – Ether Reclaims 20-day MA After Finding 00 Support. Key Support Levels: 30, 50, 00.Key Resistance Levels: 90, 75, 00. Ethereum managed to establish support at 00 (.5 Fib) over the weekend. The level there was further bolstered by the 50-day MA, and it allowed ETH to start rebounding at the beginning of this week. Yesterday, the cryptocurrency surged higher from 00, allowing it to break resistance at the 20-day MA and reach 00. The move is important because it shows that buyers are attempting to recover from the market capitulation seen last week. ETH/USD Daily Chart. Source: TradingView.ETH-USD Short Term Price Prediction Looking ahead, the first resistance lies at 90 (bearish .786 Fib). This is followed by 75 (1.272 Fib
Topics:
Yaz Sheikh considers the following as important: ETH Analysis, ETHBTC, Ethereum (ETH) Price, ethusd
This could be interesting, too:
Mandy Williams writes Ethereum Derivatives Metrics Signal Modest Downside Tail Risk Ahead: Nansen
Jordan Lyanchev writes Weekly Bitcoin, Ethereum ETF Recap: Light at the End of the Tunnel for BTC
CryptoVizArt writes Will Weak Momentum Drive ETH to .5K? (Ethereum Price Analysis)
Jordan Lyanchev writes Bybit Hack Fallout: Arthur Hayes, Samson Mow Push for Ethereum Rollback
ETH/USD – Ether Reclaims 20-day MA After Finding $3200 Support.
Key Support Levels: $3530, $3350, $3200.
Key Resistance Levels: $3790, $3975, $4000.
Ethereum managed to establish support at $3200 (.5 Fib) over the weekend. The level there was further bolstered by the 50-day MA, and it allowed ETH to start rebounding at the beginning of this week.
Yesterday, the cryptocurrency surged higher from $3400, allowing it to break resistance at the 20-day MA and reach $3600. The move is important because it shows that buyers are attempting to recover from the market capitulation seen last week.
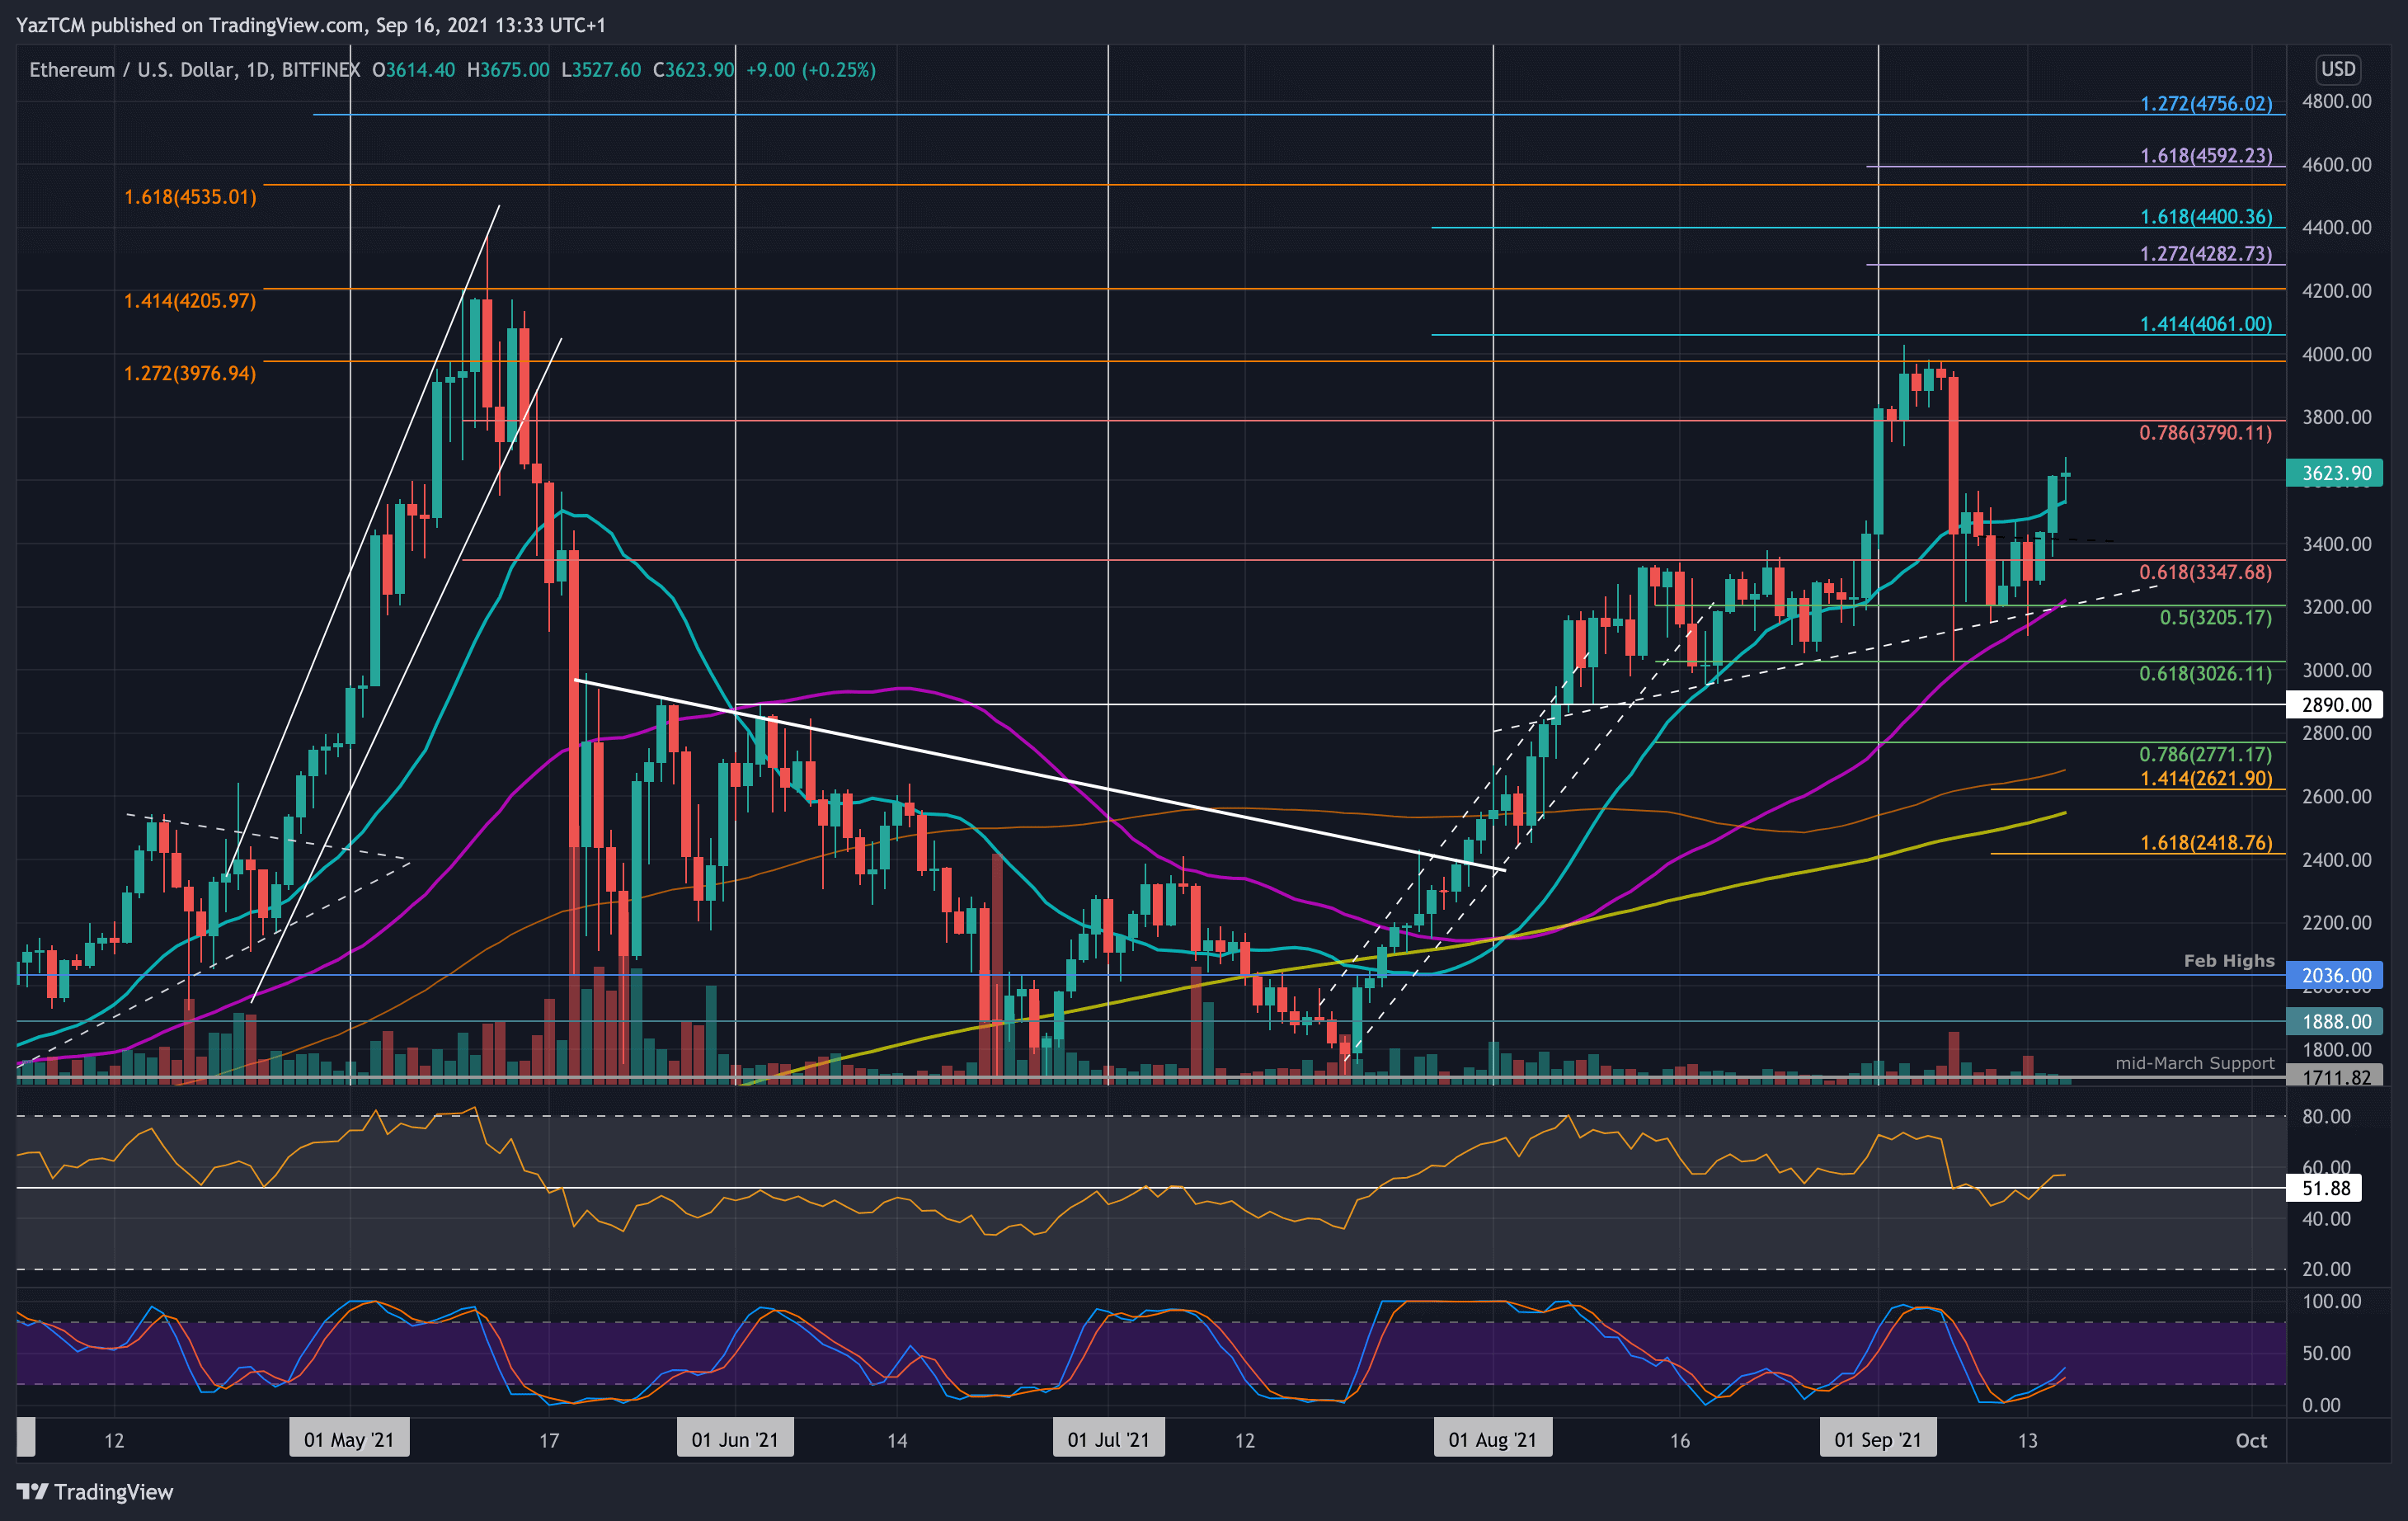
ETH-USD Short Term Price Prediction
Looking ahead, the first resistance lies at $3790 (bearish .786 Fib). This is followed by $3975 (1.272 Fib Extension), $4000, $4200 (1.414 Fib Extension), and $4280.
On the other side, the first support lies at $3530 (20-day MA). This is followed by $3350, $3200 (.5 Fib & 50-day MA), and $3000 (.618 Fib).
The daily RSI is back above the midline and is starting to rise. This shows that the buying momentum is steadily increasing.
ETH/BTC – Buyers Rebound From 0.072 BTC.
Key Support Levels: 0.074 BTC, 0.0711 BTC, 0.07 BTC.
Key Resistance Levels: 0.0765 BTC, 0.0787 BTC, 0.08 BTC.
ETH is also attempting to recover against BTC as it reclaimed the 20-day MA yesterday. The cryptocurrency fell from 0.0787 BTC at the start of September and continued to drop until support was found at 0.0711 BTC (.382 Fib) last week.
Since then, ETH managed to hold above 0.072 BTC and rebounded from there yesterday to break the August high again at 0.0733 BTC and reach as high as 0.076 BTC today.
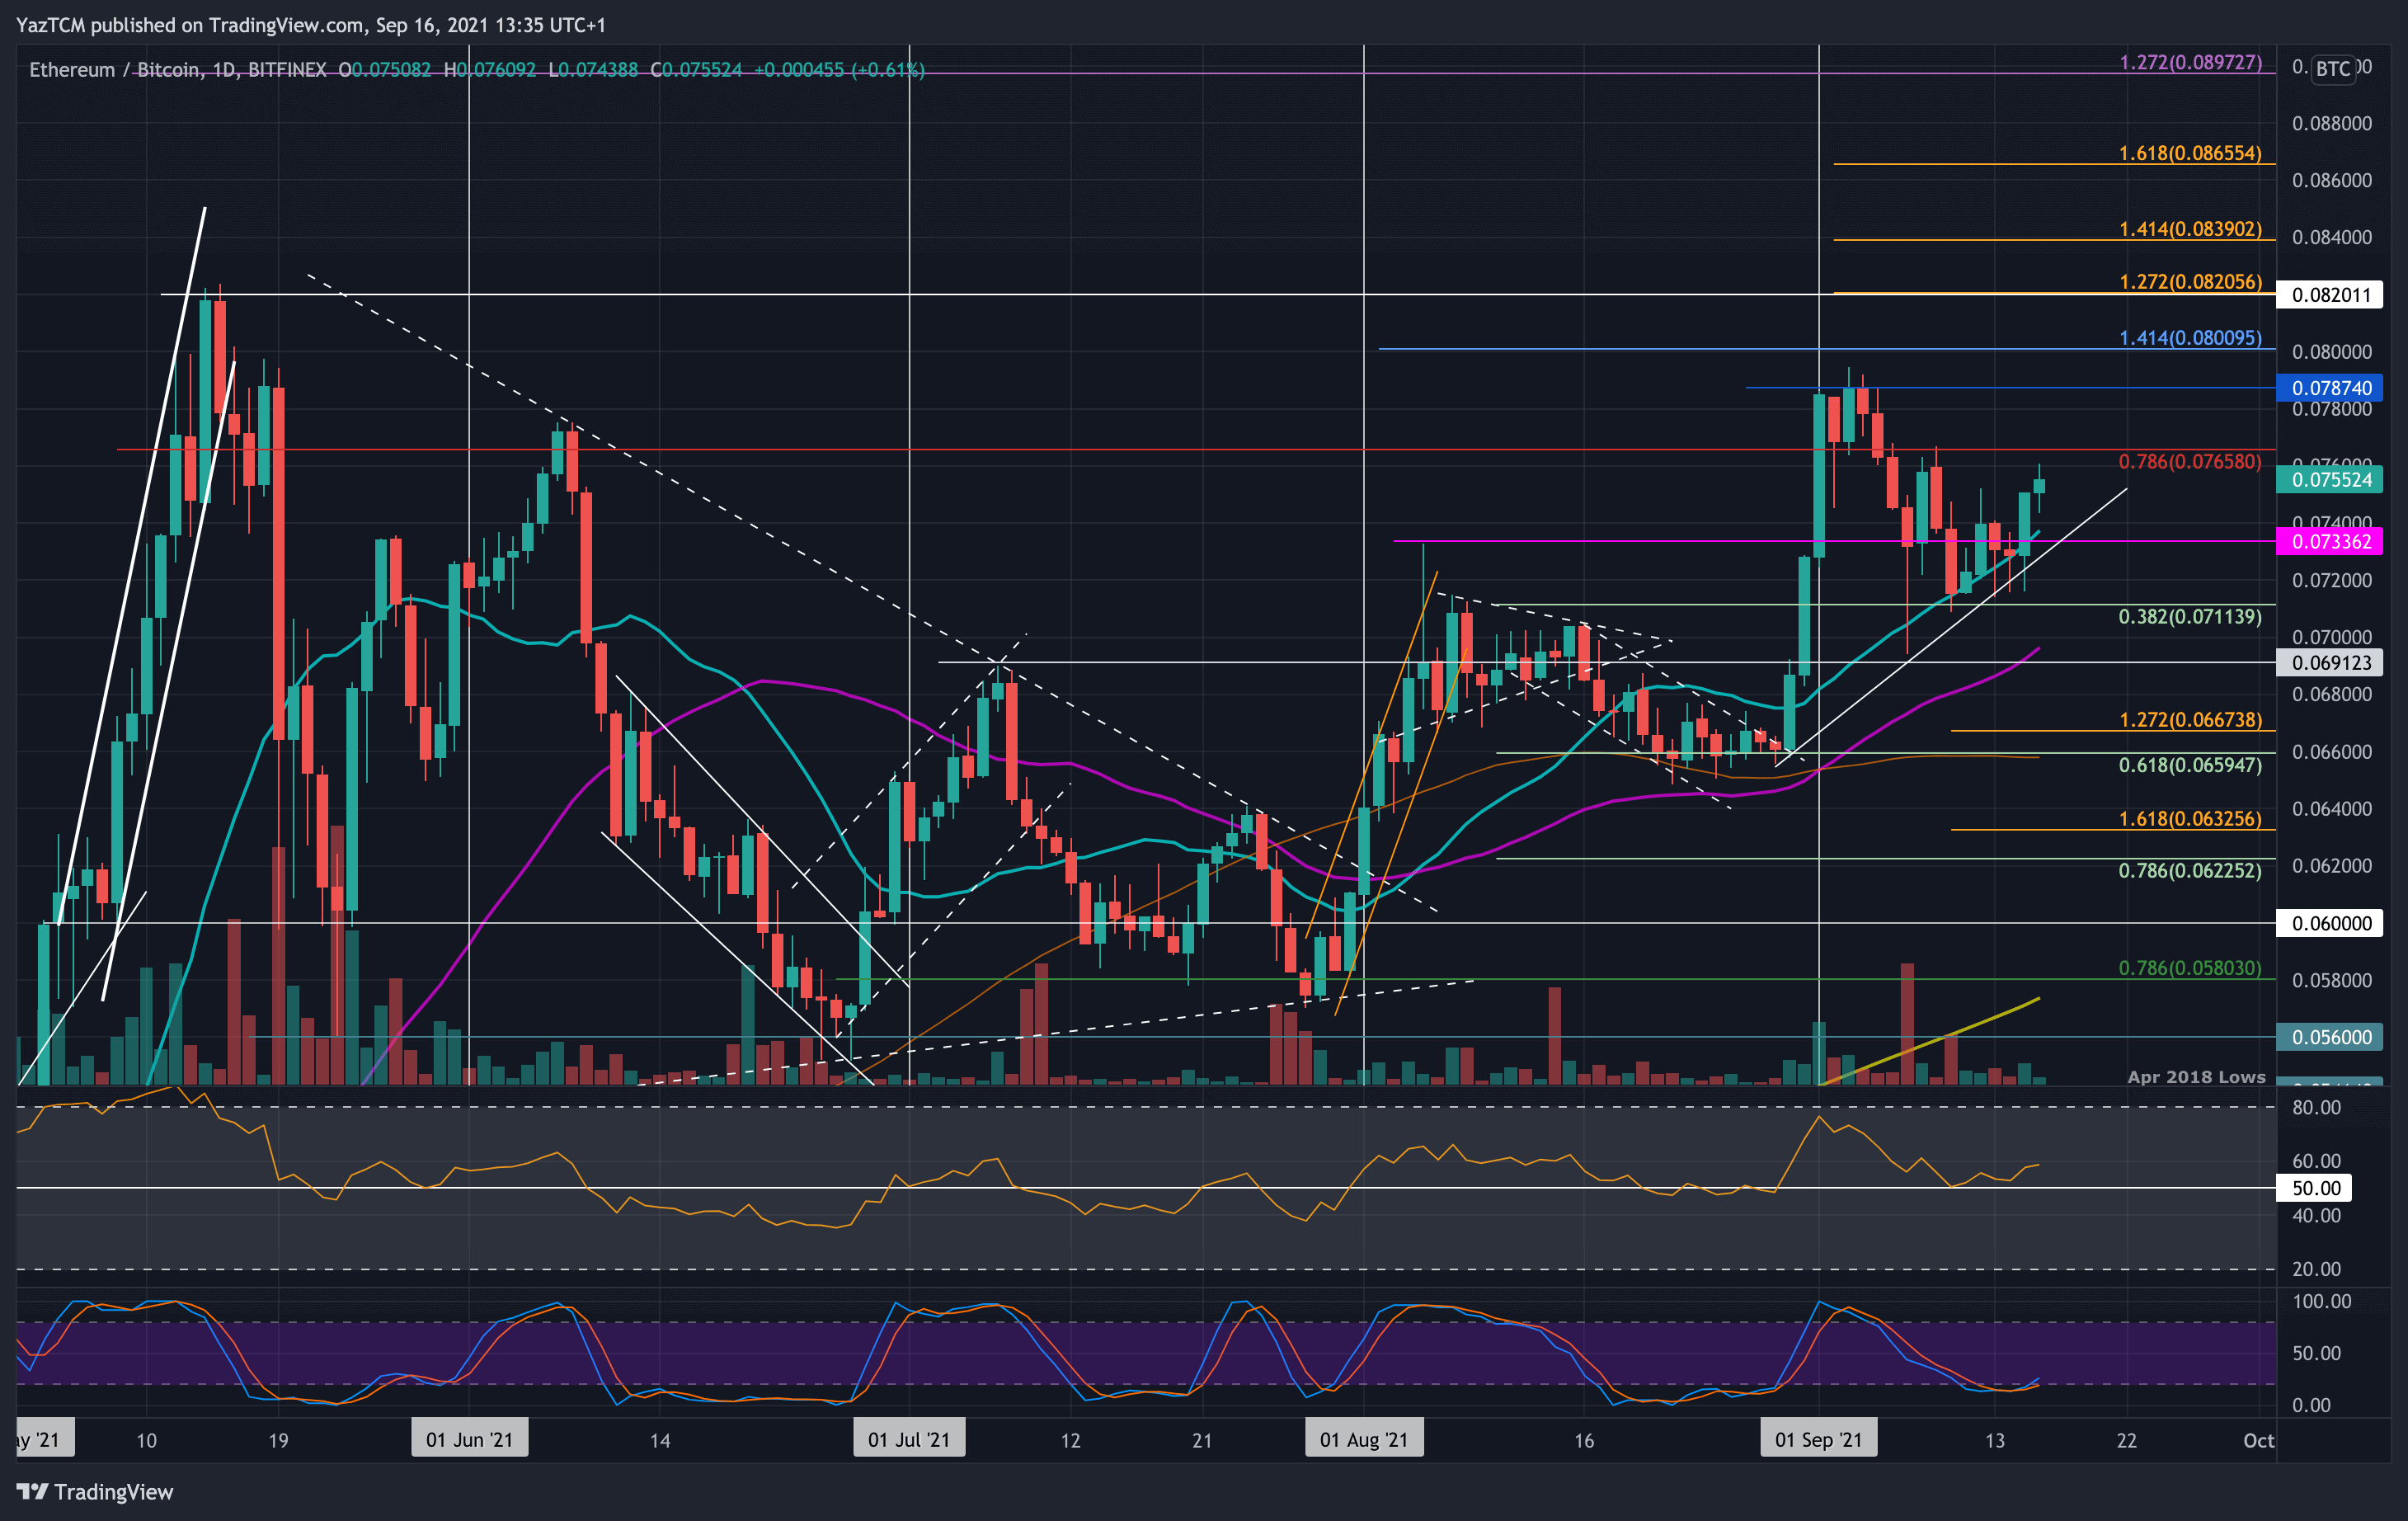
ETH-BTC Short Term Price Prediction
Moving forward, the first resistance lies at 0.0765 BTC (bearish .786 Fib). This is followed by 0.0787 BTC, 0.08 BTC, 0.082 BTC (1.272 Fib Extension), and 0.0839 BTC (1.414 Fib Extension).
On the other side, the first support lies at 0.074 BTC (20-day MA). This is followed by 0.0711 BTC (.382 Fib), 0.07 BTC (50-day MA), and 0.068 BTC.
The RSI has remained above the midline here as the buyers retain control of the market momentum. The recent spike higher indicates the bullish momentum is also rising.