ETH/USD – Ether Finally Breaks August Resistance Key Support Levels: 50, 00, 00.Key Resistance Levels: 40, 00, 00. Ethereum has been trapped inside a consolidation period since it established resistance at 50 during mid-August. The cryptocurrency failed to overcome the resistance provided by a bearish .618 Fib Retracement and ended up forming a symmetrical triangle from there. ETH had been trading inside this triangle pattern for the past fortnight as it dipped as low as 00. It finally managed to break the consolidation today as it surged above the 50 August resistance and passed 00. ETH/USD Daily Chart. Source: TradingView.ETH-USD Short Term Price Prediction Looking ahead, the first resistance now lies at 40 (1.618 Fib Extension). This is
Topics:
Yaz Sheikh considers the following as important: ETH Analysis, ETHBTC, Ethereum (ETH) Price, ethusd
This could be interesting, too:
Mandy Williams writes Ethereum Derivatives Metrics Signal Modest Downside Tail Risk Ahead: Nansen
Jordan Lyanchev writes Weekly Bitcoin, Ethereum ETF Recap: Light at the End of the Tunnel for BTC
CryptoVizArt writes Will Weak Momentum Drive ETH to .5K? (Ethereum Price Analysis)
Jordan Lyanchev writes Bybit Hack Fallout: Arthur Hayes, Samson Mow Push for Ethereum Rollback
ETH/USD – Ether Finally Breaks August Resistance
Key Support Levels: $3350, $3200, $3000.
Key Resistance Levels: $3540, $3600, $3700.
Ethereum has been trapped inside a consolidation period since it established resistance at $3350 during mid-August. The cryptocurrency failed to overcome the resistance provided by a bearish .618 Fib Retracement and ended up forming a symmetrical triangle from there.
ETH had been trading inside this triangle pattern for the past fortnight as it dipped as low as $3000. It finally managed to break the consolidation today as it surged above the $3350 August resistance and passed $3400.
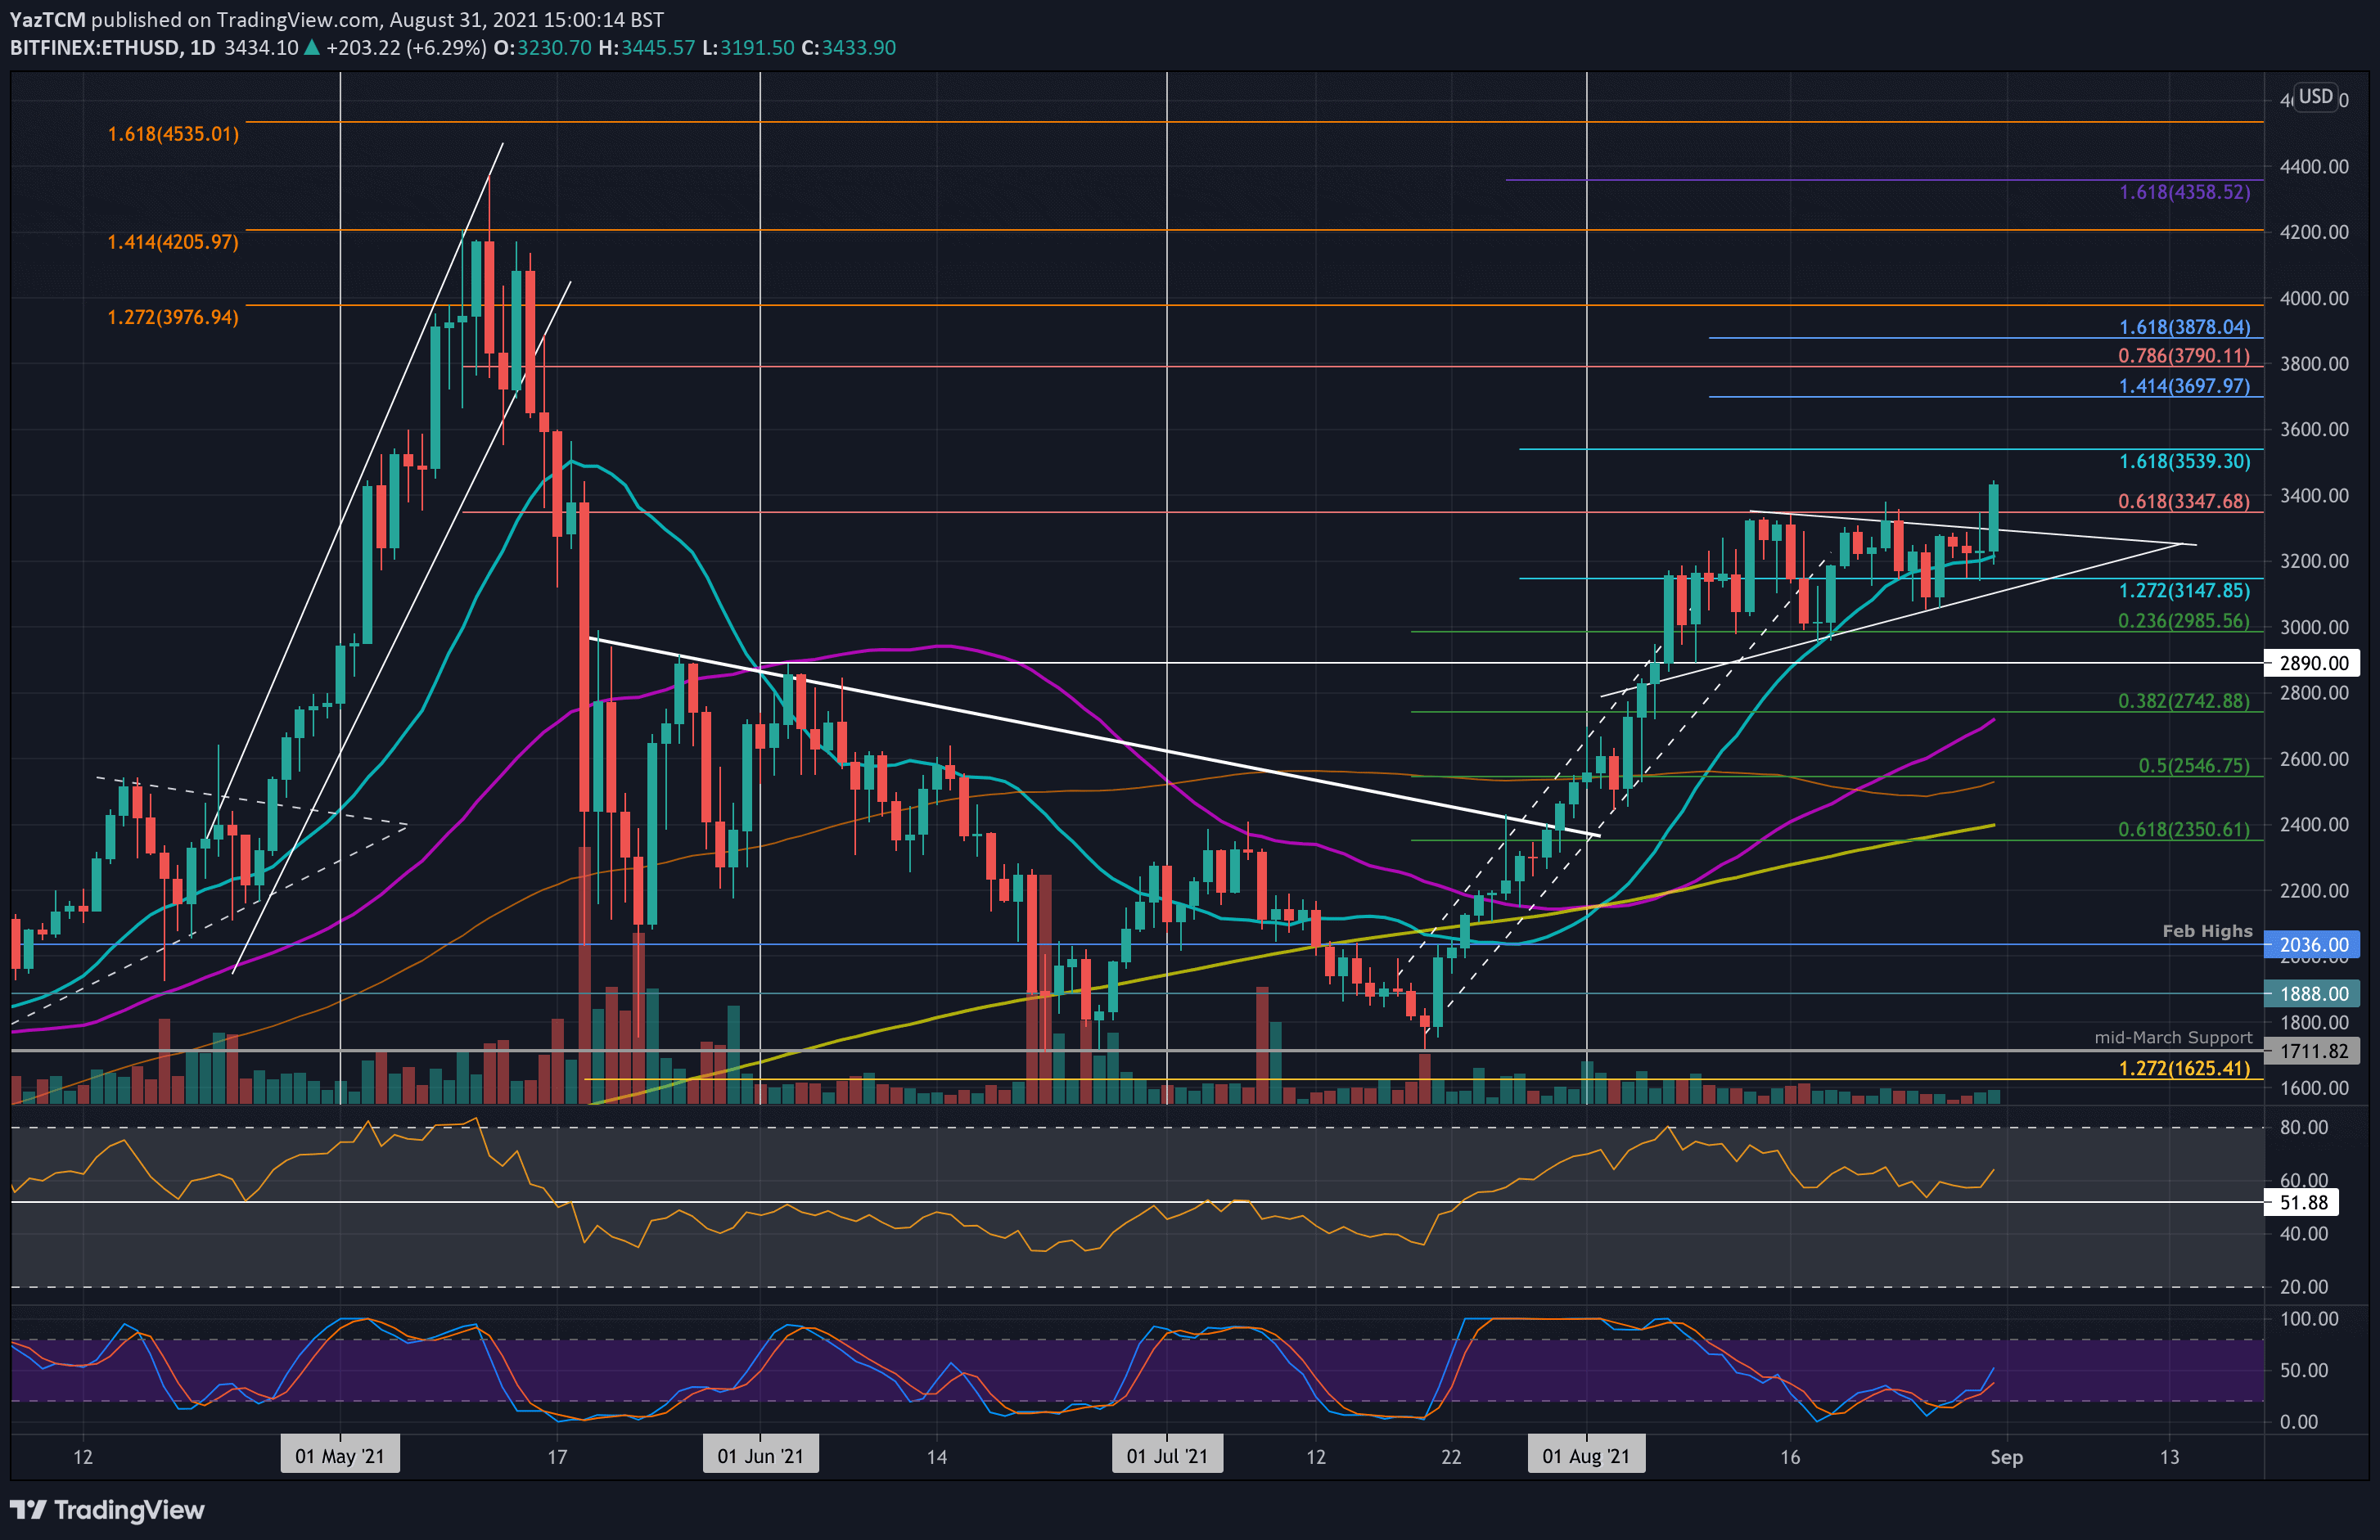
ETH-USD Short Term Price Prediction
Looking ahead, the first resistance now lies at $3540 (1.618 Fib Extension). This is followed by $3600, $3700 (1.414 Fib Extension – blue), and $3790 (bearish .786 Fib).
On the other side, the first support lies at $3350. This is followed by $3200 (20-day MA), $3000 (.236 Fib Retracement), $2890, and $2740 (50-day MA).
The RSI rebounded from the midline last week and is now heading higher again as the momentum starts to pick up.
ETH/BTC – ETH Breaks Descending Price Channel
Key Support Levels: 0.07 BTC, 0.0691 BTC, 0.068 BTC.
Key Resistance Levels: 0.072 BTC, 0.0733 BTC, 0.0754 BTC.
ETH is also performing well against BTC as it looks to head back toward the August highs of 0.0733 BTC. Since mid-August, ETH failed to break beyond 0.07 BTC and established a descending price channel.
The price channel saw ETH falling as low as 0.0651 BTC, where it found support at the 100-day MA and a .5 Fib. Yesterday, ETH finally broke above the falling price channel, ending the short-term downtrend. It continued further today to break 0.07 BTC and approached the 0.072 BTC (bearish .618 Fib) resistance.

ETH-BTC Short Term Price Prediction
Moving forward, the first resistance lies at 0.072 BTC (bearish .618 Fib). This is followed by 0.0733 BTC, 0.0754 BTC (1.272 Fib Extension), 0.0765 BTC (bearish .786 Fib), and 0.08 BTC.
On the other side, the first support now lies at 0.07 BTC. This is followed by 0.0691 BTC (July highs), 0.068 BTC (20-day MA), and 0.066 BTC.
Likewise, the RSI rebounded from the midline today, indicating the buyers remain in control of the market momentum and the bullish momentum is increasing again.