ETH/USD – Will the 20-day MA Hold? Key Support Levels: 50, 80, 00, 60. Key Resistance Levels: 90, 50, 00. Despite ETH is up by a solid 47% over the past month and 6% weekly (according to CoinGecko), it failed in breaching the critical resistance at 50. The latter resistance is provided by a bearish .618 Fib Retracement level, and it prevented the market from pushing higher in mid-August. After the previous failed attempt, ETH retraced into the 20-day MA (blue line on the following chart) support at 00 (last week) but quickly pushed higher toward the resistance for a second attempt. Yesterday, following a second failure, ETH rolled over from 50 and headed sharply lower, breaking down critical 20-day MA support at 50, and bottoming around
Topics:
Yaz Sheikh considers the following as important: ETH Analysis, ETHBTC, Ethereum (ETH) Price, ethusd
This could be interesting, too:
Mandy Williams writes Ethereum Derivatives Metrics Signal Modest Downside Tail Risk Ahead: Nansen
Jordan Lyanchev writes Weekly Bitcoin, Ethereum ETF Recap: Light at the End of the Tunnel for BTC
CryptoVizArt writes Will Weak Momentum Drive ETH to .5K? (Ethereum Price Analysis)
Jordan Lyanchev writes Bybit Hack Fallout: Arthur Hayes, Samson Mow Push for Ethereum Rollback
ETH/USD – Will the 20-day MA Hold?
Key Support Levels: $3150, $3080, $3000, $2960.
Key Resistance Levels: $3190, $3350, $3400.
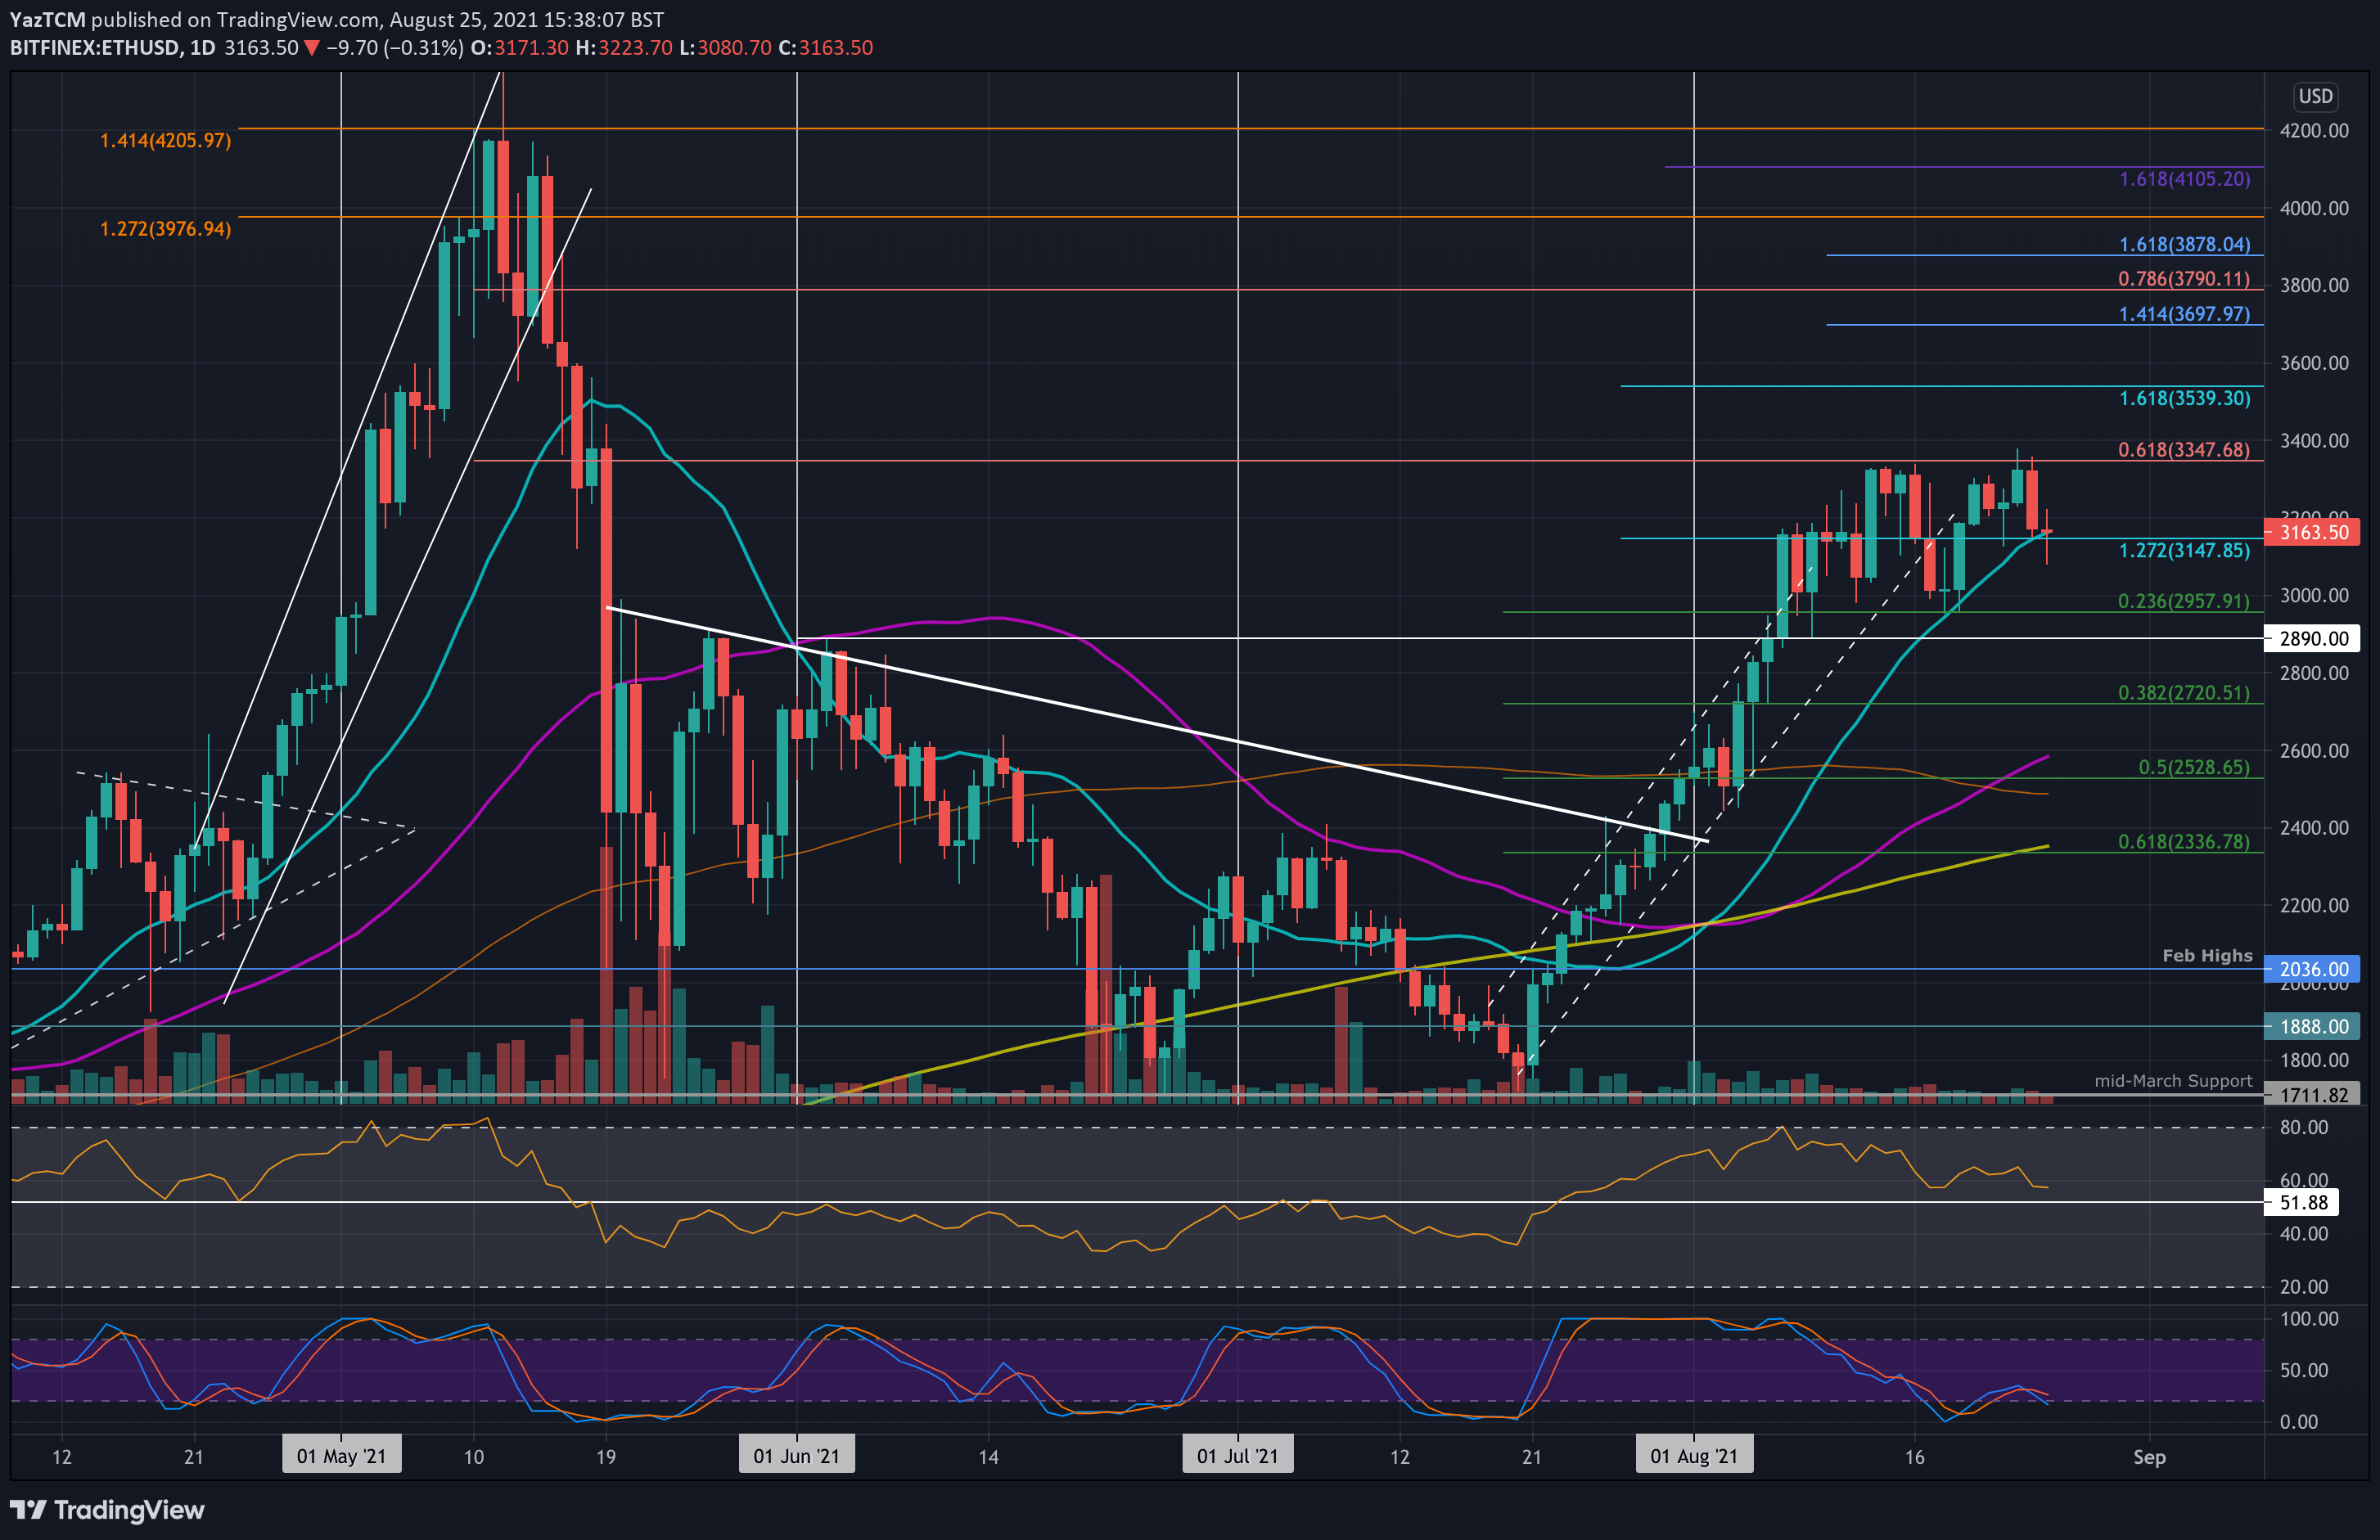
Despite ETH is up by a solid 47% over the past month and 6% weekly (according to CoinGecko), it failed in breaching the critical resistance at $3350. The latter resistance is provided by a bearish .618 Fib Retracement level, and it prevented the market from pushing higher in mid-August.
After the previous failed attempt, ETH retraced into the 20-day MA (blue line on the following chart) support at $3000 (last week) but quickly pushed higher toward the resistance for a second attempt.
Yesterday, following a second failure, ETH rolled over from $3350 and headed sharply lower, breaking down critical 20-day MA support at $3150, and bottoming around $3080. The latter is the lowest price of ETH over the past 6 days.
As of writing these lines, ETH wicked nicely (4-hour candle is not closed yet), and facing the 20-day MA now as resistance. It will be crucial for ETH to maintain the MA-20 level by closing the daily candle above it.
ETH-USD Short Term Price Prediction
Looking ahead, the first supply/support level toward the downside lies at current levels of $3150 (where lies the 20-day MA). This is closely followed by support at $3080 (today’s low), $3000, $2960 (.236 Fib), $2890 (June highs), $2720 (.382 Fib), and $2600 (50-day MA).
On the other side, the first resistance lies at $3190 (short-term 0.382 fib retracement level and local high from the first week of August). This is followed by $3350 (bearish .618 Fib and August highest), $3400, and $3540 (1.618 Fib Extension).
The RSI continues to make lower lows as it heads toward the midline, indicating the previous bullish momentum continues to dwindle. If it falls beneath the midline, the bears will take control of the momentum and could push ETH beneath $3000.
On top of that, there is a clear sign of bearish divergence on the daily and 4-hour chart, this might indicate that the bears are not done yet.
ETH/BTC – The Battle on the MA-100
Key Support Levels: 0.0645 – 0.065 BTC, 0.0632 BTC, 0.062 BTC.
Key Resistance Levels: 0.067 BTC, 0.068 BTC, 0.07 BTC.
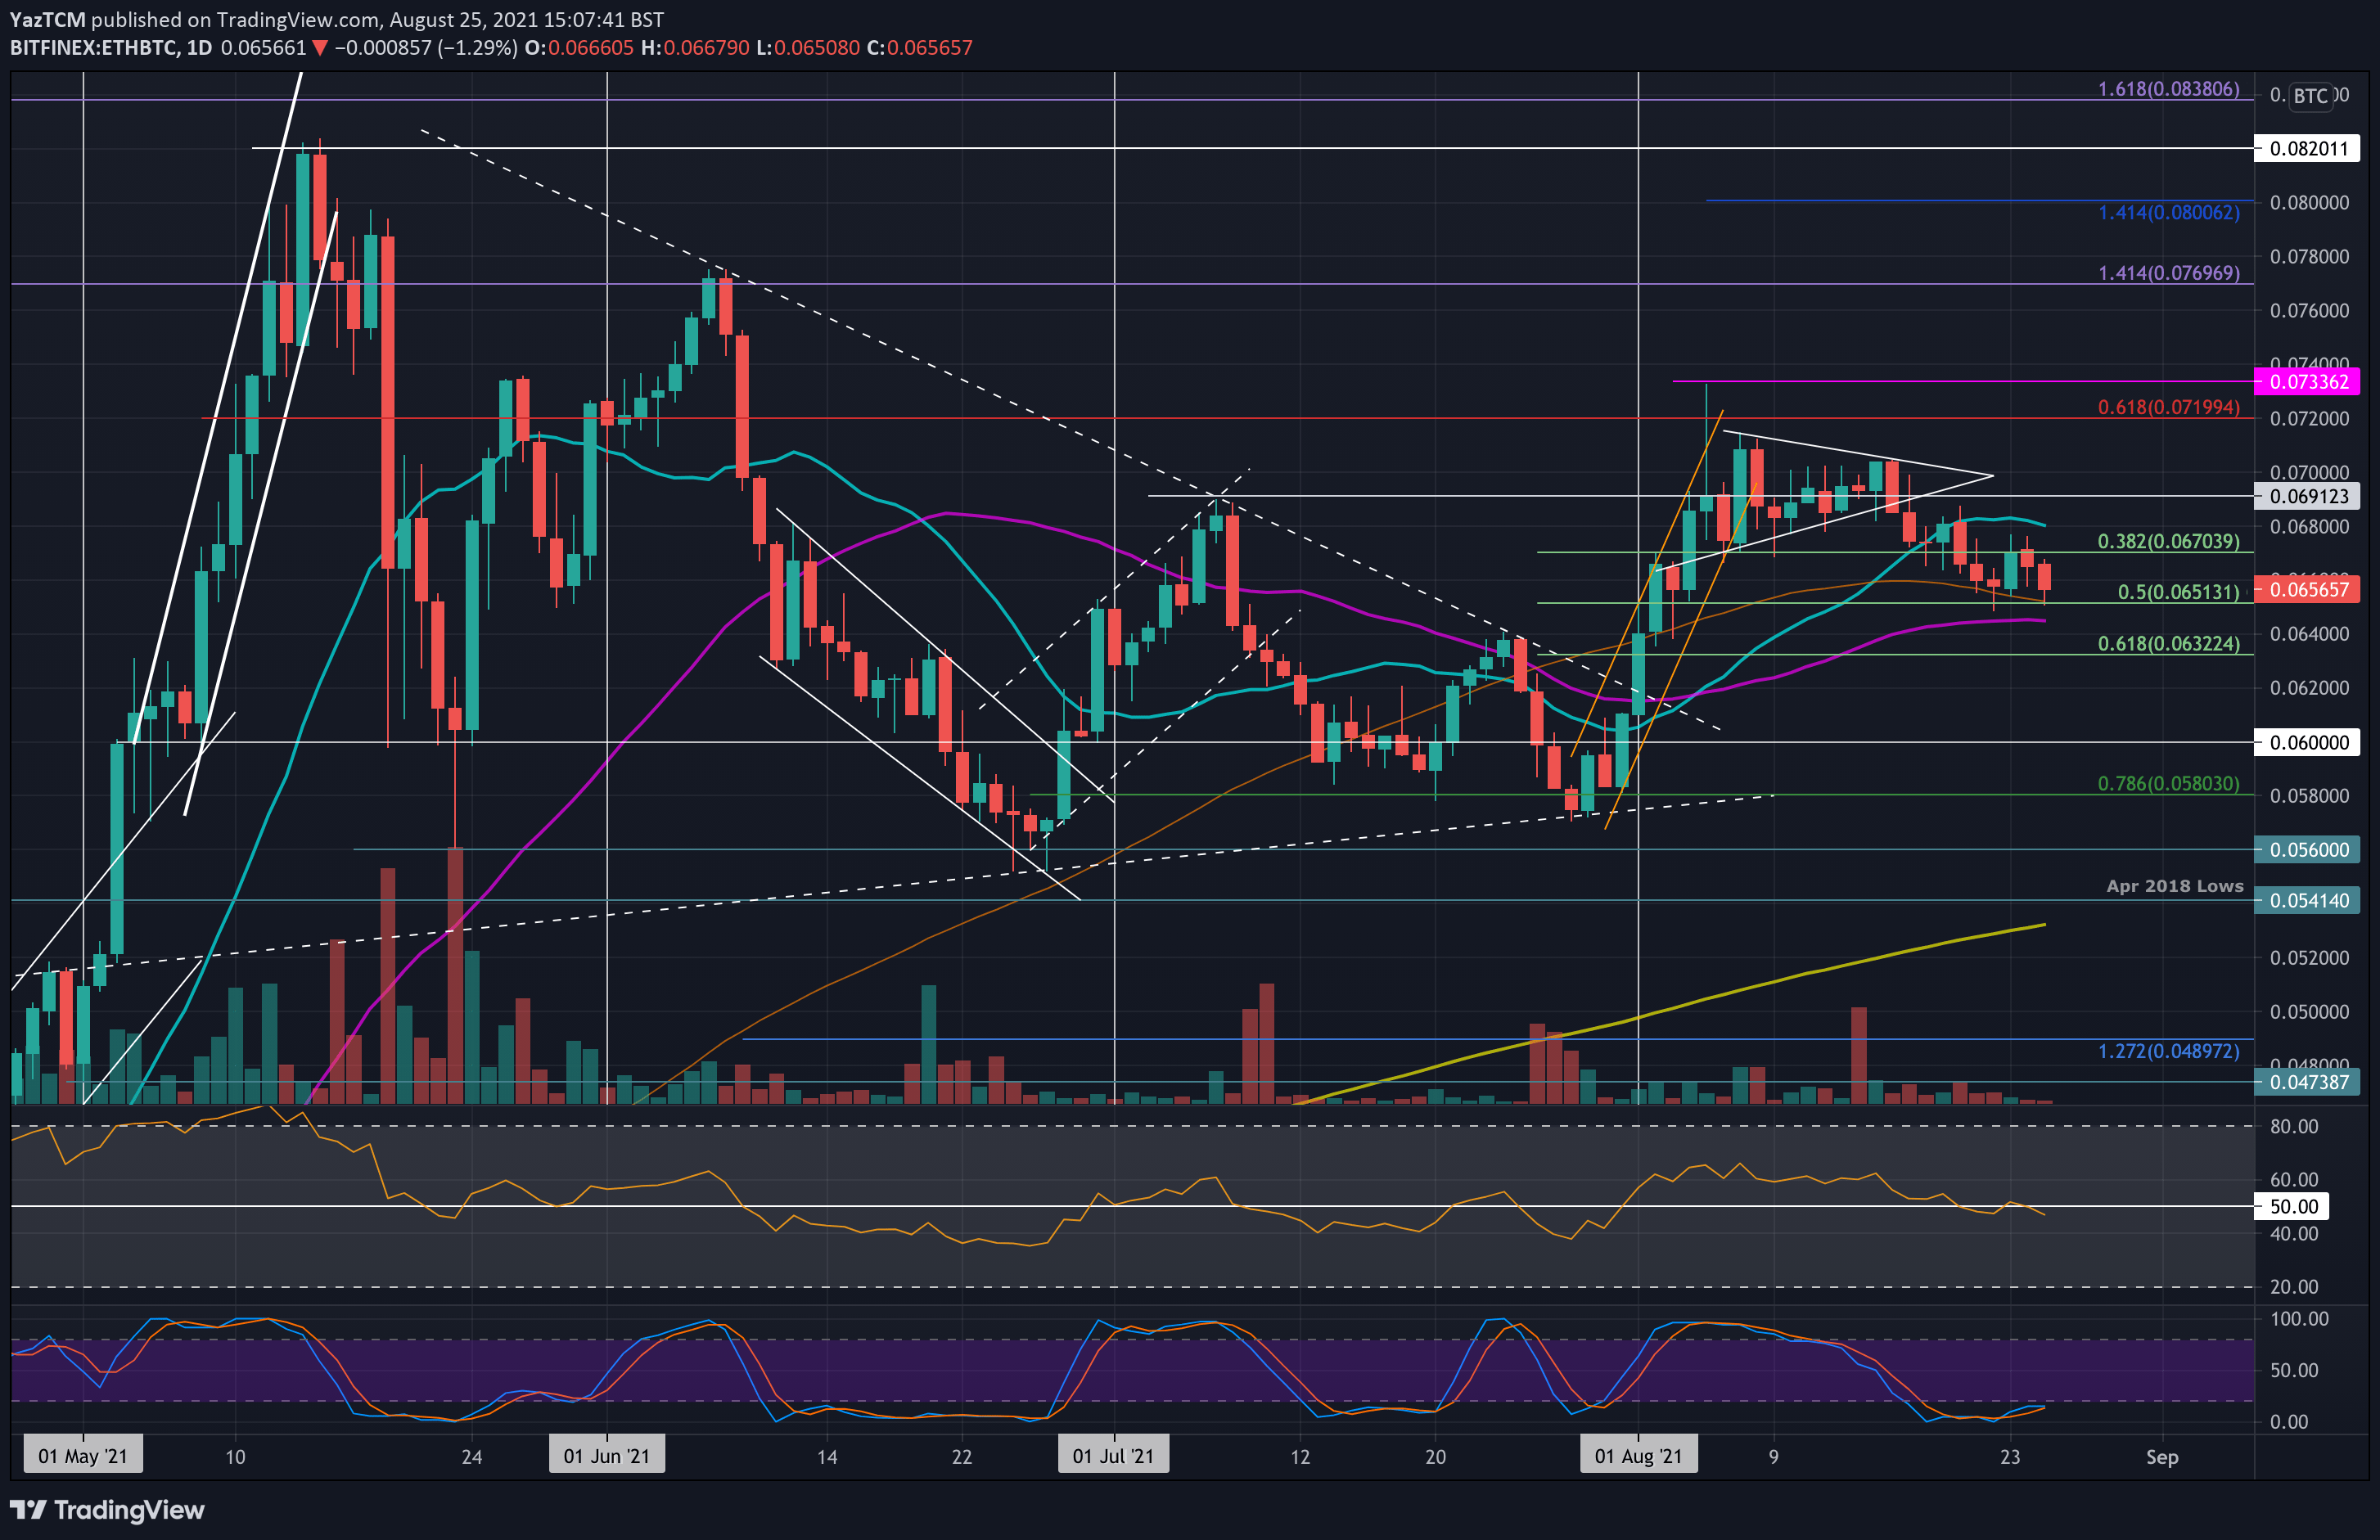
ETH/BTC has made lower lows since dropping beneath the symmetrical triangle pattern earlier in August. Over the past week, ETH against BTC has been using the 100-day MA as support. On Monday, it rebounded from the moving average line, but the market failed to continue above the 0.067 BTC level.
It dropped from 0.067 BTC yesterday and continued today to retest the 100-day MA support once again, which is further bolstered by a .5 Fib. ETH/BTC will look to close the day above the MA-100.
ETH-BTC Short Term Price Prediction
Moving forward, the first support lies at 0.065 BTC (100-day MA & .5 Fib). This is closely followed by 0.0645 BTC (50-day MA), 0.0632 BTC (.618 Fib), and 0.062 BTC.
On the other side, the first resistance lies at 0.067 BTC. This is followed by 0.068 BTC (20-day MA), 0.07 BTC, and 0.072 BTC (bearish .618 Fib).
The daily RSI has slipped beneath the midline again today, signaling that the bears are attempting to gain control of the market momentum.