Ethereum is about to end this week in the red. The bears were able to push the price down since nailing this week’s high at 47. Currently, the daily MA-20 line acts as a solid support level, and the bulls struggle to hold it. The Daily Chart Technical analysis by Grizzly On the daily timeframe, ETH dropped towards the daily MA20 (moving average) line after the bulls failed at the significant daily MA200. Now the big question is whether the uptrend is over? To answer this question, it is necessary to determine the critical support and resistance levels. As shown in the following chart, the daily MA50 (marked yellow) and MA100 (marked blue) are very close to each other, which can act as a strong psychological support level (marked green). It is safe for the bulls as
Topics:
CryptoVizArt considers the following as important: ETH Analysis, ETHBTC, Ethereum (ETH) Price, ethusd
This could be interesting, too:
Mandy Williams writes Ethereum Derivatives Metrics Signal Modest Downside Tail Risk Ahead: Nansen
Jordan Lyanchev writes Weekly Bitcoin, Ethereum ETF Recap: Light at the End of the Tunnel for BTC
CryptoVizArt writes Will Weak Momentum Drive ETH to .5K? (Ethereum Price Analysis)
Jordan Lyanchev writes Bybit Hack Fallout: Arthur Hayes, Samson Mow Push for Ethereum Rollback
Ethereum is about to end this week in the red. The bears were able to push the price down since nailing this week’s high at $3547. Currently, the daily MA-20 line acts as a solid support level, and the bulls struggle to hold it.
The Daily Chart
Technical analysis by Grizzly
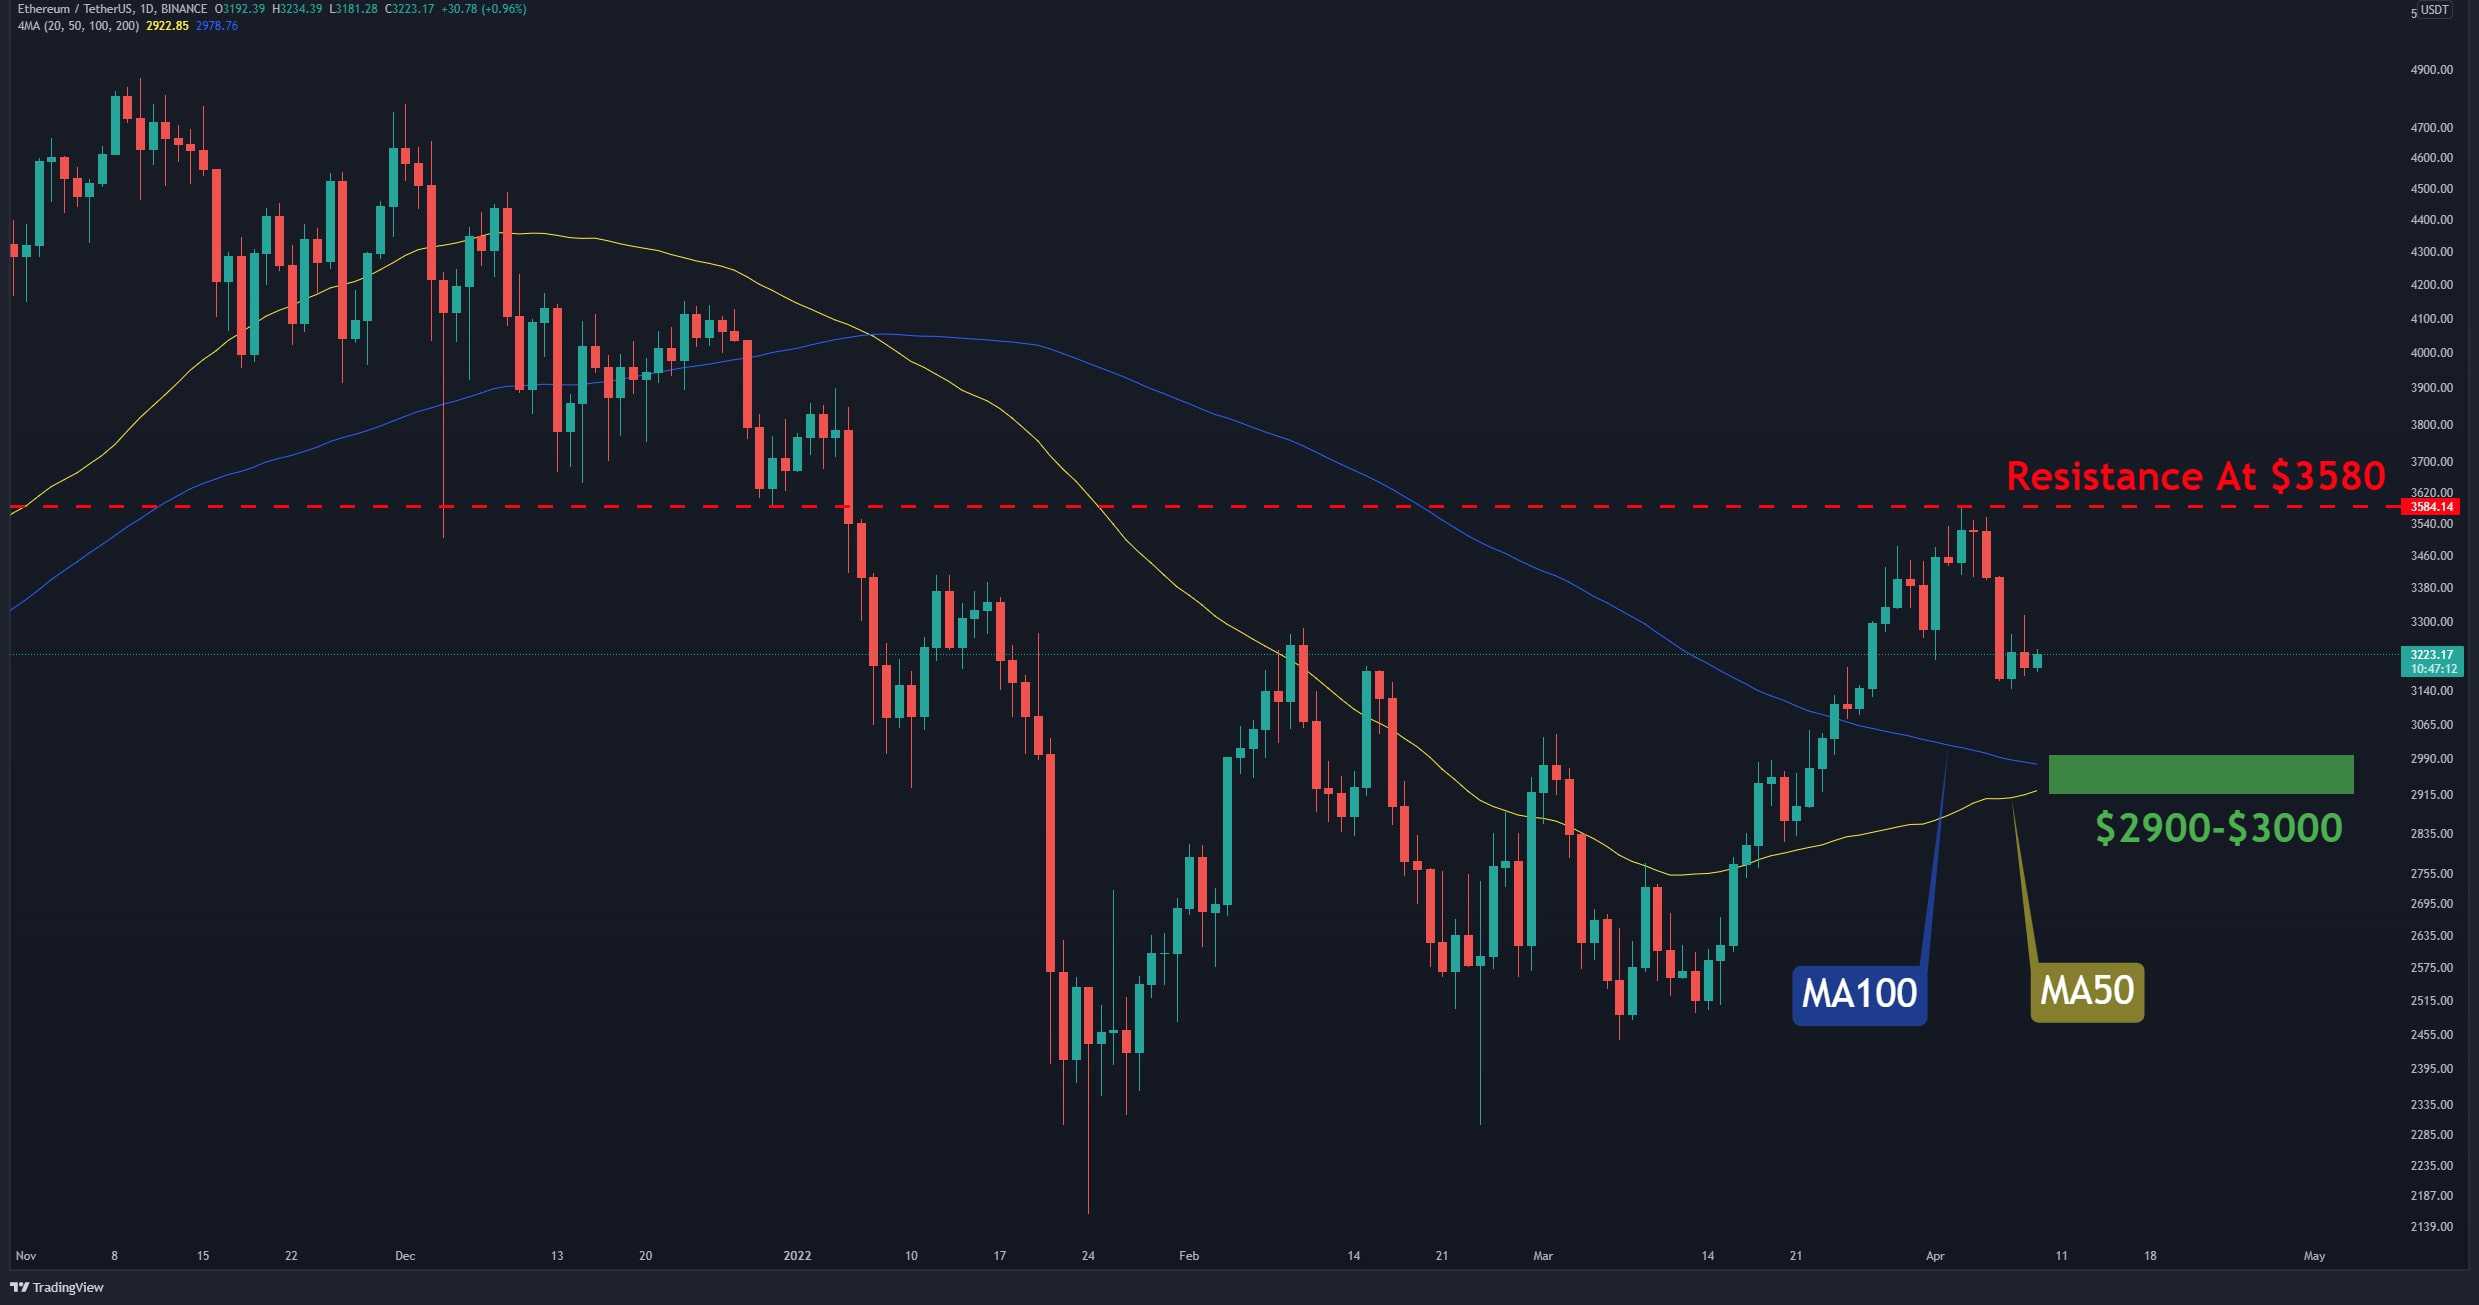
On the daily timeframe, ETH dropped towards the daily MA20 (moving average) line after the bulls failed at the significant daily MA200.
Now the big question is whether the uptrend is over? To answer this question, it is necessary to determine the critical support and resistance levels.
As shown in the following chart, the daily MA50 (marked yellow) and MA100 (marked blue) are very close to each other, which can act as a strong psychological support level (marked green).
It is safe for the bulls as long as ETH is trading above this support. Conversely, correction is still possible if ETH does not reclaim above the resistance at $3580 or the daily MA200 line.
Moving Average Levels
MA20: $3255
MA50: $2922
MA100: $2978
MA200: $3489
The 4-Hour Chart
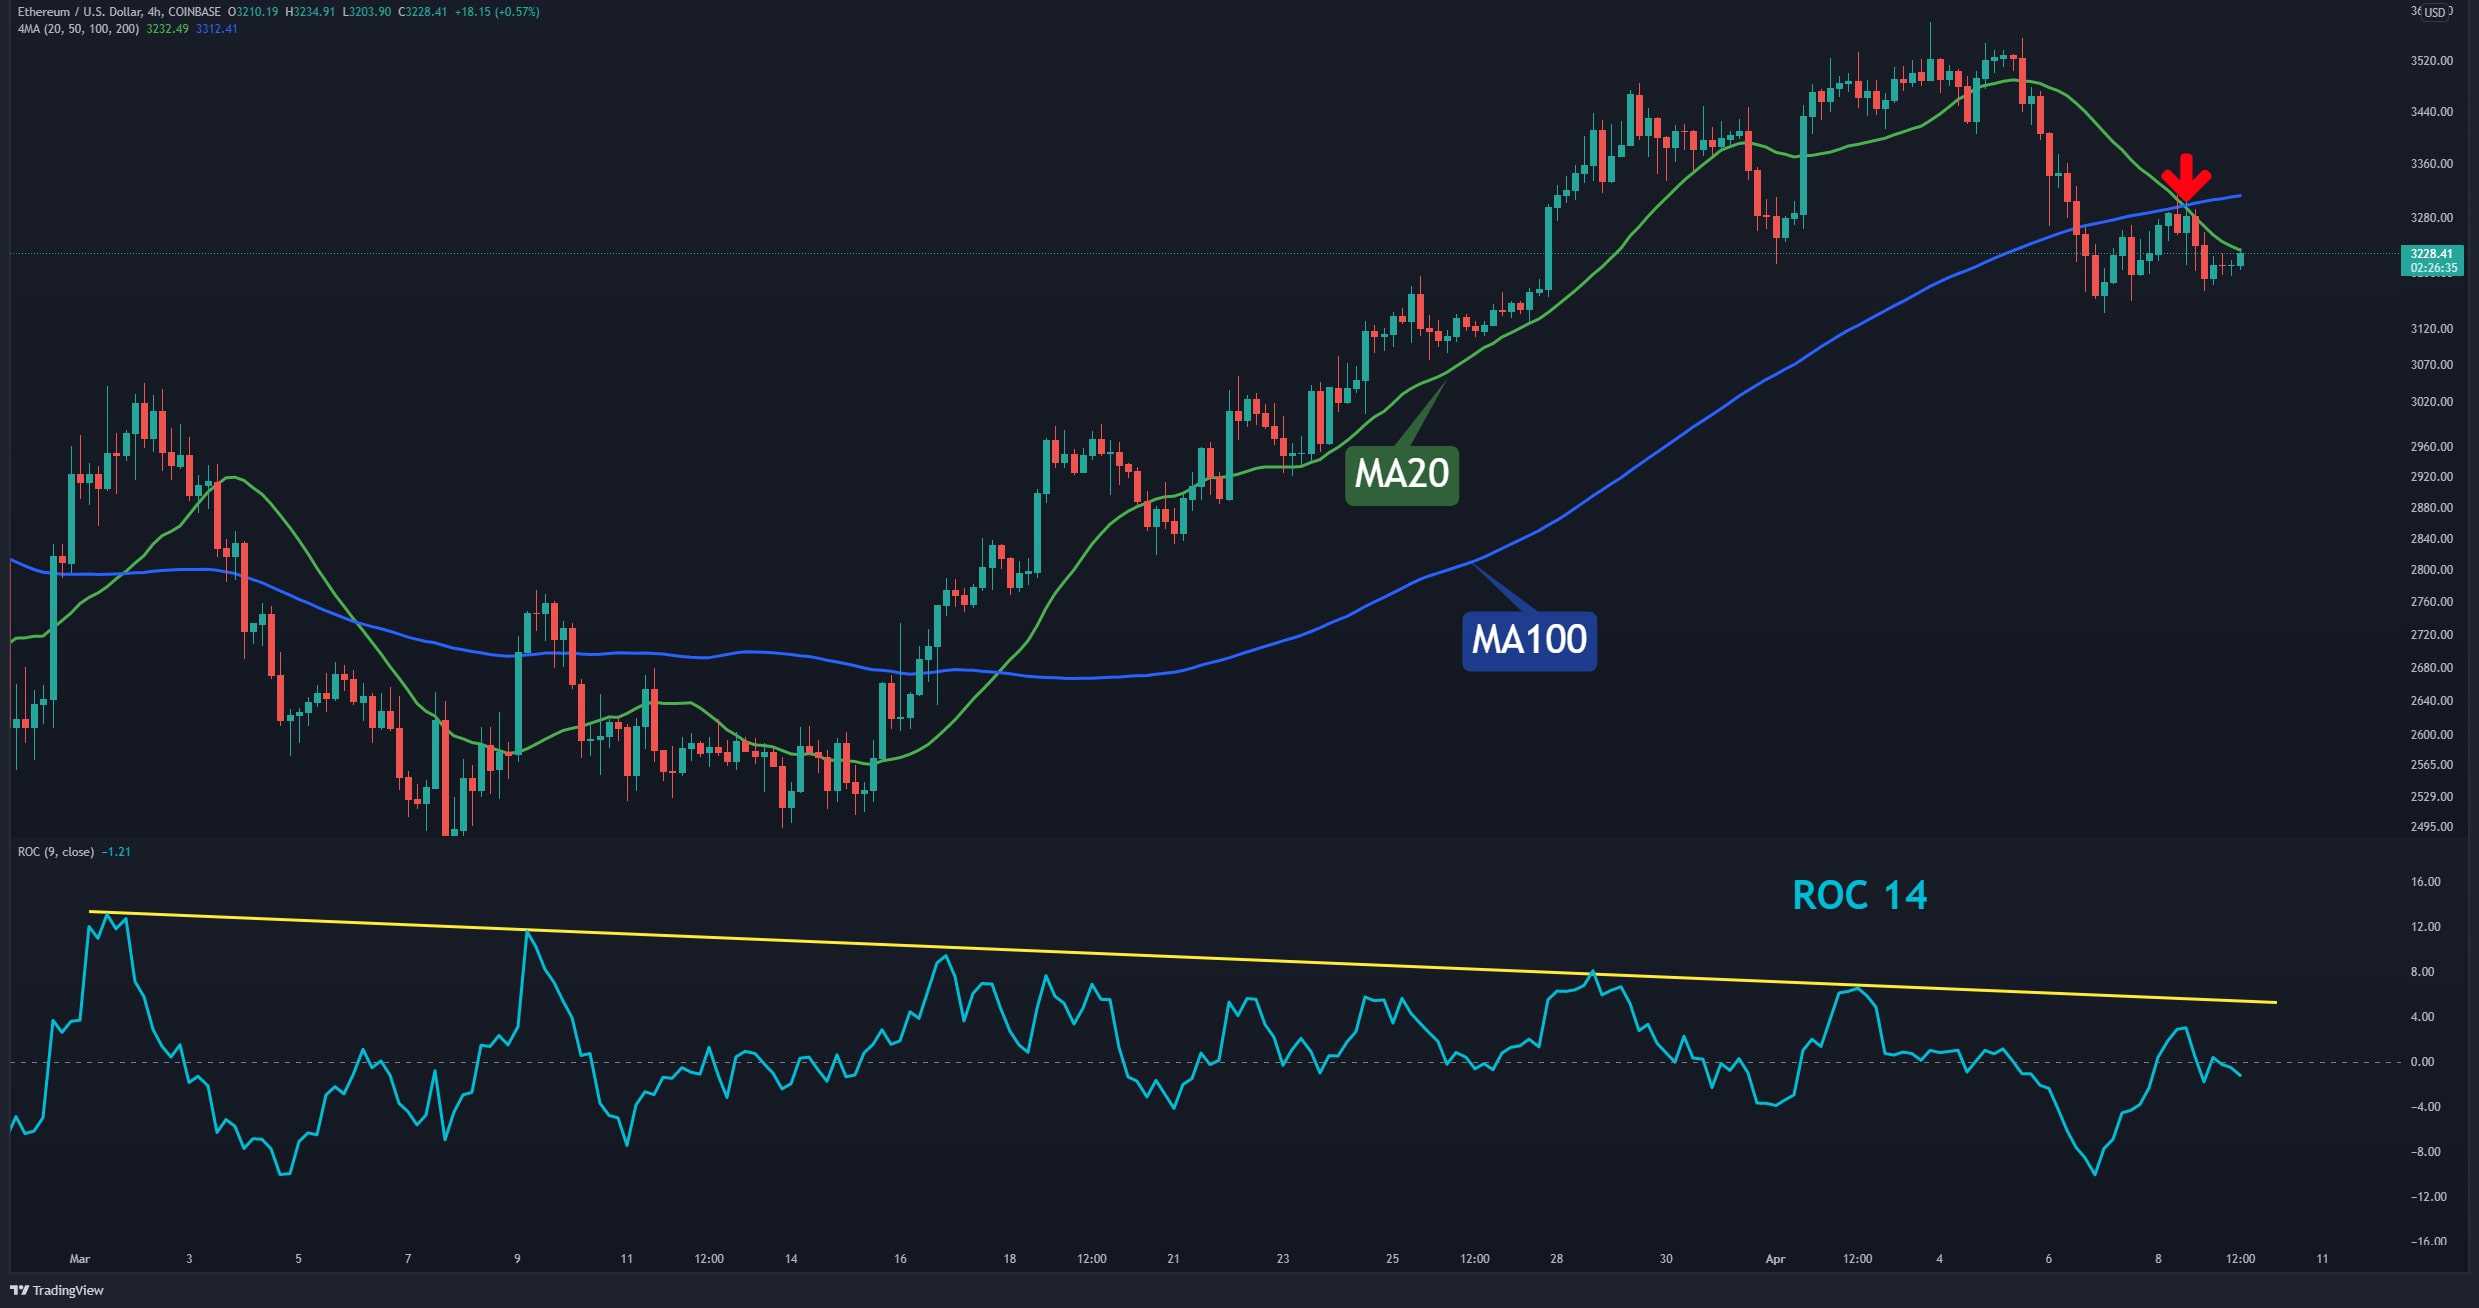
In the 4-hour timeframe, ETH is trading below the MA20 (marked green) and MA100 (marked blue) and has not been able to close a candlestick above them in the recent downtrend.
ROC 14 indicator is also in the bearish zone, and if it moves towards the descending line (marked yellow), ETH might see a short-term price increase.
At the moment, the most important for ETH is to reclaim the MA100 line to form a higher high, which is a strong bullish sign.
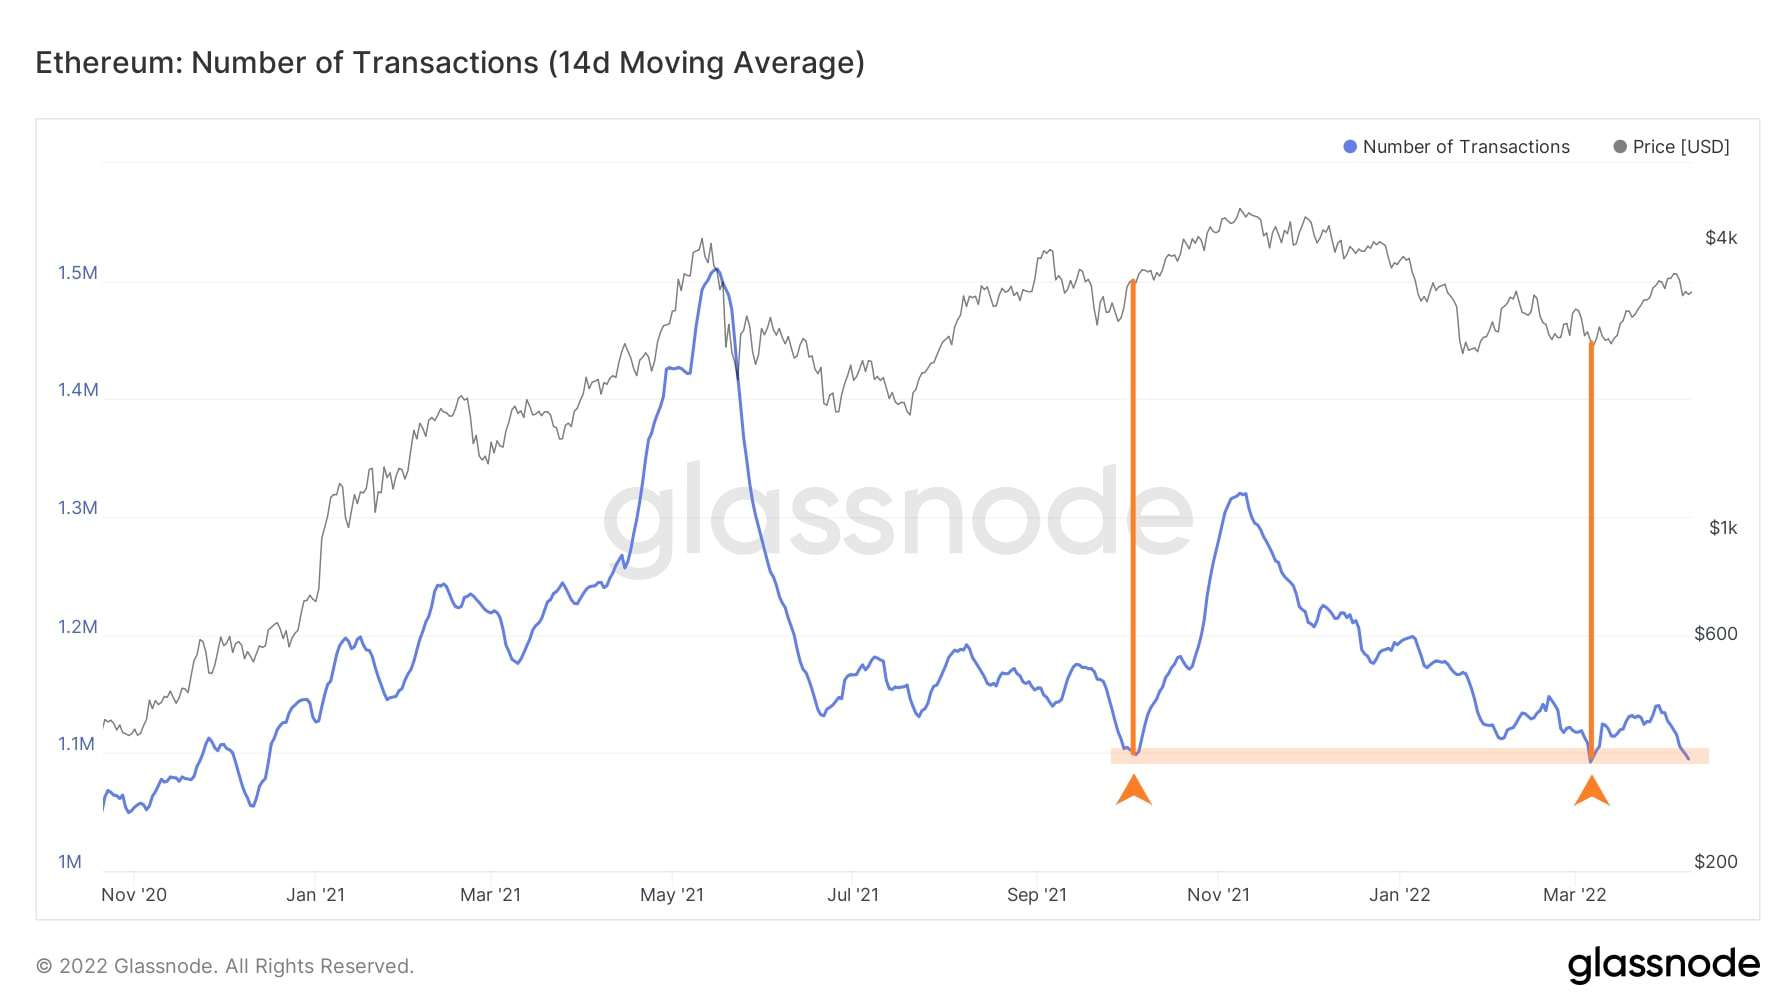
On-chain analysis: Number of Transactions (14d Moving Average)
The total amount of transactions, whereas only successful transactions are counted.
When the price increases, the number of transactions can be expected to rise. Currently, this metric has reached a critical point.
In past occurrences, after touching this level, an upward trend has initiated. If this happens again, and this metric starts to increase with a steep slope, then based on this indicator, ETH can expect to target above $4000.