After Ethereum’s switch to a proof-of-stake, the bears took control of the market. Investors have turned away from high-risk assets like equities and cryptocurrencies. The ETH weekly candle closed at ,334 yesterday, which is a new low. Technical Analysis By Grizzly The Daily Chart The price is currently down 27% from the high of ,789 reached on September 11th. The lowest level touched in today’s session is ,280, which is just above the 200-week moving average (in yellow). Additionally, the cryptocurrency has once more met the one-year descending support line (in green), a level that has saved the price from dropping further. The chances of recovering from the crypto winter soon will be very slim if the bulls are unable to defend this pretty robust support. If the
Topics:
CryptoVizArt considers the following as important: ETH Analysis, ETHBTC, Ethereum (ETH) Price, ethusd
This could be interesting, too:
Mandy Williams writes Ethereum Derivatives Metrics Signal Modest Downside Tail Risk Ahead: Nansen
Jordan Lyanchev writes Weekly Bitcoin, Ethereum ETF Recap: Light at the End of the Tunnel for BTC
CryptoVizArt writes Will Weak Momentum Drive ETH to .5K? (Ethereum Price Analysis)
Jordan Lyanchev writes Bybit Hack Fallout: Arthur Hayes, Samson Mow Push for Ethereum Rollback
After Ethereum’s switch to a proof-of-stake, the bears took control of the market. Investors have turned away from high-risk assets like equities and cryptocurrencies. The ETH weekly candle closed at $1,334 yesterday, which is a new low.
Technical Analysis
By Grizzly
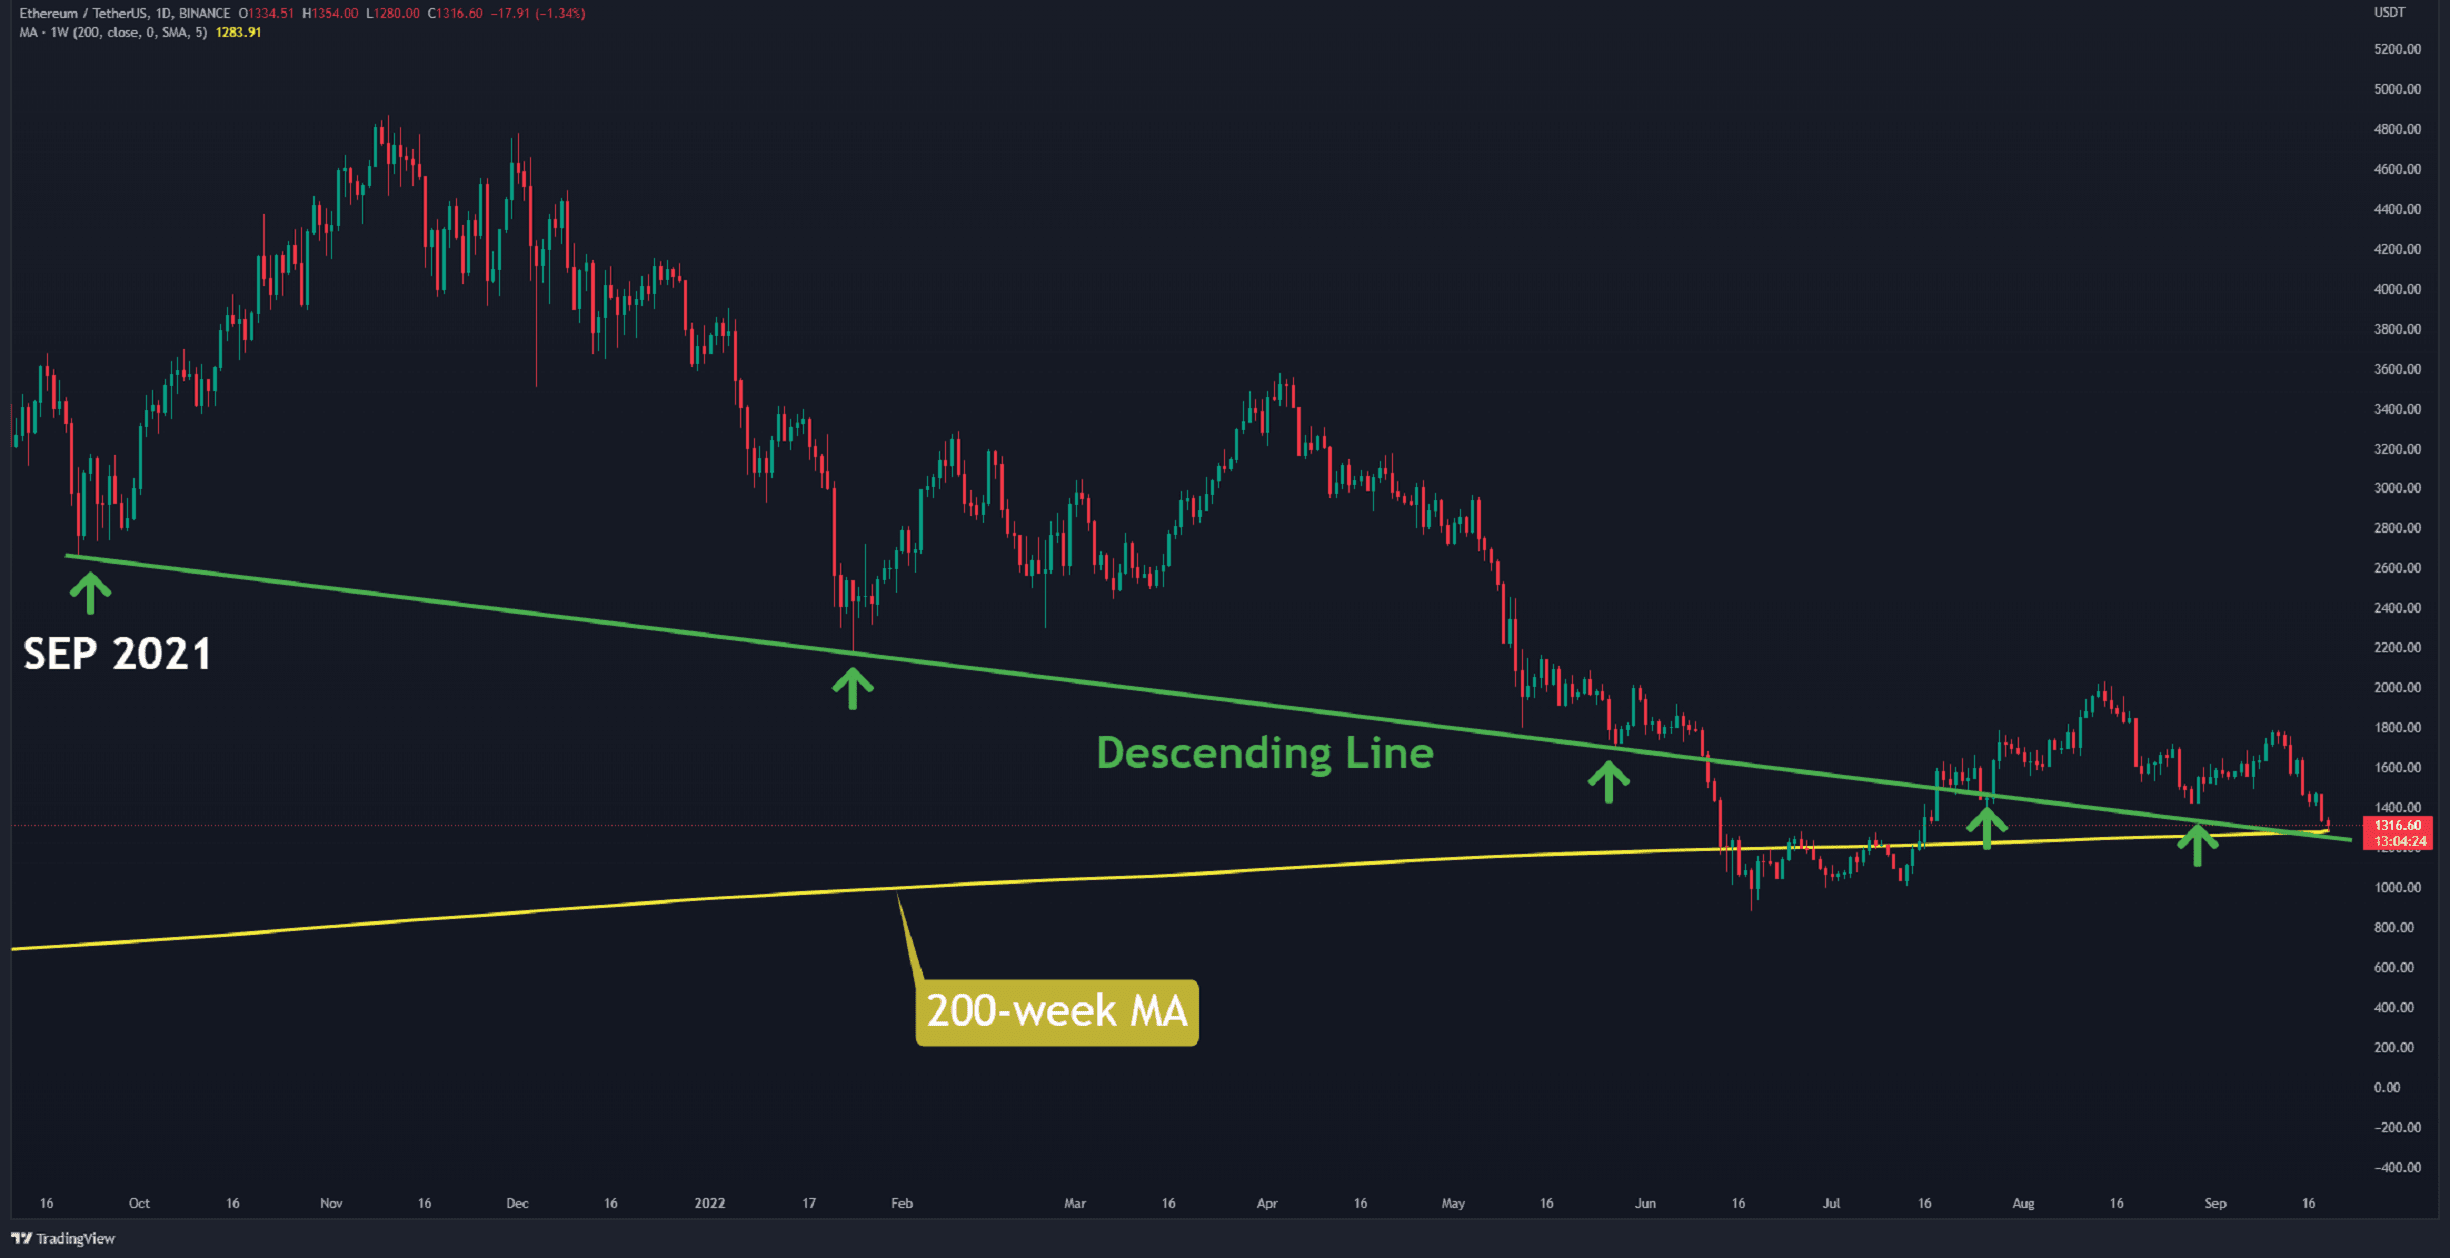
The Daily Chart
The price is currently down 27% from the high of $1,789 reached on September 11th. The lowest level touched in today’s session is $1,280, which is just above the 200-week moving average (in yellow).
Additionally, the cryptocurrency has once more met the one-year descending support line (in green), a level that has saved the price from dropping further. The chances of recovering from the crypto winter soon will be very slim if the bulls are unable to defend this pretty robust support.
If the price drops below $1,280, a retest of $1,000 becomes much more probable. As long as the chart doesn’t paint higher highs and higher lows, the bias remains negative.
Key Support Levels: $1280 & $1000
Key Resistance Levels: $1420 & $1700
Daily Moving Averages:
MA20: $1574
MA50: $1652
MA100: $1467
MA200: $2036
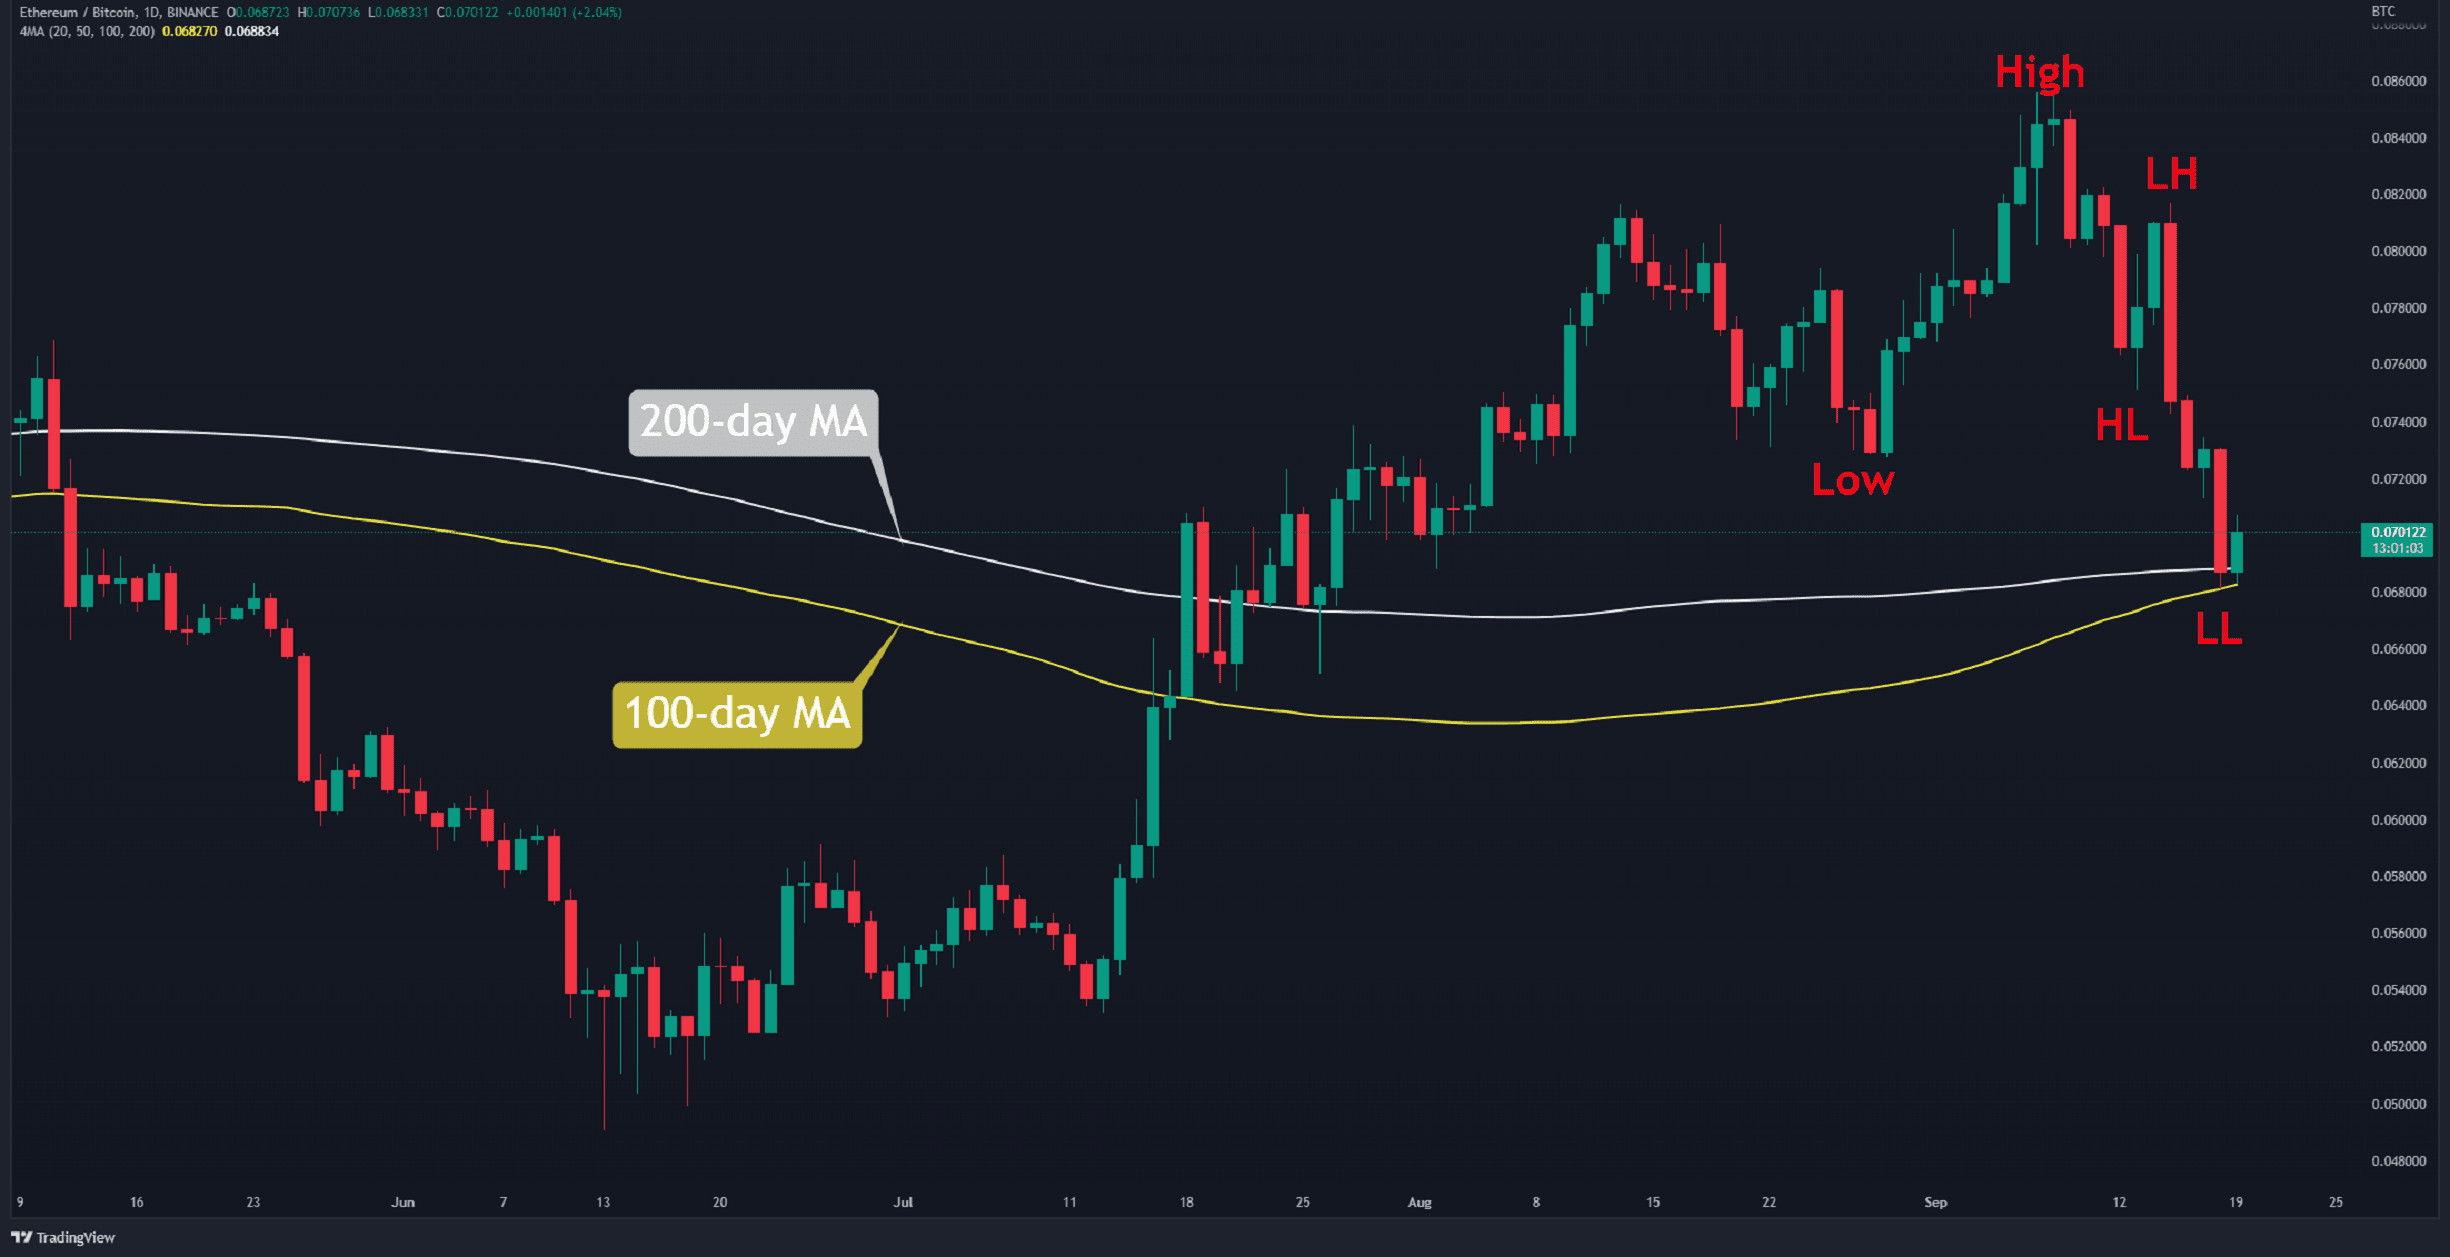
The ETH/BTC Chart
Against Bitcoin, the bears dragged the cryptocurrency below 0.072 BTC. The price has fallen by 20% in the last ten days, which is unprecedented in the overly bullish trend of the last three months.
Lower highs and lower lows came together to form the pattern, which is entirely bearish. At the moment, support is holding the price at 0.068 BTC, where the 100-day and 200-day moving average lines connect.
The latest drop can be considered a bear trap if the price recovers over 0.072 BTC. Otherwise, the next support levels are found at 0.065 BTC and 0.06 BTC.
Key Support Levels: 0.068 & 0.065 BTC
Key Resistance Levels: 0.072 & 0.08 BTC