Despite a slow down of the recent bearish momentum, the bears still seem to control the market. In other words, bulls are reluctant to push the ETH price higher. Technical Analysis Technical Analysis By Grizzly The Daily Chart ETH is trading above the most important Fibonacci Retracement level on the daily timeframe – the 0.618 level. Buyers have been defending this level for the past five days. However, the thick Ichimoku cloud has prevented ETH from breaking above the psychological resistance at 00. The blue rectangle, which represents the resistance range of 00-00, is currenly the most critical resistance zone. If the bulls can breach above it, the buying pressure will probably be absorbed to continue the uptrend. As it seems now, this scenario is complex
Topics:
CryptoVizArt considers the following as important: ETH Analysis, ETHBTC, Ethereum (ETH) Price, ethusd
This could be interesting, too:
Mandy Williams writes Ethereum Derivatives Metrics Signal Modest Downside Tail Risk Ahead: Nansen
Jordan Lyanchev writes Weekly Bitcoin, Ethereum ETF Recap: Light at the End of the Tunnel for BTC
CryptoVizArt writes Will Weak Momentum Drive ETH to .5K? (Ethereum Price Analysis)
Jordan Lyanchev writes Bybit Hack Fallout: Arthur Hayes, Samson Mow Push for Ethereum Rollback
Despite a slow down of the recent bearish momentum, the bears still seem to control the market. In other words, bulls are reluctant to push the ETH price higher.
Technical Analysis
Technical Analysis By Grizzly
The Daily Chart
ETH is trading above the most important Fibonacci Retracement level on the daily timeframe – the 0.618 level.
Buyers have been defending this level for the past five days. However, the thick Ichimoku cloud has prevented ETH from breaking above the psychological resistance at $3000.
The blue rectangle, which represents the resistance range of $3000-$3300, is currenly the most critical resistance zone. If the bulls can breach above it, the buying pressure will probably be absorbed to continue the uptrend.
As it seems now, this scenario is complex because buyer takers have not yet started their greedy purchases. Macroeconomic conditions have caused a surge in fear levels and doubts in the financial markets. The steady increase of the DXY index has also led to the recent bearish sentiment of high-risk assets.
Key Support Levels: $2500 & $2300
Key Resistance Levels: $3000 & $3300
Moving Averages:
MA20: $2998
MA50: $3046
MA100: $2903
MA200: $3464

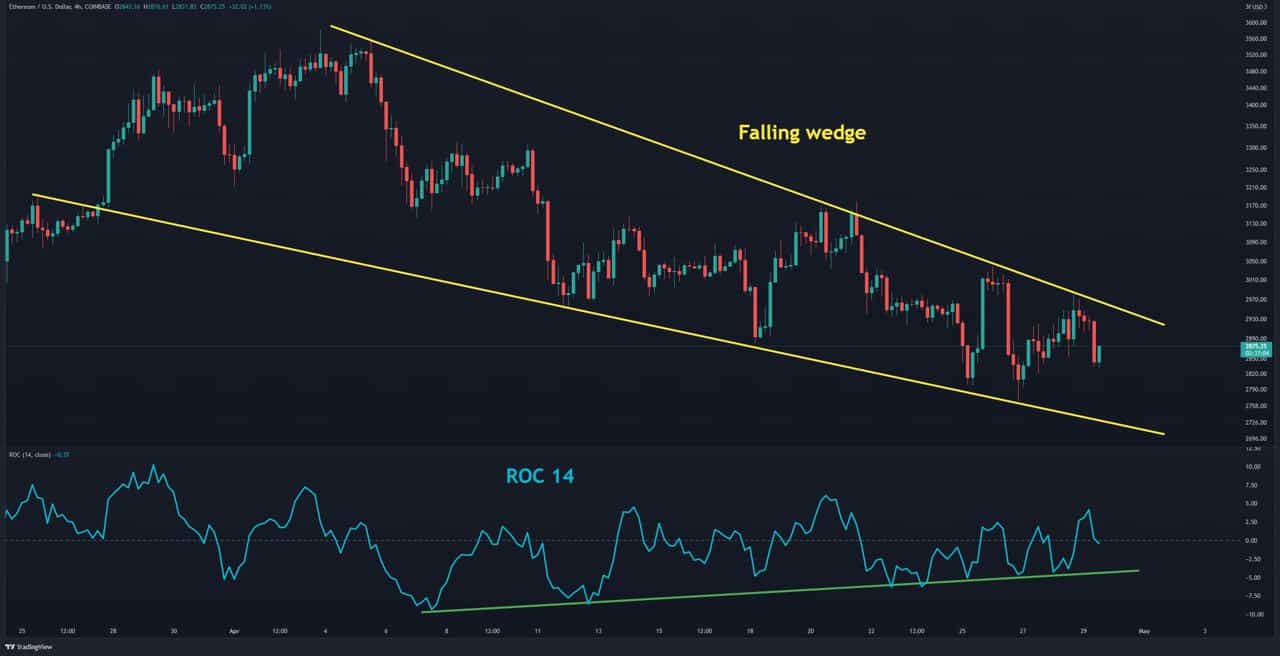
The 4-Hour Chart
On the 4-hour timeframe, ETH is trading inside a falling wedge, which is technically a bullish pattern as long as the price can break out of the falling wedge and form a higher high, which should be around the critical level of $3,000.
Once the indicator has entered the bearish zone, the dynamic trend line (marked green) will likely be retested. From there, we can expect a short-term continuation of the uptrend.
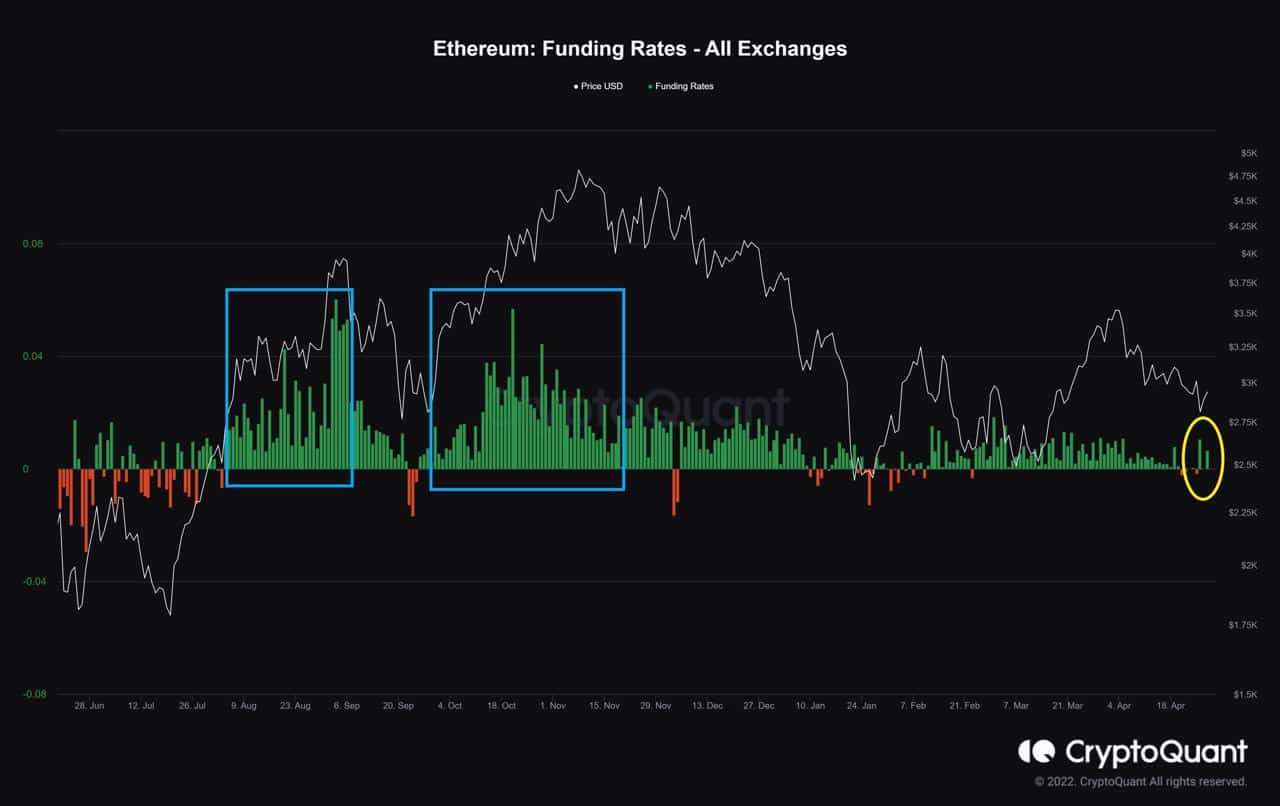
On-chain- Analysis: Funding Rate
Definition: Periodic payments to long or short traders based on the difference between perpetual contract markets and spot prices. Funding rates represent traders’ sentiments in the perpetual swaps market, and the amount is proportional to the number of contracts.
Positive funding rates indicate that long position traders are dominant and are willing to pay funding to short traders. On the other hand, Negative funding rates indicate that short position traders are dominant and are eager to pay long traders.
Now, this is the first time the funding rate has been positive (yellow circle), indicating that bullish sentiment is likely to dominate the market in a week. However, this increase is not as substantial as it was in past occurances (blue rectangle).