The cryptocurrency market has calmed down after the massive drop over the last two days. Currently, ETH lies on top of a critical support level, which most analysts refer to as a key level developed over the previous 12 months. Technical Analysis Technical Analysis By Grizzly The Daily Chart On the daily timeframe, after the bears pushed the price down more than 10% over the past two days, the weekend has been relatively stable. However, is this calm before a giant storm? ETH moves upward inside an ascending channel (yellow), confirming the upward trend – forming higher highs and higher lows. Suppose the bulls can maintain the price in this trajectory, we can expect the horizontal resistance at 00 to be tested again. On the other hand, if the price continues down, the
Topics:
CryptoVizArt considers the following as important: ETH Analysis, ETHBTC, Ethereum (ETH) Price, ethusd
This could be interesting, too:
Mandy Williams writes Ethereum Derivatives Metrics Signal Modest Downside Tail Risk Ahead: Nansen
Jordan Lyanchev writes Weekly Bitcoin, Ethereum ETF Recap: Light at the End of the Tunnel for BTC
CryptoVizArt writes Will Weak Momentum Drive ETH to .5K? (Ethereum Price Analysis)
Jordan Lyanchev writes Bybit Hack Fallout: Arthur Hayes, Samson Mow Push for Ethereum Rollback
The cryptocurrency market has calmed down after the massive drop over the last two days. Currently, ETH lies on top of a critical support level, which most analysts refer to as a key level developed over the previous 12 months.
Technical Analysis
Technical Analysis By Grizzly
The Daily Chart
On the daily timeframe, after the bears pushed the price down more than 10% over the past two days, the weekend has been relatively stable.
However, is this calm before a giant storm?
ETH moves upward inside an ascending channel (yellow), confirming the upward trend – forming higher highs and higher lows. Suppose the bulls can maintain the price in this trajectory, we can expect the horizontal resistance at $3000 to be tested again.
On the other hand, if the price continues down, the long-term dynamic support (in green) at $2,500 could be a possible area of support. At the moment, The selling pressure has decreased a little. However, the buyers have not yet dominated the market.
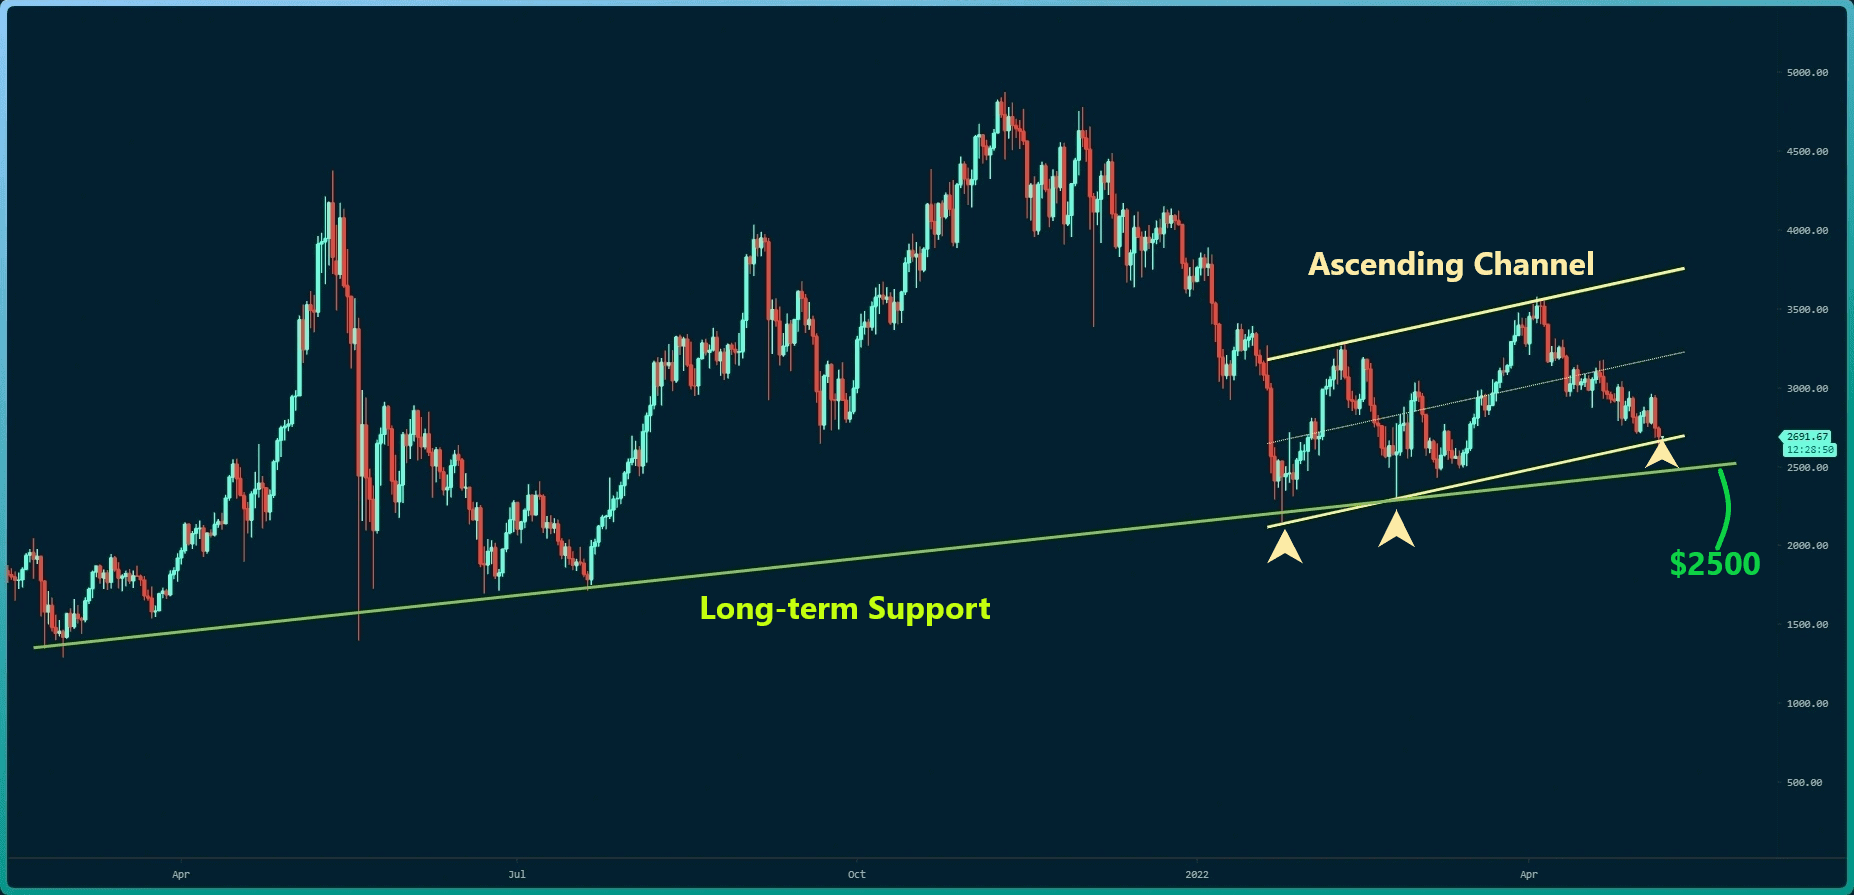
Key Support Levels: $2500 & $2300
Key Resistance Levels: $3000 & $3300
Moving Averages:
MA20: $2887
MA50: $3062
MA100: $2922
MA200: $3425
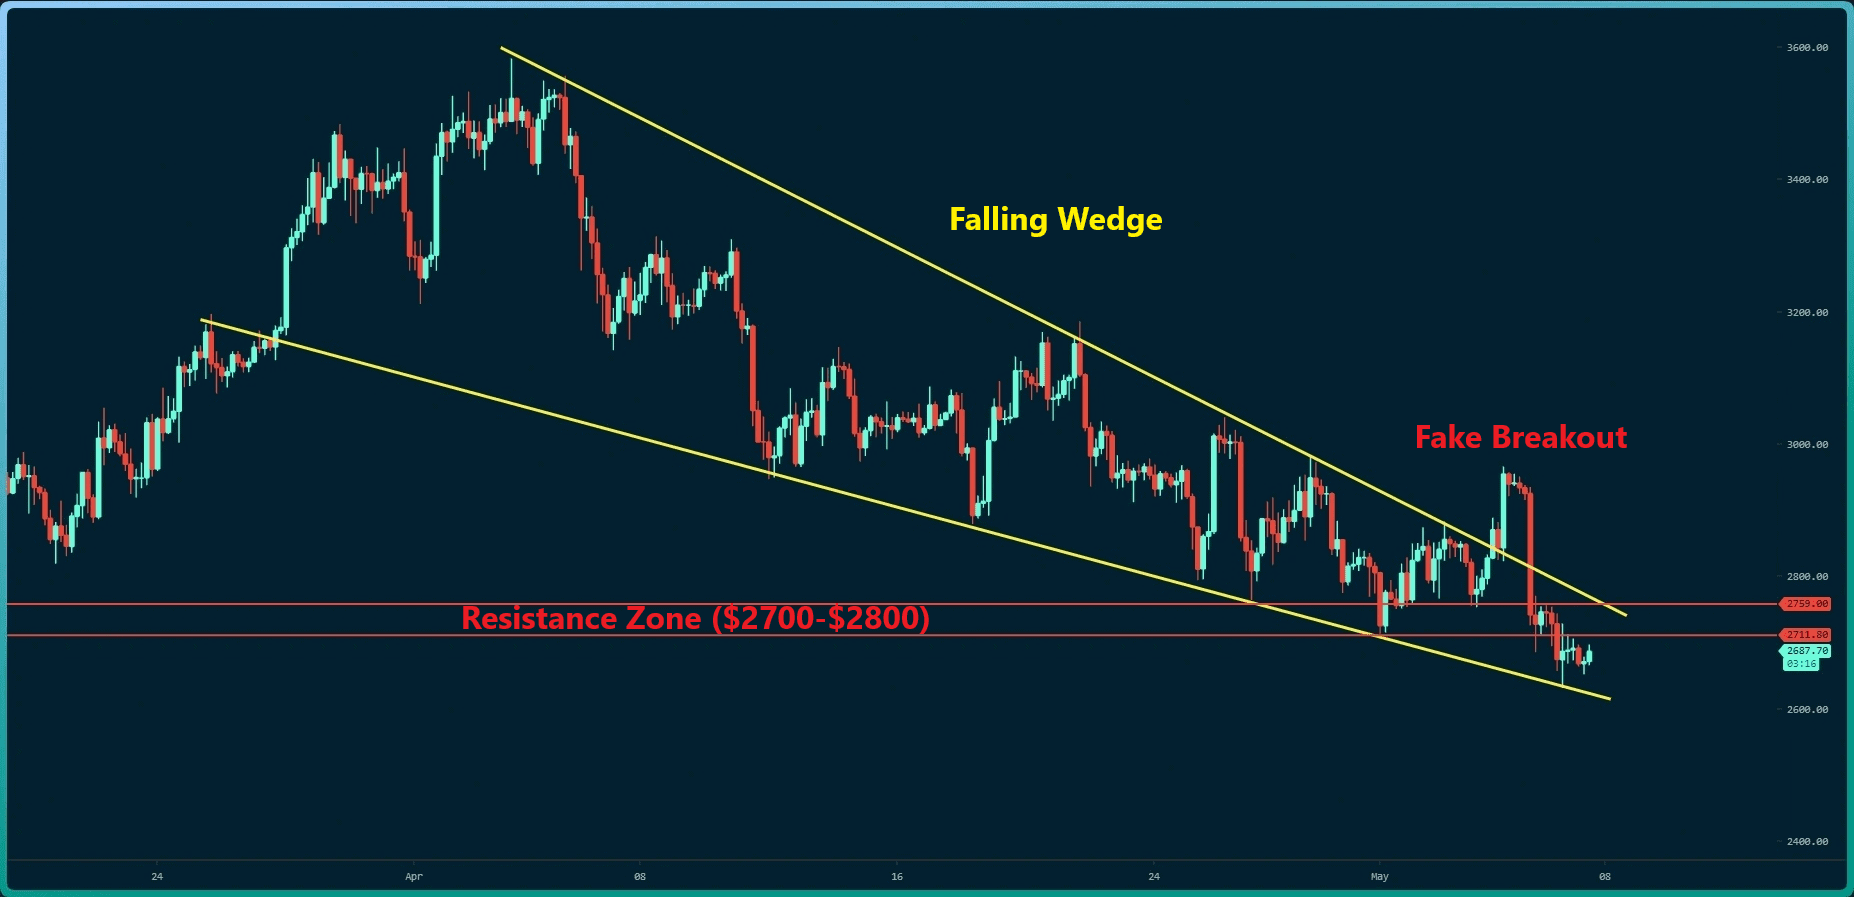
The 4-Hour Chart
On the 4-hour timeframe, ETH is trading inside a falling wedge (in yellow). The price experienced a fake breakout before returning inside the wedge.
So far, the wedge’s bottom has acted as solid support and is likely to see another consolidation in the range of $2700-2800 (in red), which is a major confluence zone in this timeframe. At present, weak candles are formed, which indicates a not-so-significant buying pressure.
On-chain- analysis
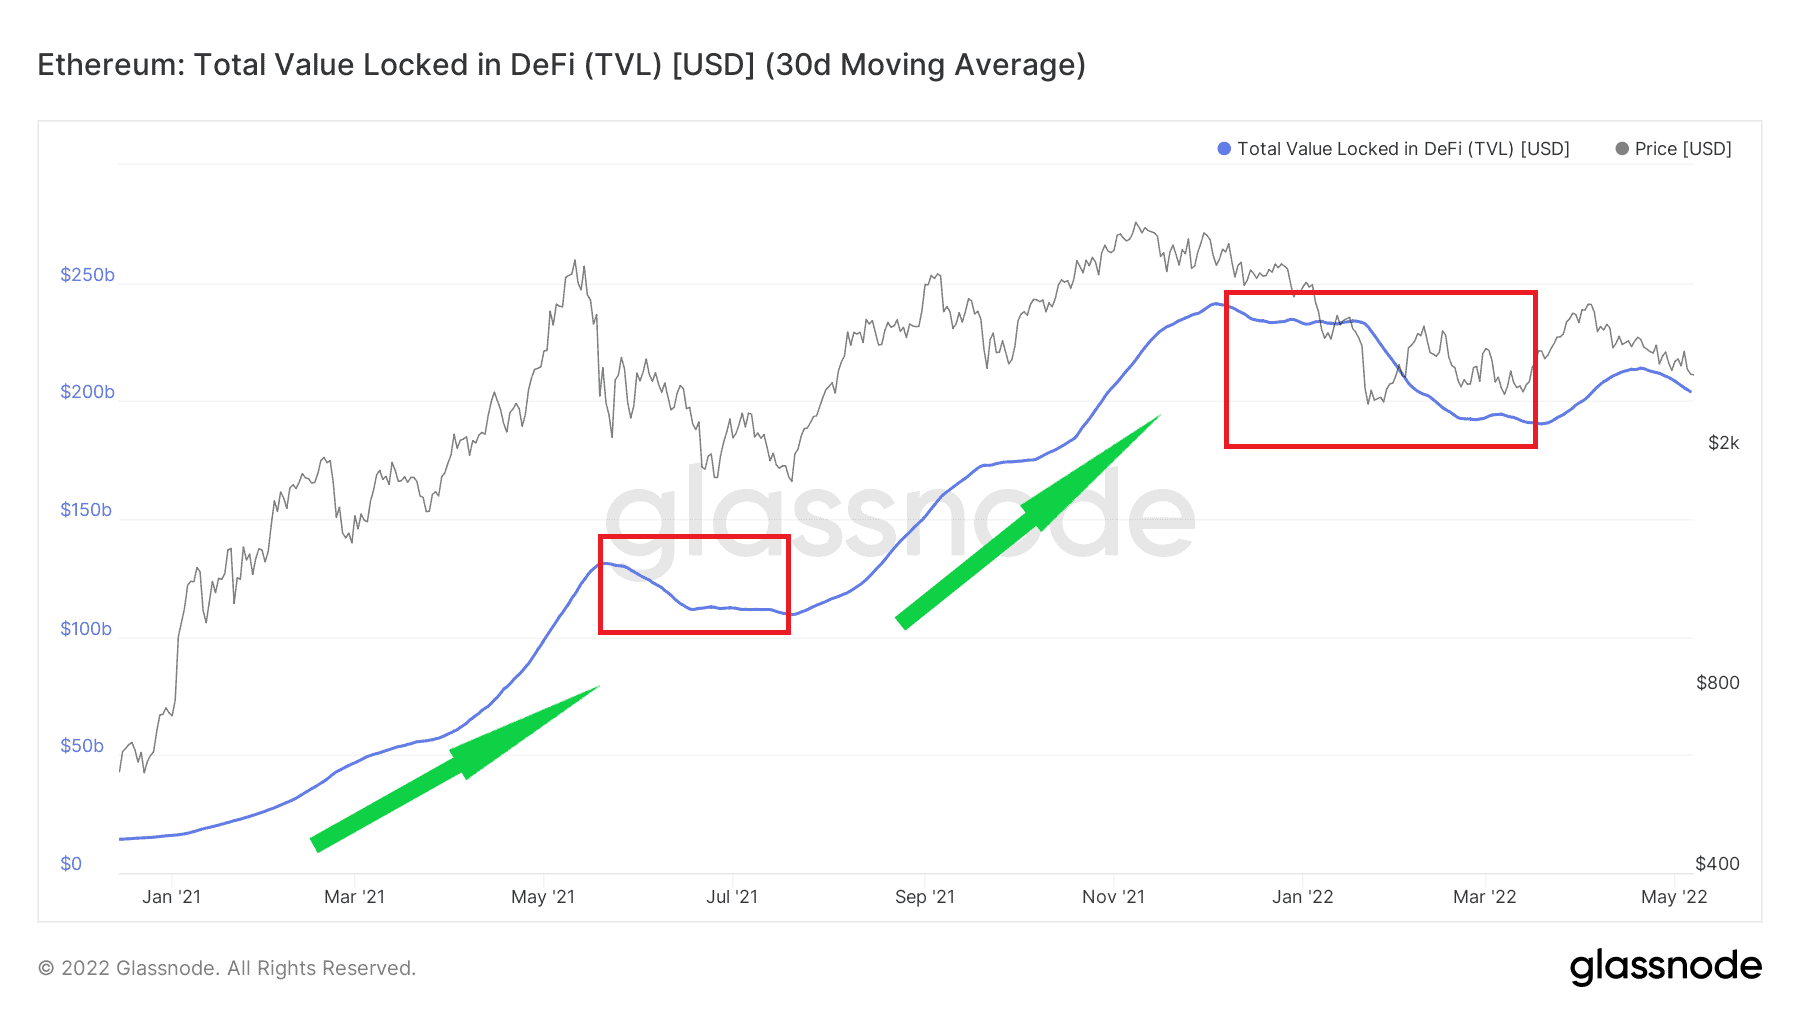
Total Value Locked in DeFi (TVL) – USD – (30D MA)
When the market is bullish, investors have an intense desire to lock their crypto assets in DeFi platforms, which increases the TVL. But at the moment, there is some skepticism among investors, and they probably prefer to have some of their assets in cash.