Despite a 7% spike for Ethereum in the last 48 hours, followed by a steep decline, the possibility of a bullish rally remains low. The price has yet to recover from the major drops that took place in September. The first step towards bullish sentiment would be to reclaim the critical level of ,550. Technical Analysis By Grizzly The Daily Chart As seen below, an ascending triangle pattern (in yellow) has developed on the ETH/USDT trading pair chart. This pattern is textbook bullish (most breakouts’ direction is to the bullish side), but the price is still nowhere near breaking the top of this triangle. The horizontal level of ,550 (in red) has become crucial support since early August but now has become a strong resistance. This is the first significant barrier before
Topics:
CryptoVizArt considers the following as important: ETH Analysis, ETHBTC, Ethereum (ETH) Price, ethusd
This could be interesting, too:
Mandy Williams writes Ethereum Derivatives Metrics Signal Modest Downside Tail Risk Ahead: Nansen
Jordan Lyanchev writes Weekly Bitcoin, Ethereum ETF Recap: Light at the End of the Tunnel for BTC
CryptoVizArt writes Will Weak Momentum Drive ETH to .5K? (Ethereum Price Analysis)
Jordan Lyanchev writes Bybit Hack Fallout: Arthur Hayes, Samson Mow Push for Ethereum Rollback
Despite a 7% spike for Ethereum in the last 48 hours, followed by a steep decline, the possibility of a bullish rally remains low. The price has yet to recover from the major drops that took place in September.
The first step towards bullish sentiment would be to reclaim the critical level of $1,550.
Technical Analysis
By Grizzly
The Daily Chart
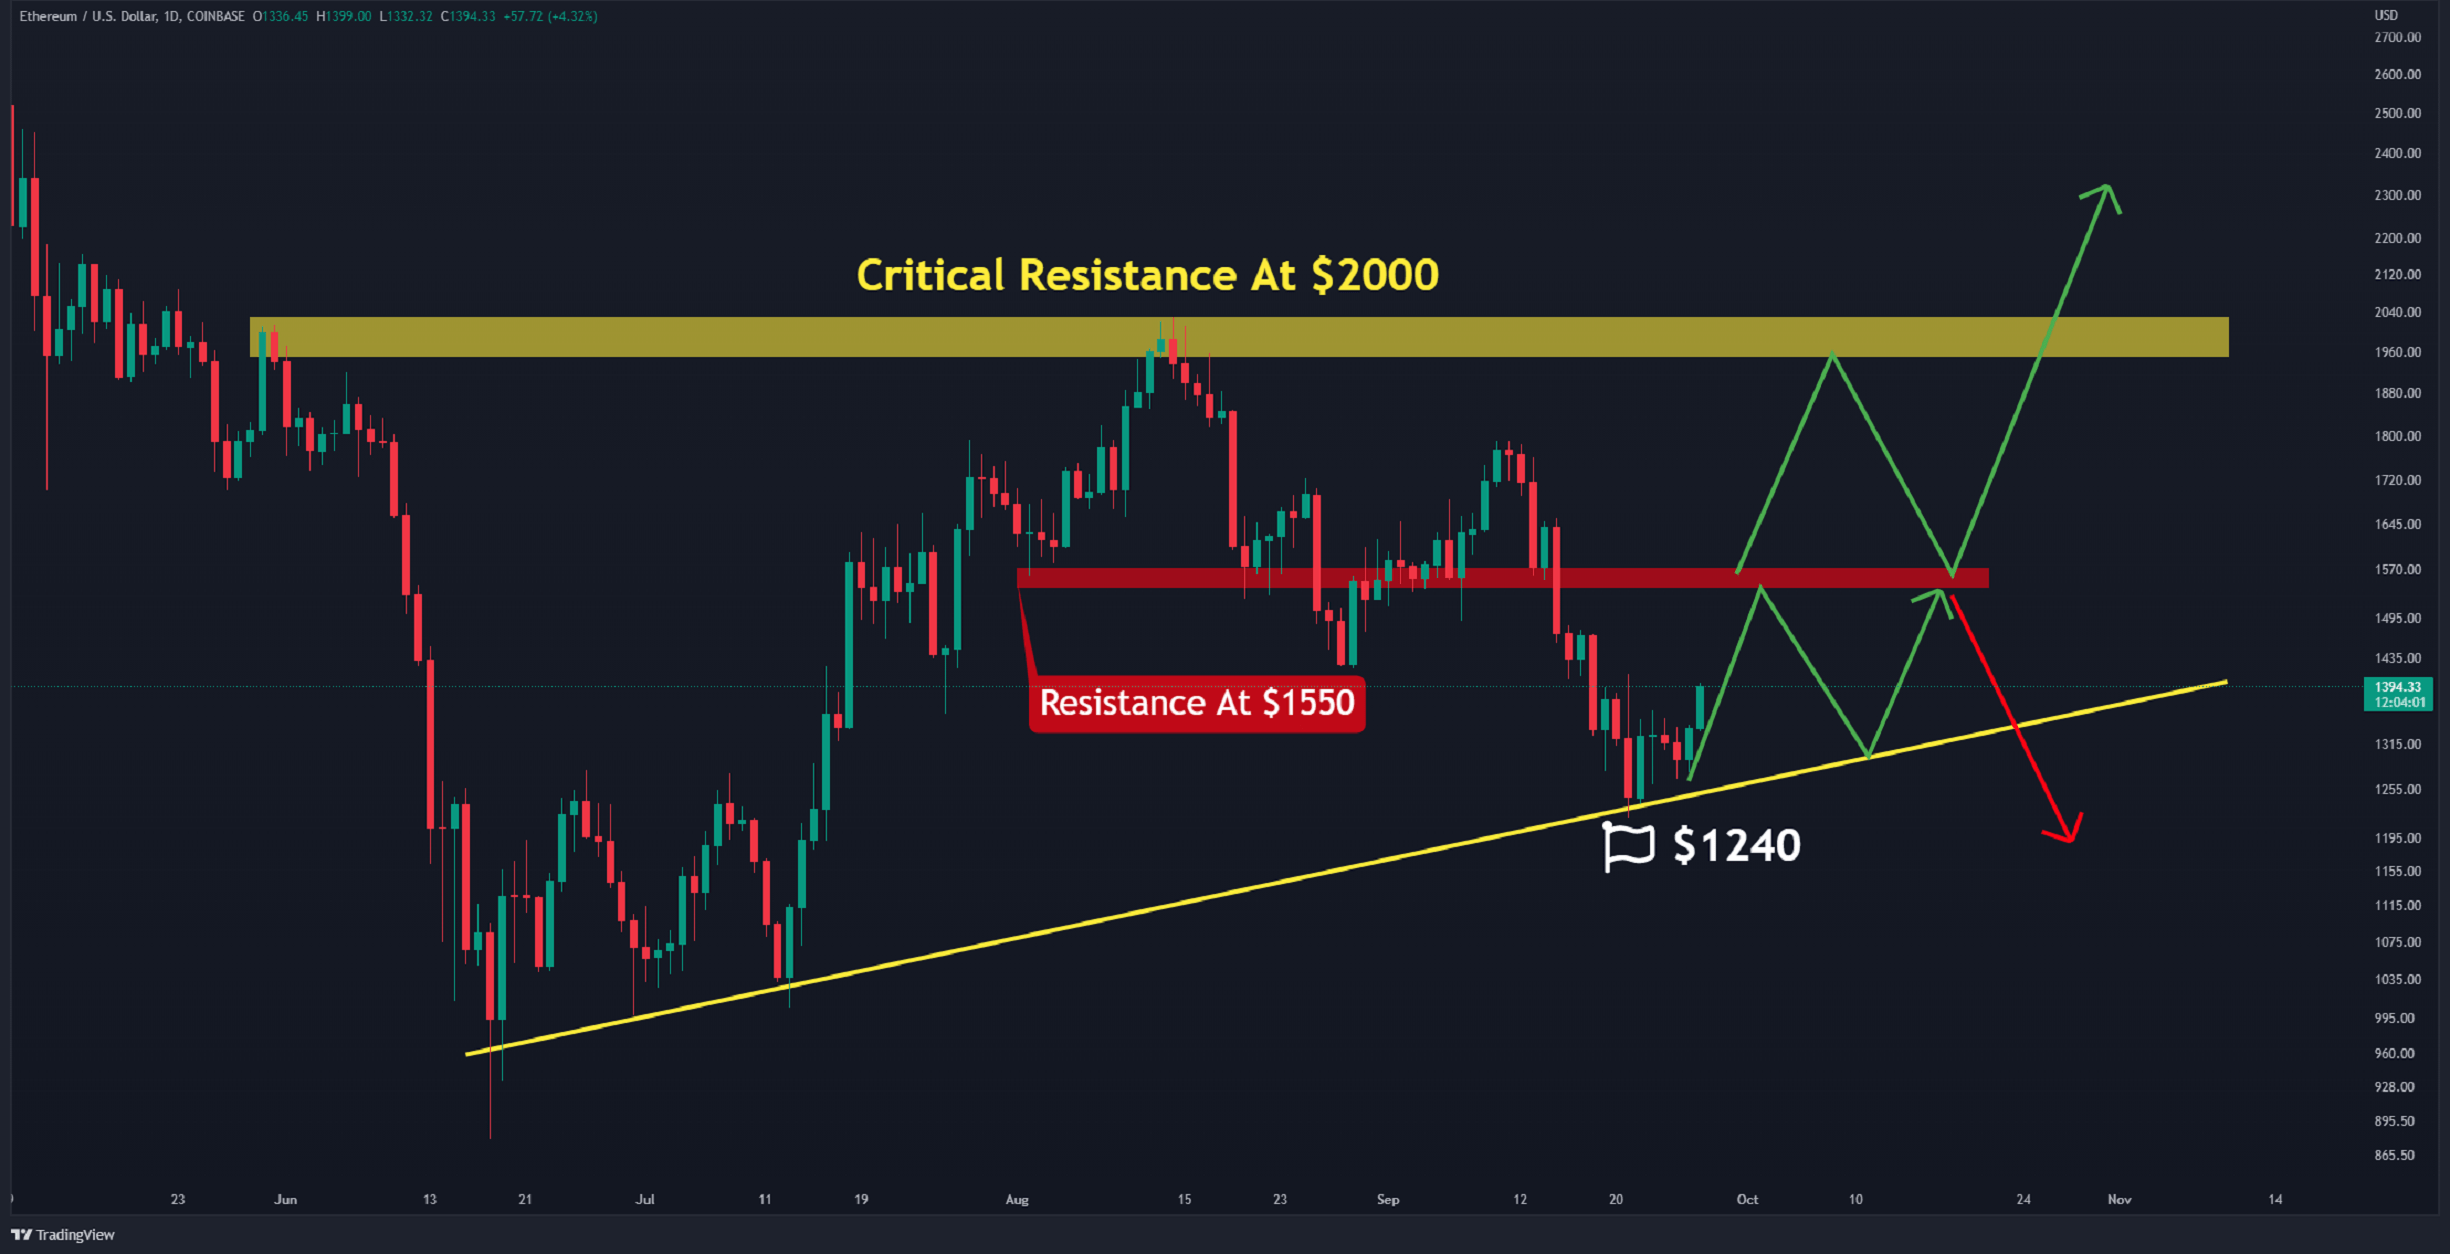
As seen below, an ascending triangle pattern (in yellow) has developed on the ETH/USDT trading pair chart. This pattern is textbook bullish (most breakouts’ direction is to the bullish side), but the price is still nowhere near breaking the top of this triangle.
The horizontal level of $1,550 (in red) has become crucial support since early August but now has become a strong resistance. This is the first significant barrier before attempting for $2000.
Assuming the price can not surpass the $1,550 mark and drops to the bottom of the triangle, the possibility of breaking to the downside increases with each attempt. Additionally, if ETH drops below $1,240, a retest of $1,000 is not out of the question.
In conclusion, the above-mentioned horizontal levels of $1,420 and $1,550 should be watched closely.
Key Support Levels: $1240 & $1000
Key Resistance Levels: $1550 & $2000
Daily Moving Averages:
MA20: $1473
MA50: $1597
MA100: $1479
MA200: $1985
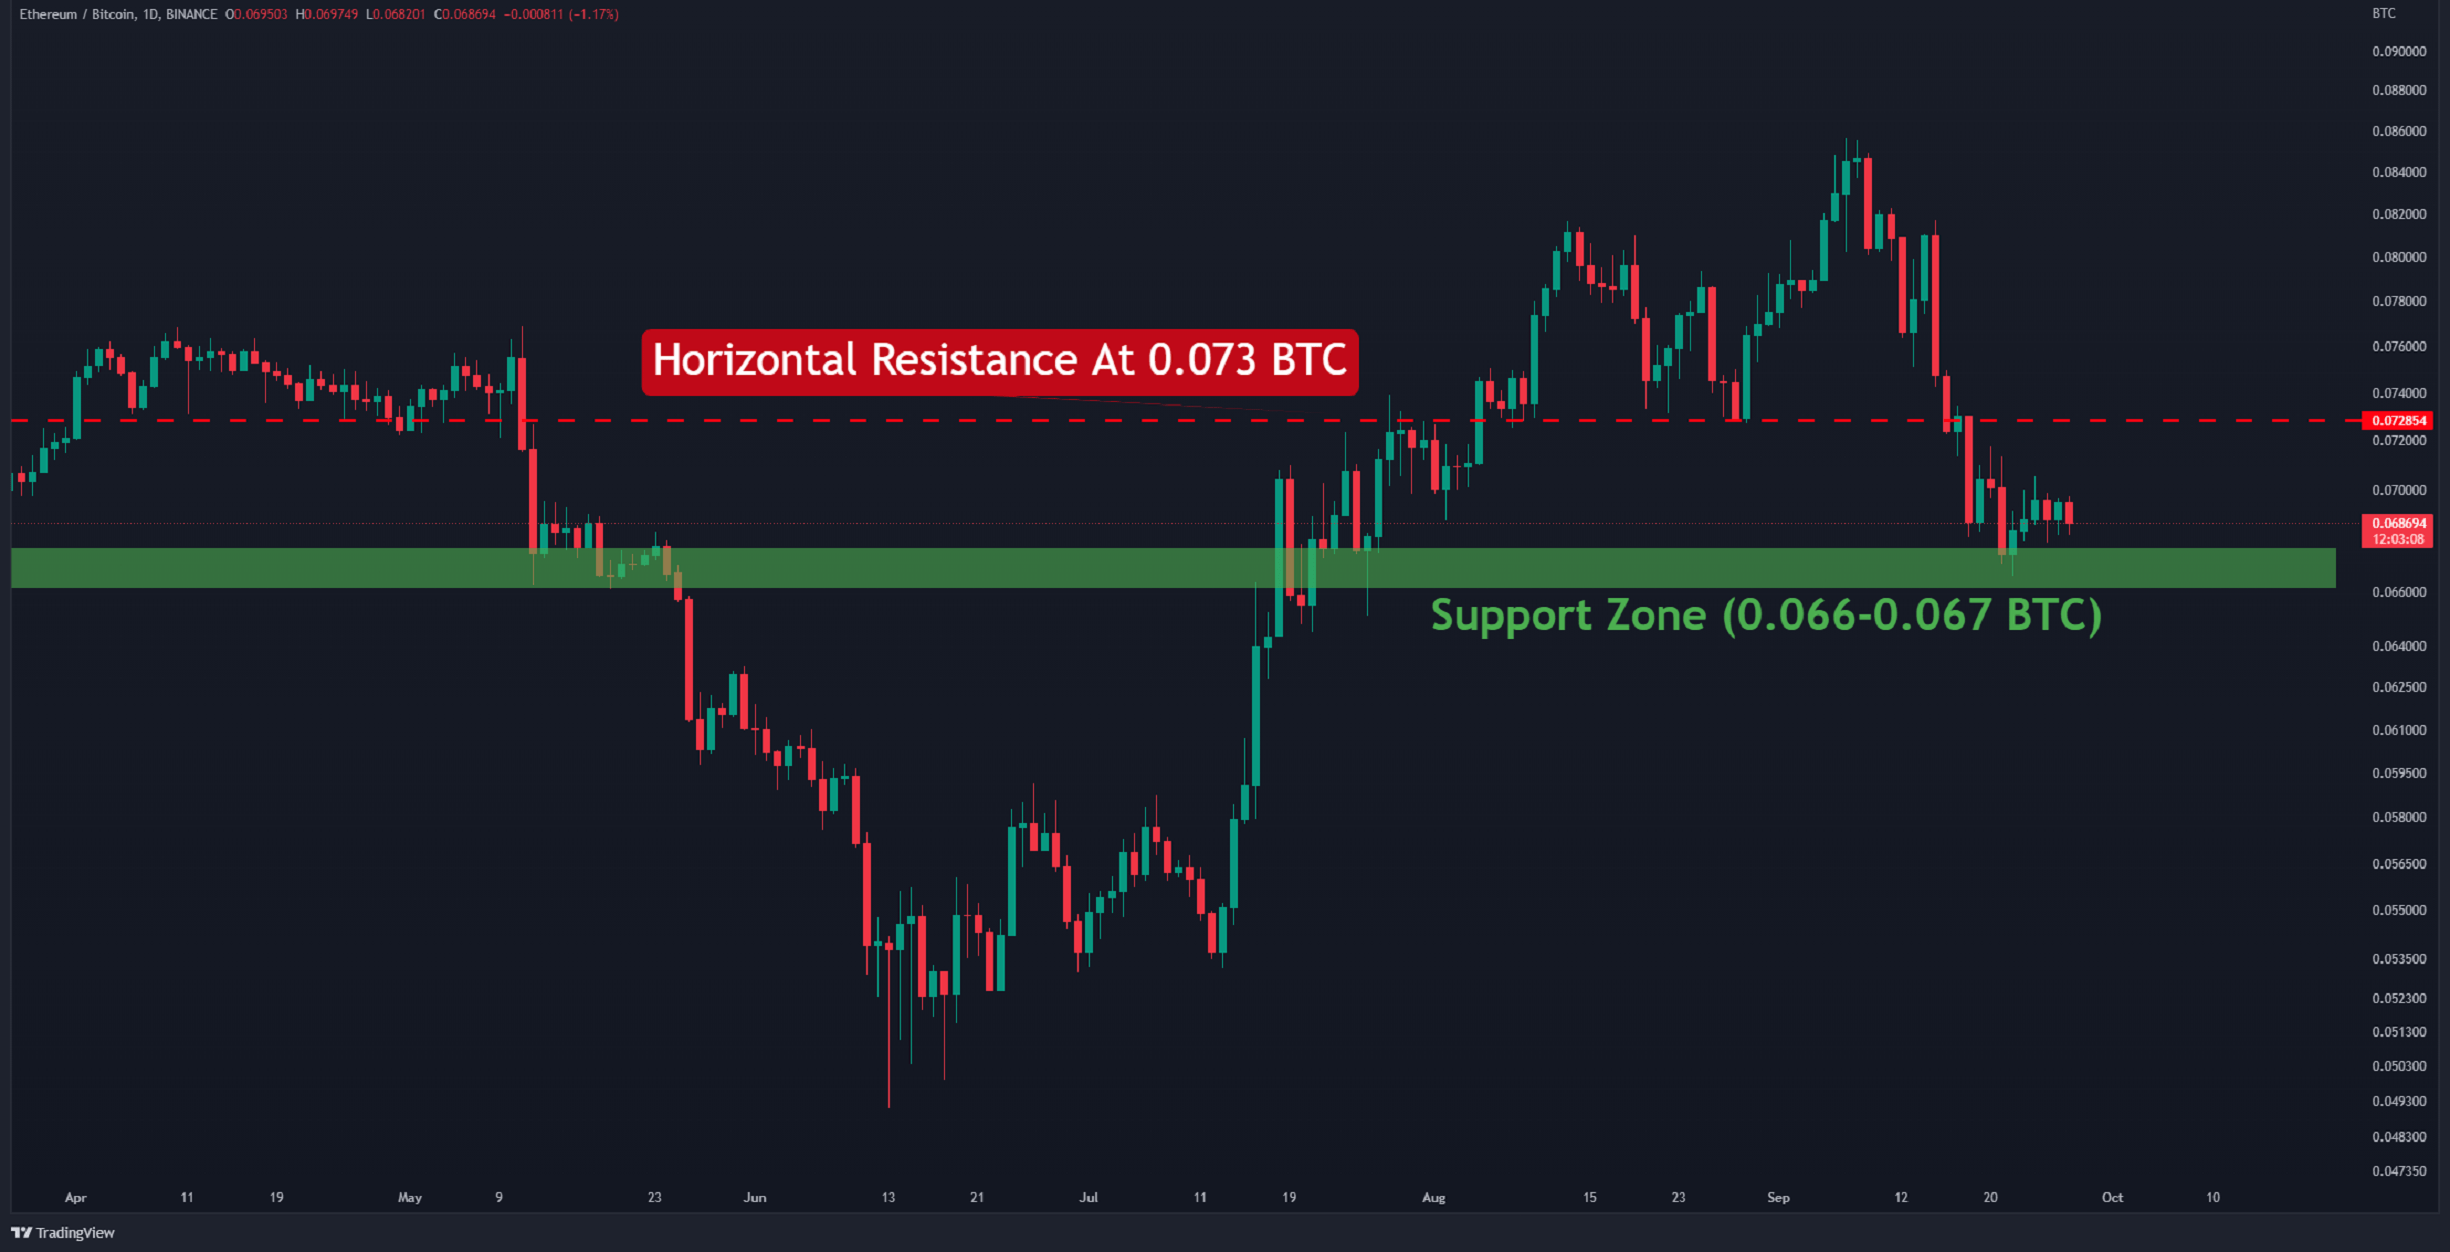
The ETH/BTC Chart
Against Bitcoin, the price action has not changed structurally over the past week. Buyers maintain the critical level of 0.066-0.067 BTC (in green). Unless ETH breaks below, another attempt to breach the horizontal barrier at 0.073 BTC is likely (marked in red).
Breaking above this level is critical since it would be interpreted as a trend reversal sign.
Key Support Levels: 0.067 & 0.065 BTC
Key Resistance Levels: 0.073 & 0.08 BTC
On-chain Analysis
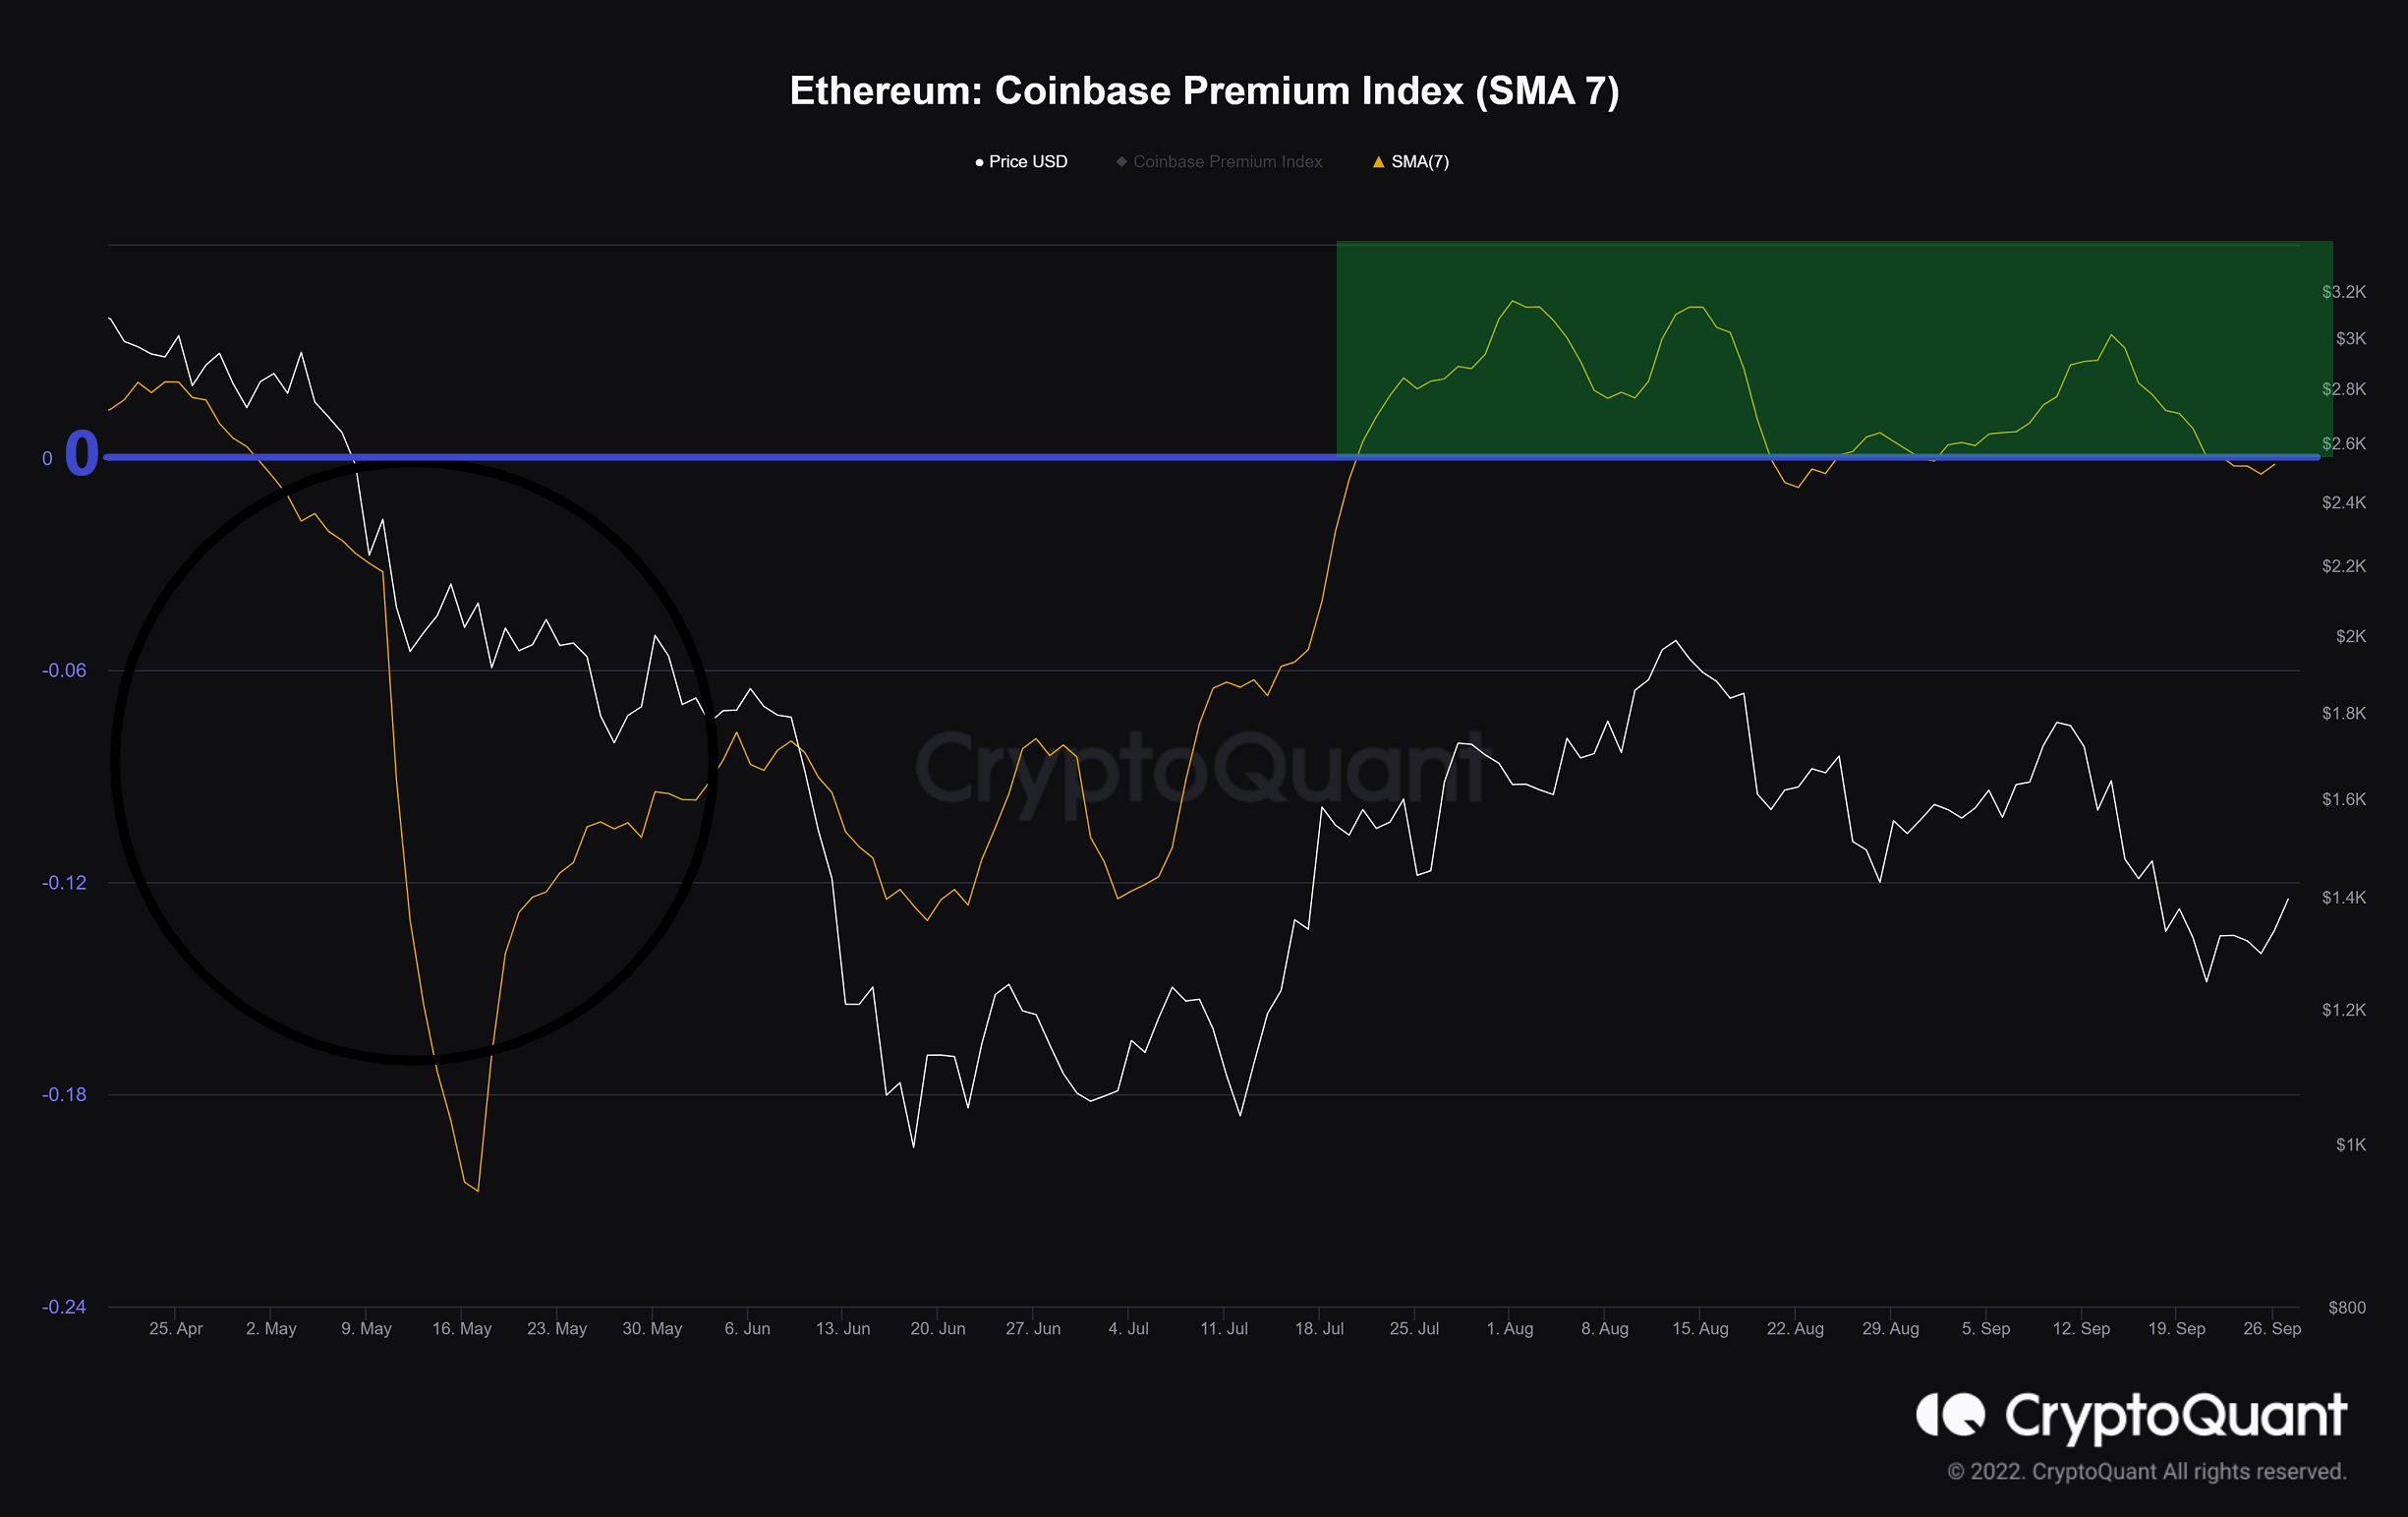
Coinbase Premium Index (SMA 7)
Definition: The differing percentages between Coinbase Pro price (USD pair) and Binance price (USDT pair). High premium values could indicate intense buying pressure on behalf of US-based investors.
As this metric rises, US investors are steadily shifting away from their feelings of doubt and uncertainty. Because USA macroeconomic data heavily influence financial markets, it is vital to analyze the movements of American traders.
This index is still below the zero line (in blue), and gaining momentum above it signals a favorable sentiment.