The crypto market continues its sharp correction, in correspondence with the global markets. Ethereum lost about 10% of its value last week and has started the first day of the week in the red. Earlier today, ETH recorded its lowest level since March 18, a five-week low. Technical analysis by Grizzly The Daily Chart On the daily timeframe, the daily MA100 (marked blue), which has been supporting ETH for the past two weeks, eventually broke down. The price is currently on top of the horizontal support at 00, the first critical support level on the daily timeframe. On the other hand, buyer takers continue to retreat (marked red). If the bulls could defend the support at 00, ETH would still have to break many important levels on its way up, support which has now turned
Topics:
CryptoVizArt considers the following as important: ETH Analysis, ETHBTC, Ethereum (ETH) Price, ethusd
This could be interesting, too:
Mandy Williams writes Ethereum Derivatives Metrics Signal Modest Downside Tail Risk Ahead: Nansen
Jordan Lyanchev writes Weekly Bitcoin, Ethereum ETF Recap: Light at the End of the Tunnel for BTC
CryptoVizArt writes Will Weak Momentum Drive ETH to .5K? (Ethereum Price Analysis)
Jordan Lyanchev writes Bybit Hack Fallout: Arthur Hayes, Samson Mow Push for Ethereum Rollback
The crypto market continues its sharp correction, in correspondence with the global markets. Ethereum lost about 10% of its value last week and has started the first day of the week in the red. Earlier today, ETH recorded its lowest level since March 18, a five-week low.
Technical analysis by Grizzly
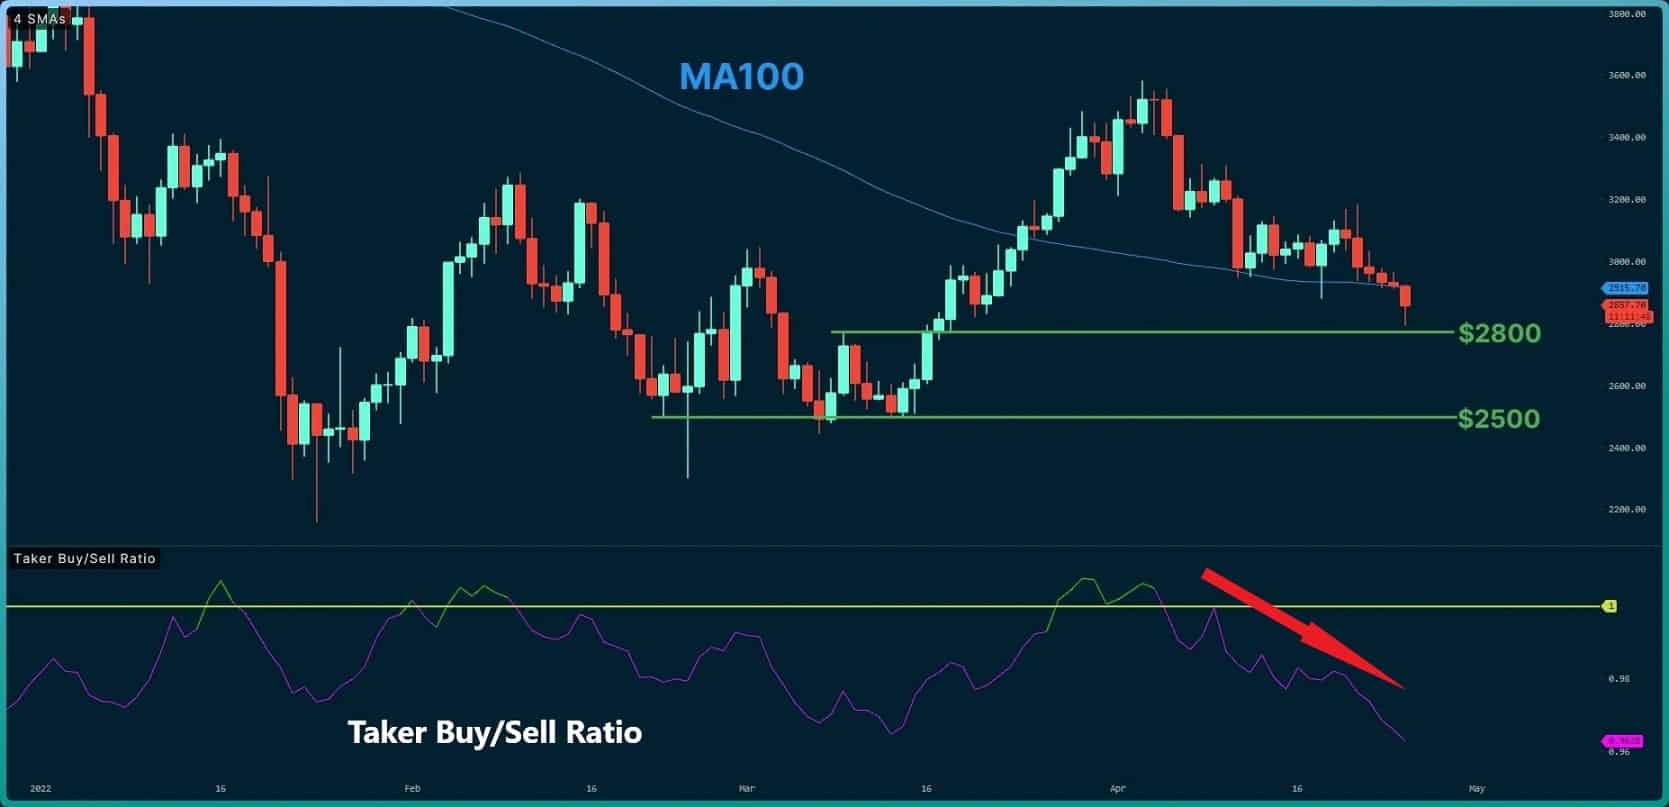
The Daily Chart
On the daily timeframe, the daily MA100 (marked blue), which has been supporting ETH for the past two weeks, eventually broke down.
The price is currently on top of the horizontal support at $2800, the first critical support level on the daily timeframe. On the other hand, buyer takers continue to retreat (marked red).
If the bulls could defend the support at $2800, ETH would still have to break many important levels on its way up, support which has now turned into resistance levels. From the bearish side, if the bears continue to control the market, the support at $2500 may be retested.
In general, the sellers seem to have the market’s control, and there are no bullish signs on the chart. We have to wait and see when buyers return to the market.
Moving Averages:
MA20: $3058
MA50: $3021
MA100: $2914
MA200: $3476
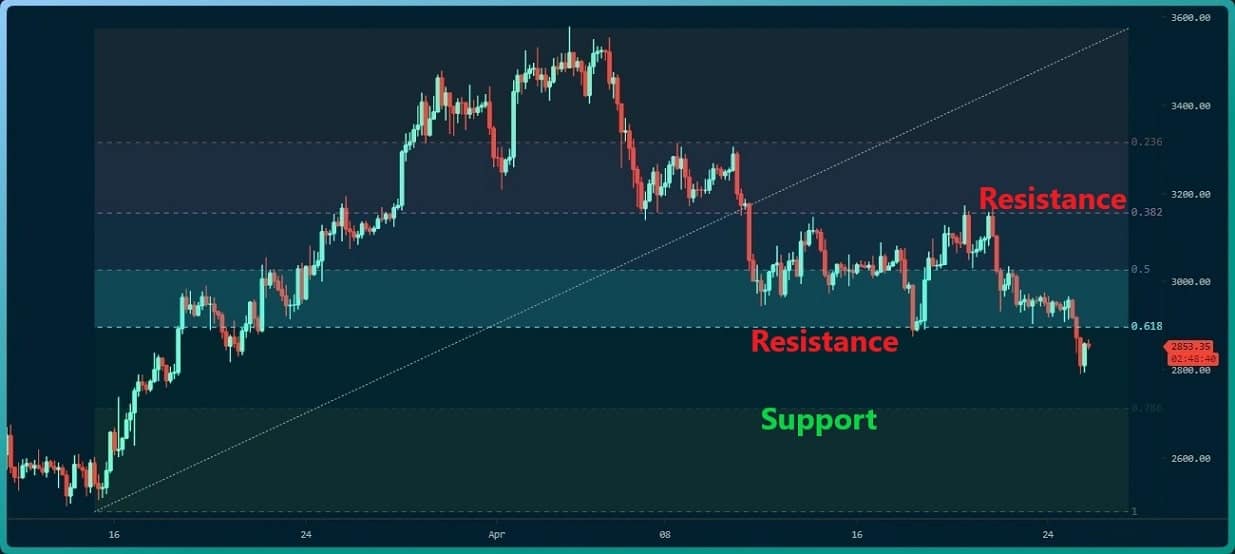
The 4-Hour Chart
On the 4-hour timeframe, the trend seems to be completely bearish. The Fib Retracement level at 0.618 is now lost, which the bulls failed to hold last week. The most crucial LTF support level in this timeframe is Fib 0.786, which lies at $2700.
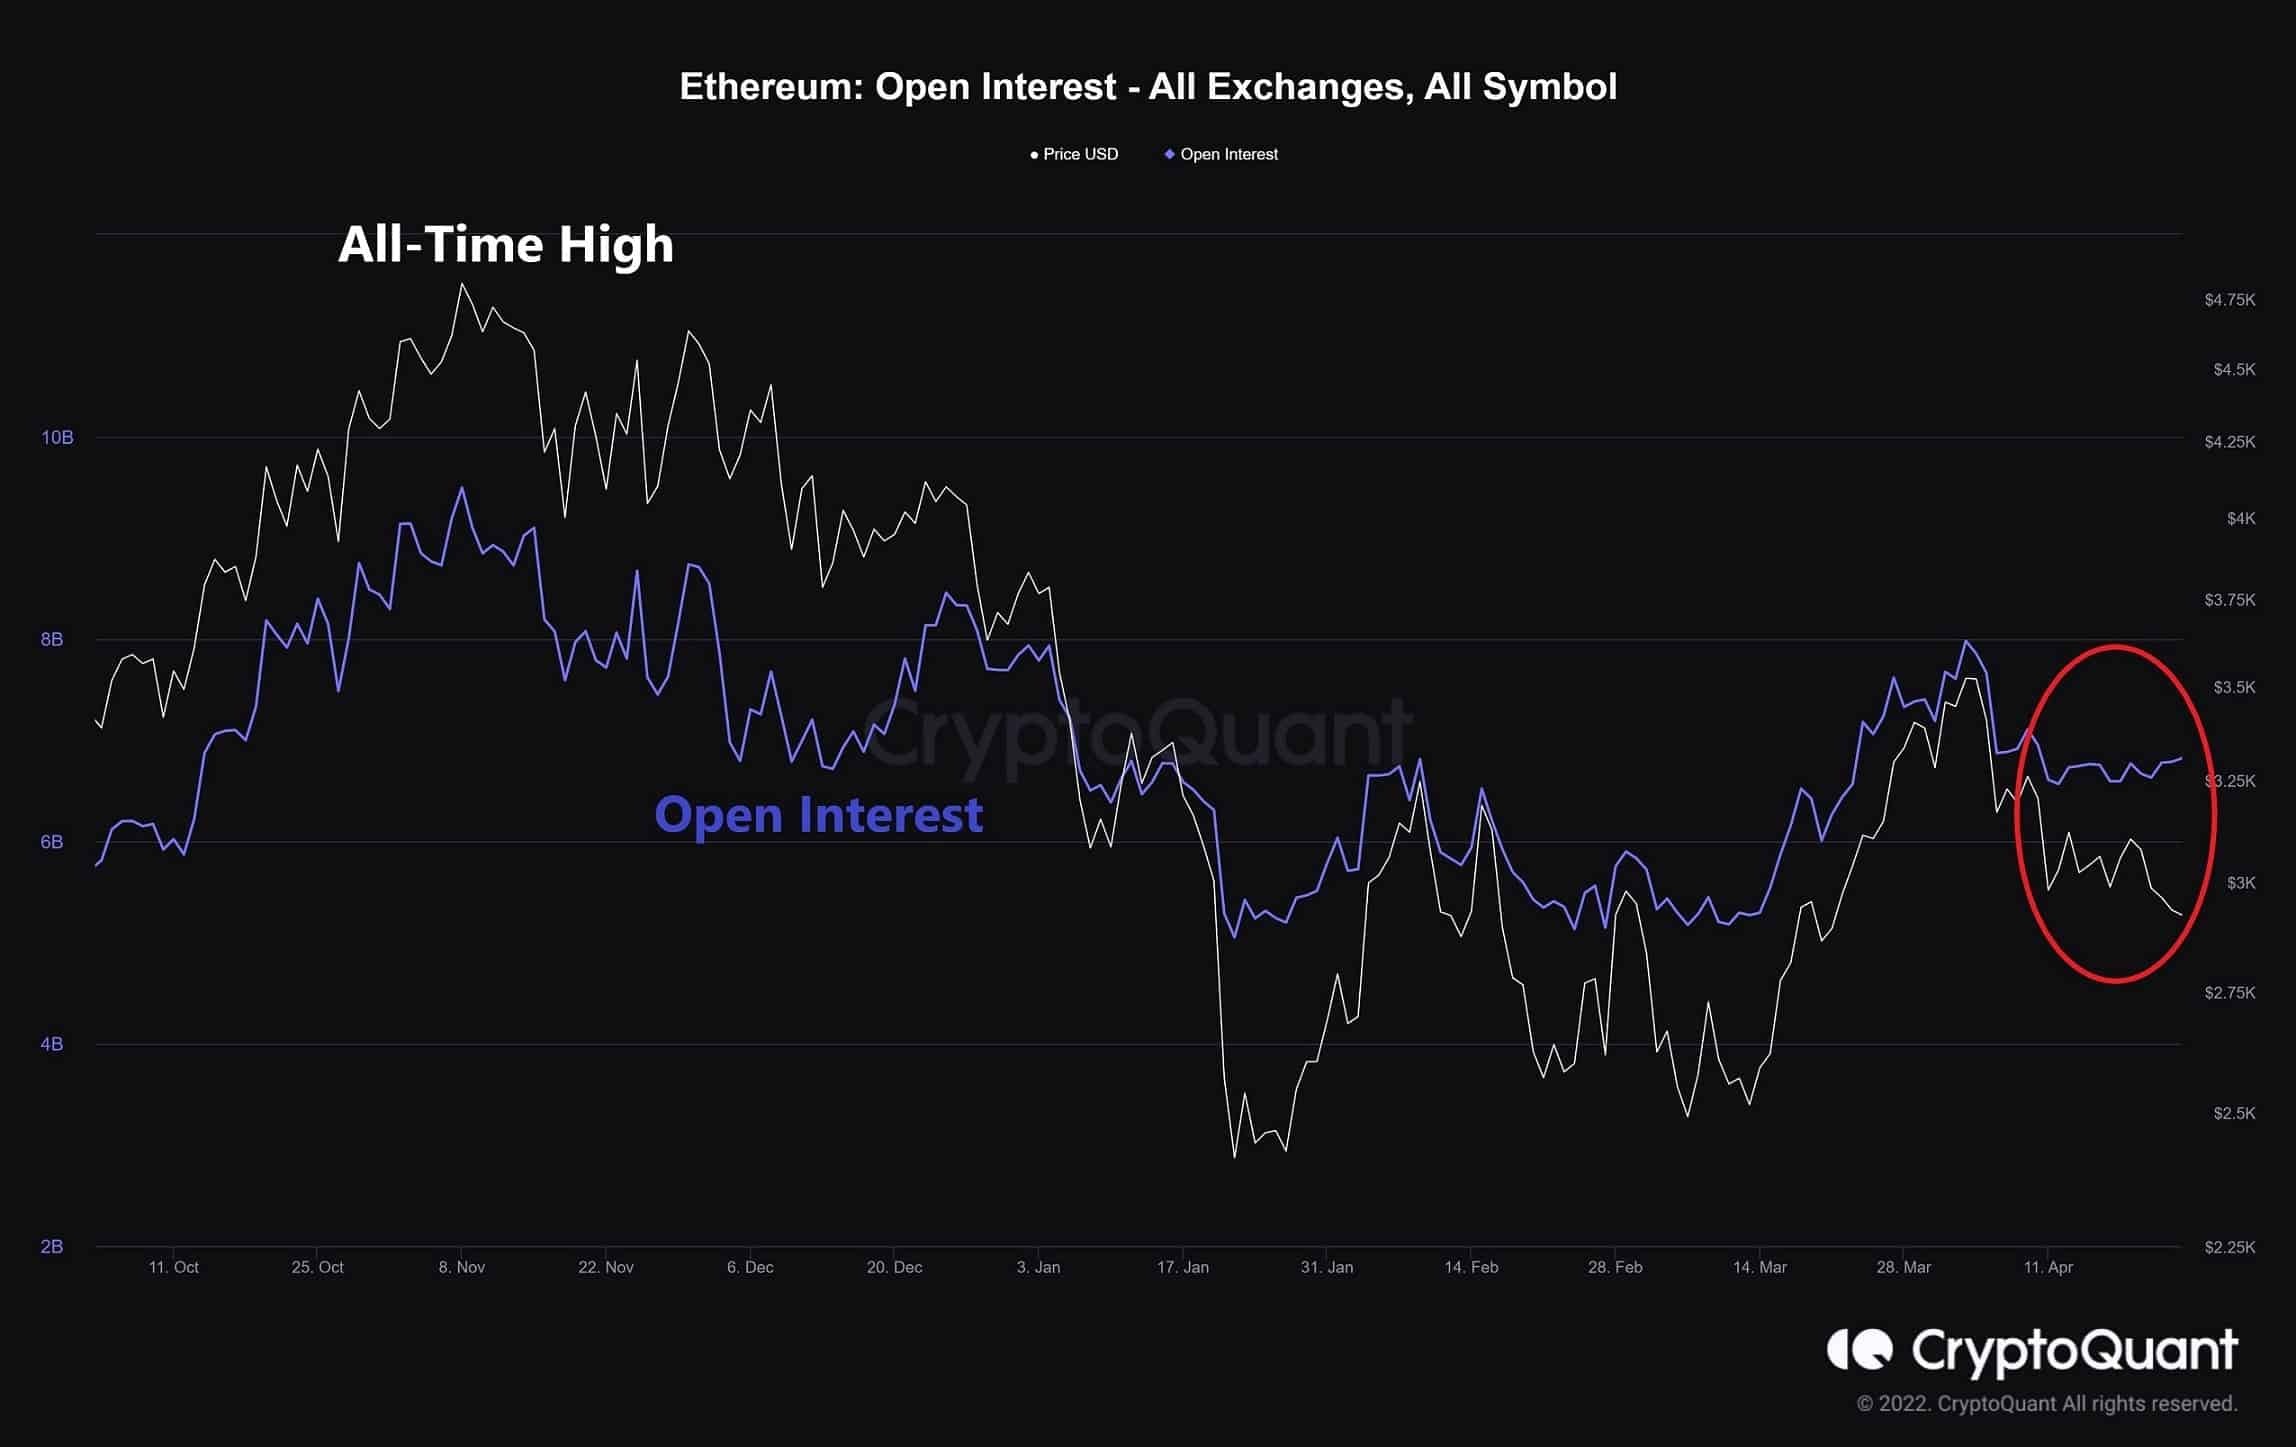
On-chain Analysis: Open Interest
Open Interest is defined as the number of open positions on derivative exchanges, including both long and short positions.
As Open Interest (OI) increases, more liquidity, volatility, and attention are coming into the derivative markets. As Open Interest (OI) decreases, traders are closing futures positions.
In turn, this might trigger the possibility of a long/short-squeeze caused by sudden price movement or vice versa.
As shown in the following chart, the Open interest has increased despite the price decrease, which is unprecedented in recent months and is likely to cause significant volatility in the short term.