Fear dominates the crypto market, following six weeks in the red. Many large caps have lost their long-term support, and ETH is one of them after reaching its lowest level since February 24, the day of the invasion. Technical Analysis Technical Analysis By Grizzly The Daily Chart The Delta Volume of both Binance futures and FTX perpertuals evaluates the behavior of buyers and seller takers in the market. When green histograms are witnessed, it is interpreted that buyer takers are in control and buy aggressively, and we can expect the price to increase. Of course, histograms’ length and sequence must also be taken into account. In the previous two bullish uptrends, it can be seen that the buyer takers had a higher hand on the support levels and pushed the price up. Over the
Topics:
CryptoVizArt considers the following as important: ETH Analysis, ETHBTC, Ethereum (ETH) Price, ethusd
This could be interesting, too:
Mandy Williams writes Ethereum Derivatives Metrics Signal Modest Downside Tail Risk Ahead: Nansen
Jordan Lyanchev writes Weekly Bitcoin, Ethereum ETF Recap: Light at the End of the Tunnel for BTC
CryptoVizArt writes Will Weak Momentum Drive ETH to .5K? (Ethereum Price Analysis)
Jordan Lyanchev writes Bybit Hack Fallout: Arthur Hayes, Samson Mow Push for Ethereum Rollback
Fear dominates the crypto market, following six weeks in the red. Many large caps have lost their long-term support, and ETH is one of them after reaching its lowest level since February 24, the day of the invasion.
Technical Analysis
Technical Analysis By Grizzly
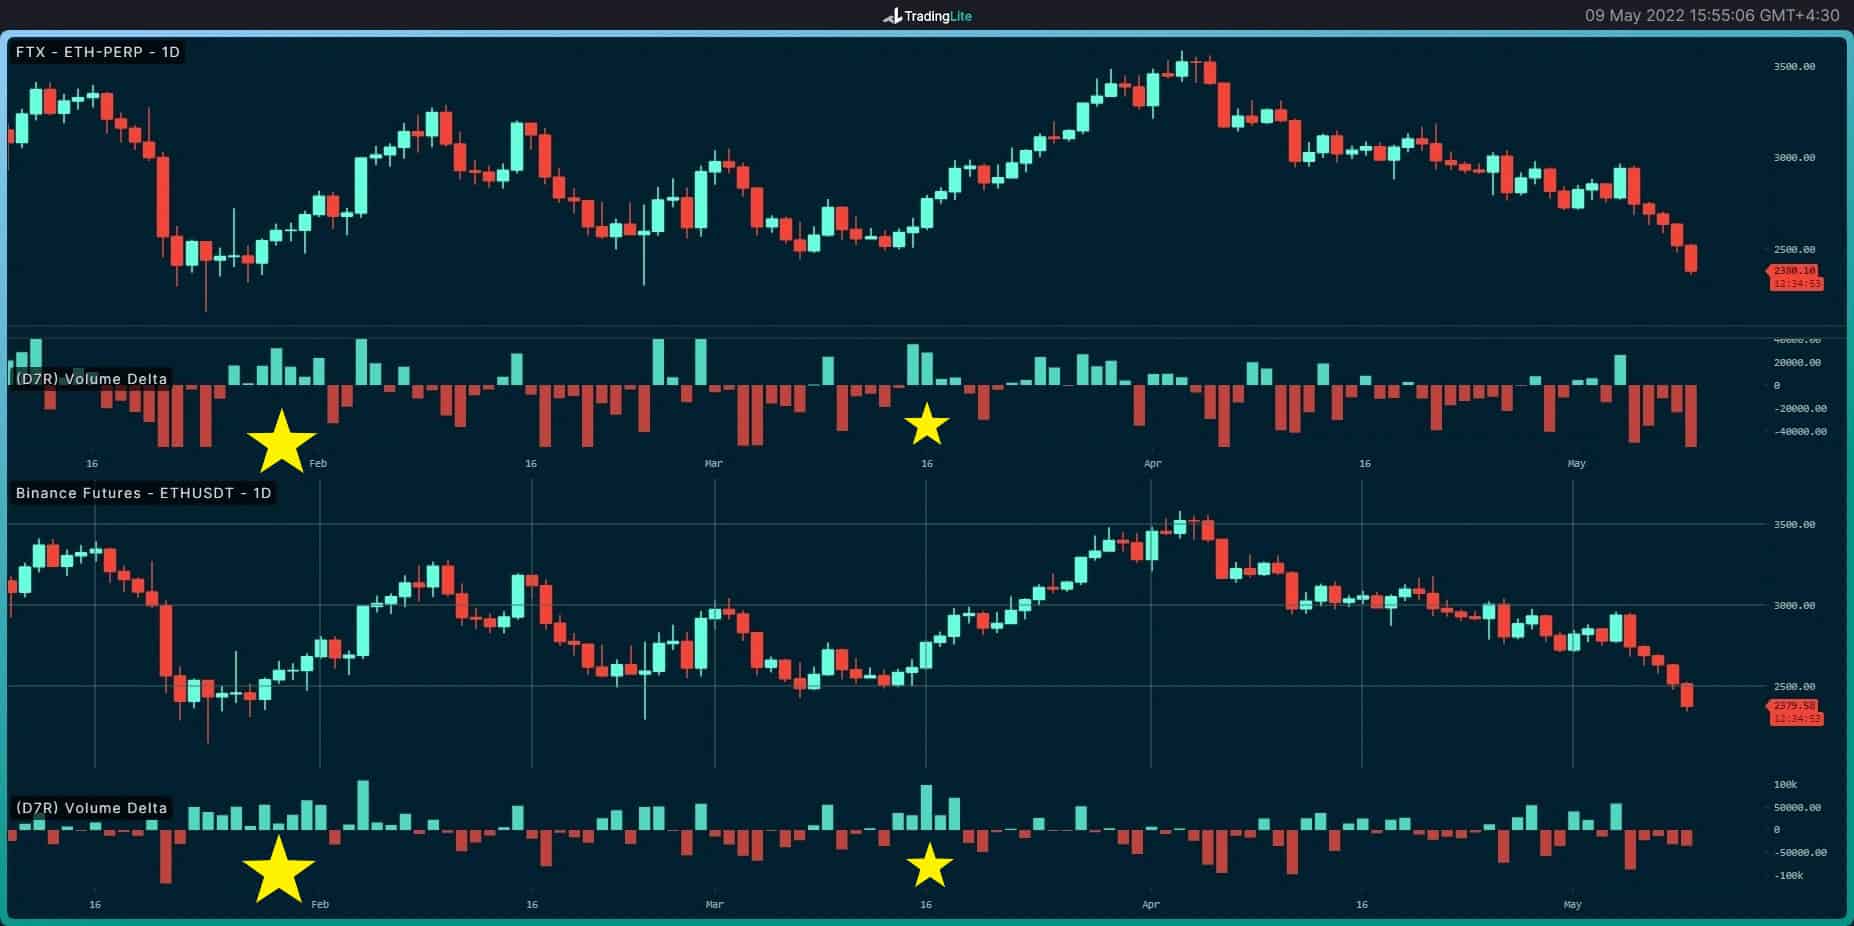
The Daily Chart
The Delta Volume of both Binance futures and FTX perpertuals evaluates the behavior of buyers and seller takers in the market.
When green histograms are witnessed, it is interpreted that buyer takers are in control and buy aggressively, and we can expect the price to increase. Of course, histograms’ length and sequence must also be taken into account.
In the previous two bullish uptrends, it can be seen that the buyer takers had a higher hand on the support levels and pushed the price up. Over the last month, the buyer takers did not have much power, however, we have to wait and see whether they will take control of the market in the coming days or whether the sellers will continue to dominate it.
Key Support Levels: $2300 & $2150
Key Resistance Levels: $2500 & $2700
Moving Averages:
MA20: $2822
MA50: $3043
MA100: $2919
MA200: $3408
The 4-Hour Chart
On the 4-hour timeframe, ETH is close to support amid the marked-green descending line. The price may face another leg down towards the $2300 level in the short term, entering the oversold zone. However, you should keep in mind that the reversal of the trend will be confirmed if the price can form at least a higher high and low.

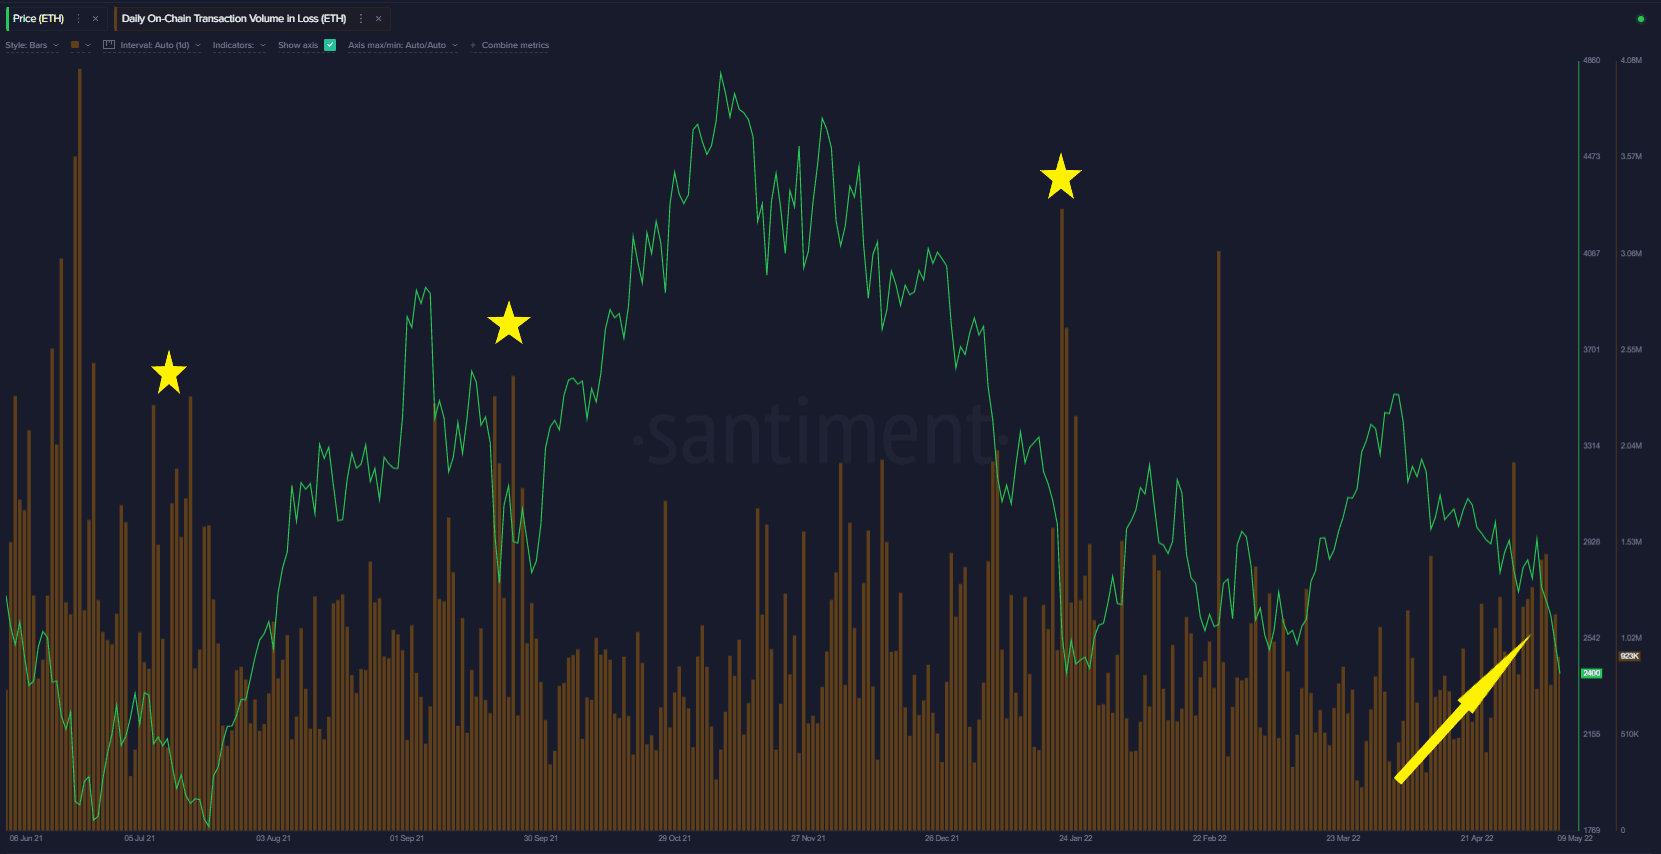
On-chain Analysis
Daily on-chain transaction volume in loss: This metric indicates the aggregate amount of coins across all transactions on the network that moved in the loss.
When this metric moves up, it indicates that investors are capitulating. This is usually considered an opportunity to buy-in.
However, the capitulation phase has not yet happened as it did in the past bear markets. Also, liquidated long positions volume has not yet reached levels as before, so there is no certainty that the necessary liquidity has been absorbed to initiate a possible uptrend.