After the DXY index rebounded off the support at 104, the crypto market entered a correction phase. In the past few days, Ethereum experienced an uptrend after touching ,523 on August 20 and rallied today as new updates on the Merge were announced. Can the bulls reclaim ,000? Technical Analysis By Grizzly The Daily Chart On the daily time frame, buyers have stepped up. Defending the support at ,500 caused the bears to pull back a bit. Now, the buyers have to flip the resistance zone in the range of 00 to 00(in blue) to continue the upwards trend. On the other hand, the DXY index (in orange) recently hit the resistance of the last high at 109 (in yellow). If this level cracks, then the probability of reclaiming 00 on the Ethereum chart will likely weaken. On
Topics:
CryptoVizArt considers the following as important: ETH Analysis, ETHBTC, Ethereum (ETH) Price, ethusd
This could be interesting, too:
Mandy Williams writes Ethereum Derivatives Metrics Signal Modest Downside Tail Risk Ahead: Nansen
Jordan Lyanchev writes Weekly Bitcoin, Ethereum ETF Recap: Light at the End of the Tunnel for BTC
CryptoVizArt writes Will Weak Momentum Drive ETH to .5K? (Ethereum Price Analysis)
Jordan Lyanchev writes Bybit Hack Fallout: Arthur Hayes, Samson Mow Push for Ethereum Rollback
After the DXY index rebounded off the support at 104, the crypto market entered a correction phase. In the past few days, Ethereum experienced an uptrend after touching $1,523 on August 20 and rallied today as new updates on the Merge were announced. Can the bulls reclaim $2,000?
Technical Analysis
By Grizzly
The Daily Chart
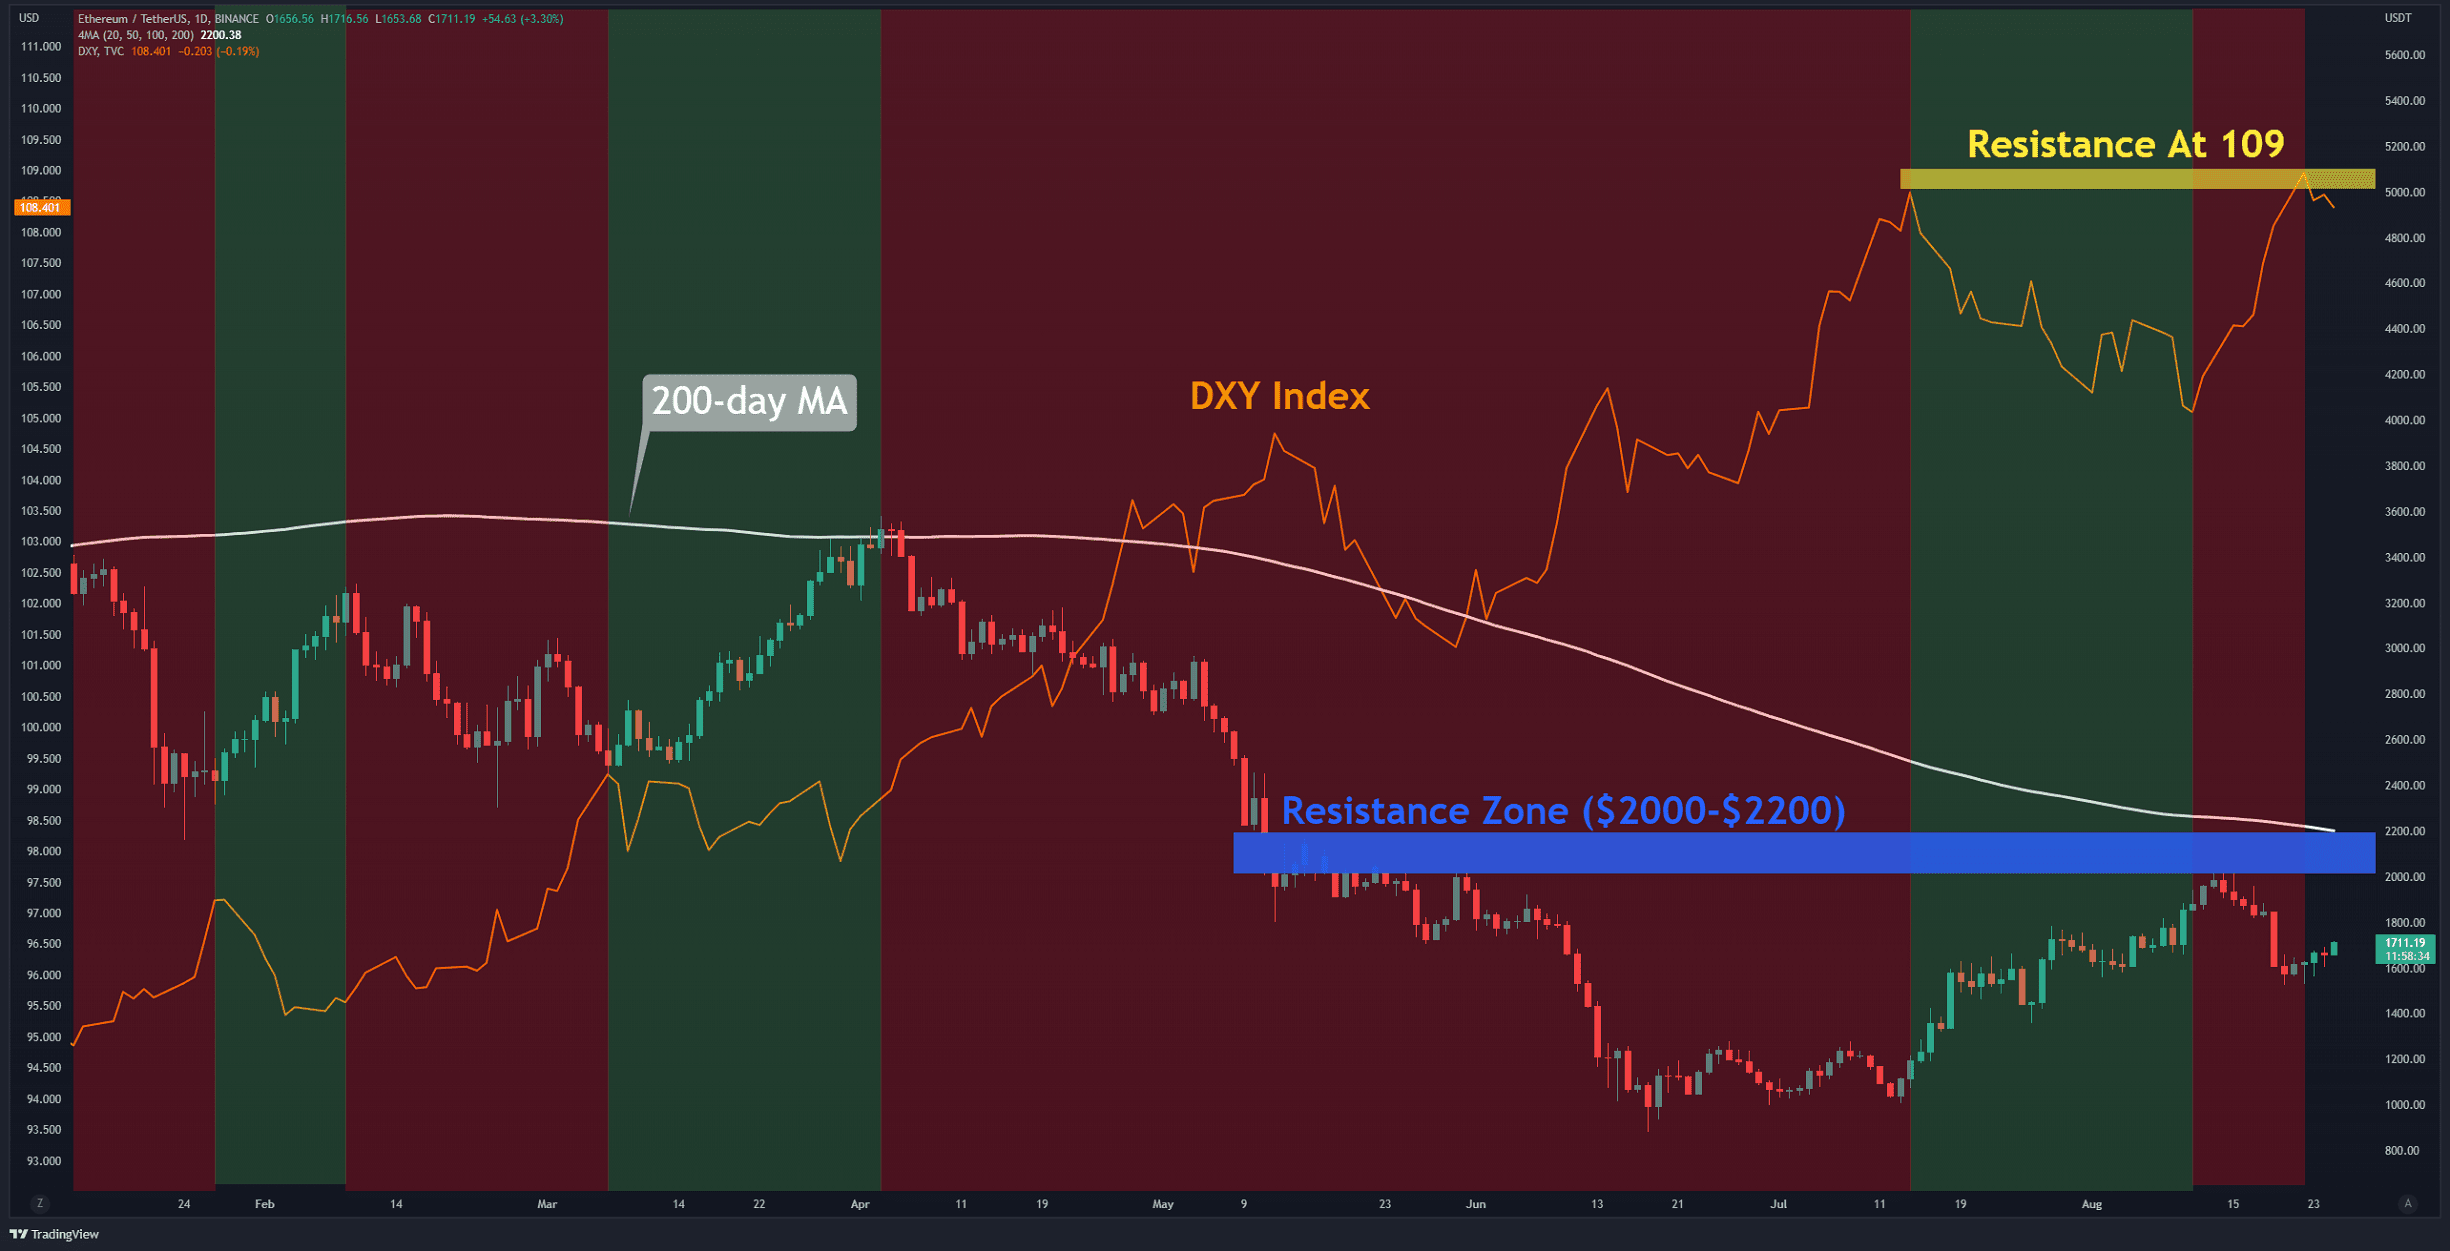
On the daily time frame, buyers have stepped up. Defending the support at $1,500 caused the bears to pull back a bit. Now, the buyers have to flip the resistance zone in the range of $2000 to $2200(in blue) to continue the upwards trend.
On the other hand, the DXY index (in orange) recently hit the resistance of the last high at 109 (in yellow). If this level cracks, then the probability of reclaiming $2000 on the Ethereum chart will likely weaken. On previous occasions, ETH’s price decreased when the DXY index experienced a bullish rally.
Key Support Levels: $1500 & $1350
Key Resistance Levels: $1800 & $2000
Daily Moving Averages:
MA20: $1769
MA50: $1581
MA100: $1540
MA200: $2200
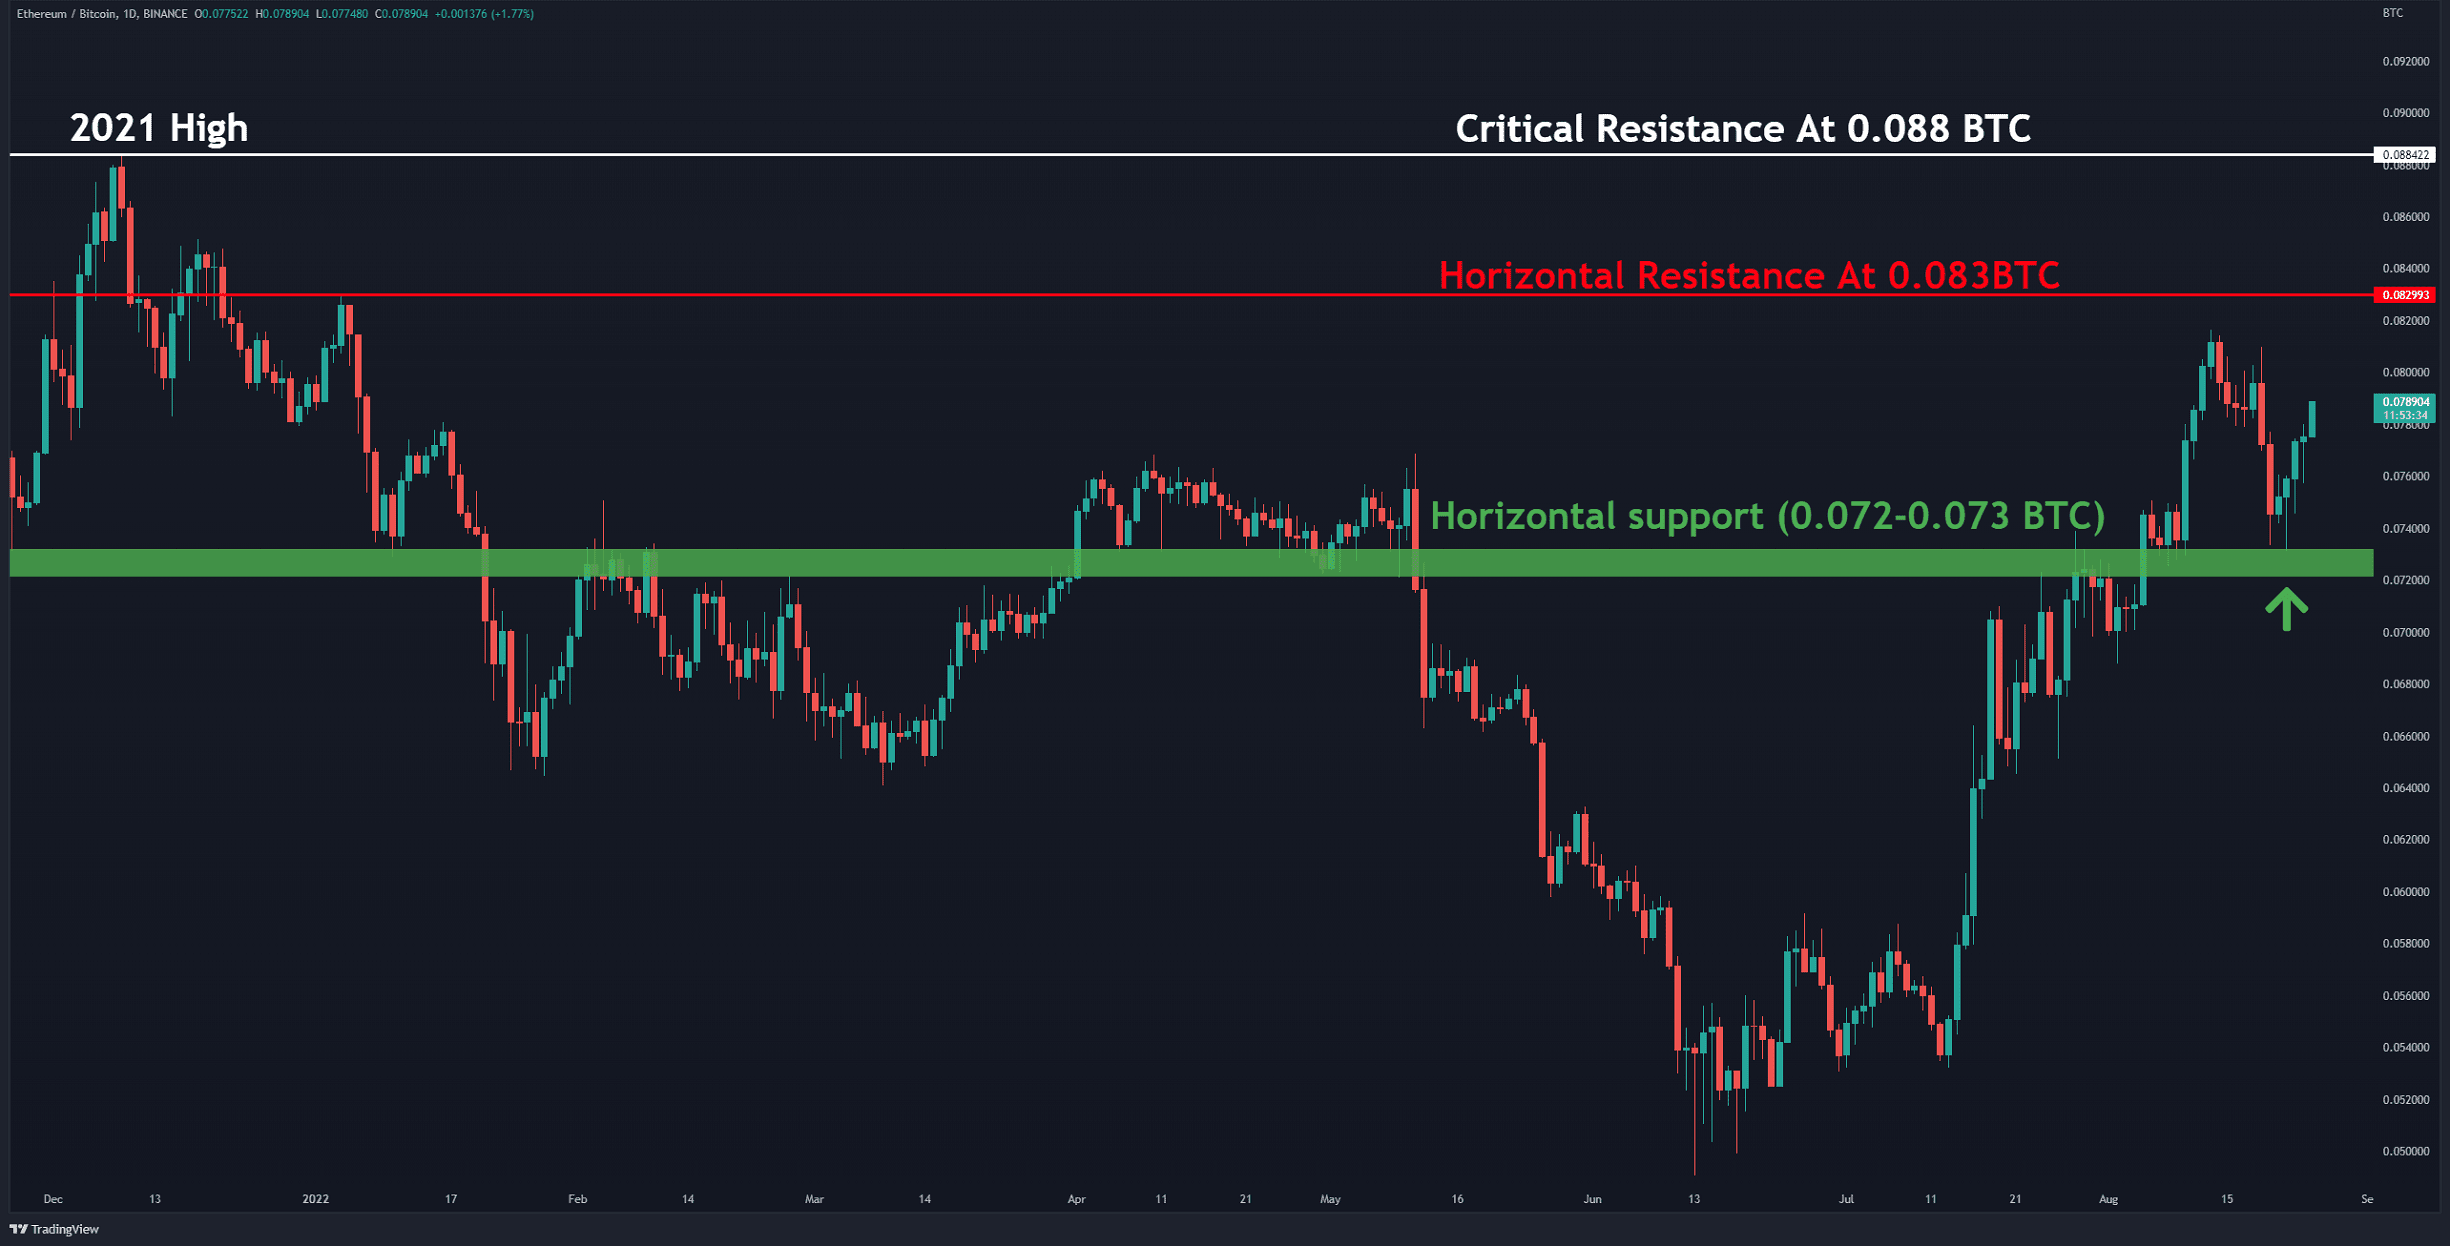
The ETH/BTC Chart
Against Bitcoin, the bulls have had the upper hand over the past few days. They defended the horizontal support in the range of 0.072-0.073 BTC (in green). This means that the price remains bullish for the time being as a lower low was yet not formed.
Considering the proximity of the Merge event, more investors probably prefer to dump their BTC for Ethereum. In this case, touching the horizontal resistance at 0.083 BTC (in red) will not be out of reach. If the transition from PoW to PoS is successful, then the price of Ethereum against Bitcoin has the chance to reach the highest level recorded in 2021 (0.088 BTC).
Key Support Levels: 0.0.073 & 0.065 BTC
Key Resistance Levels: 0.083 & 0.088 BTC
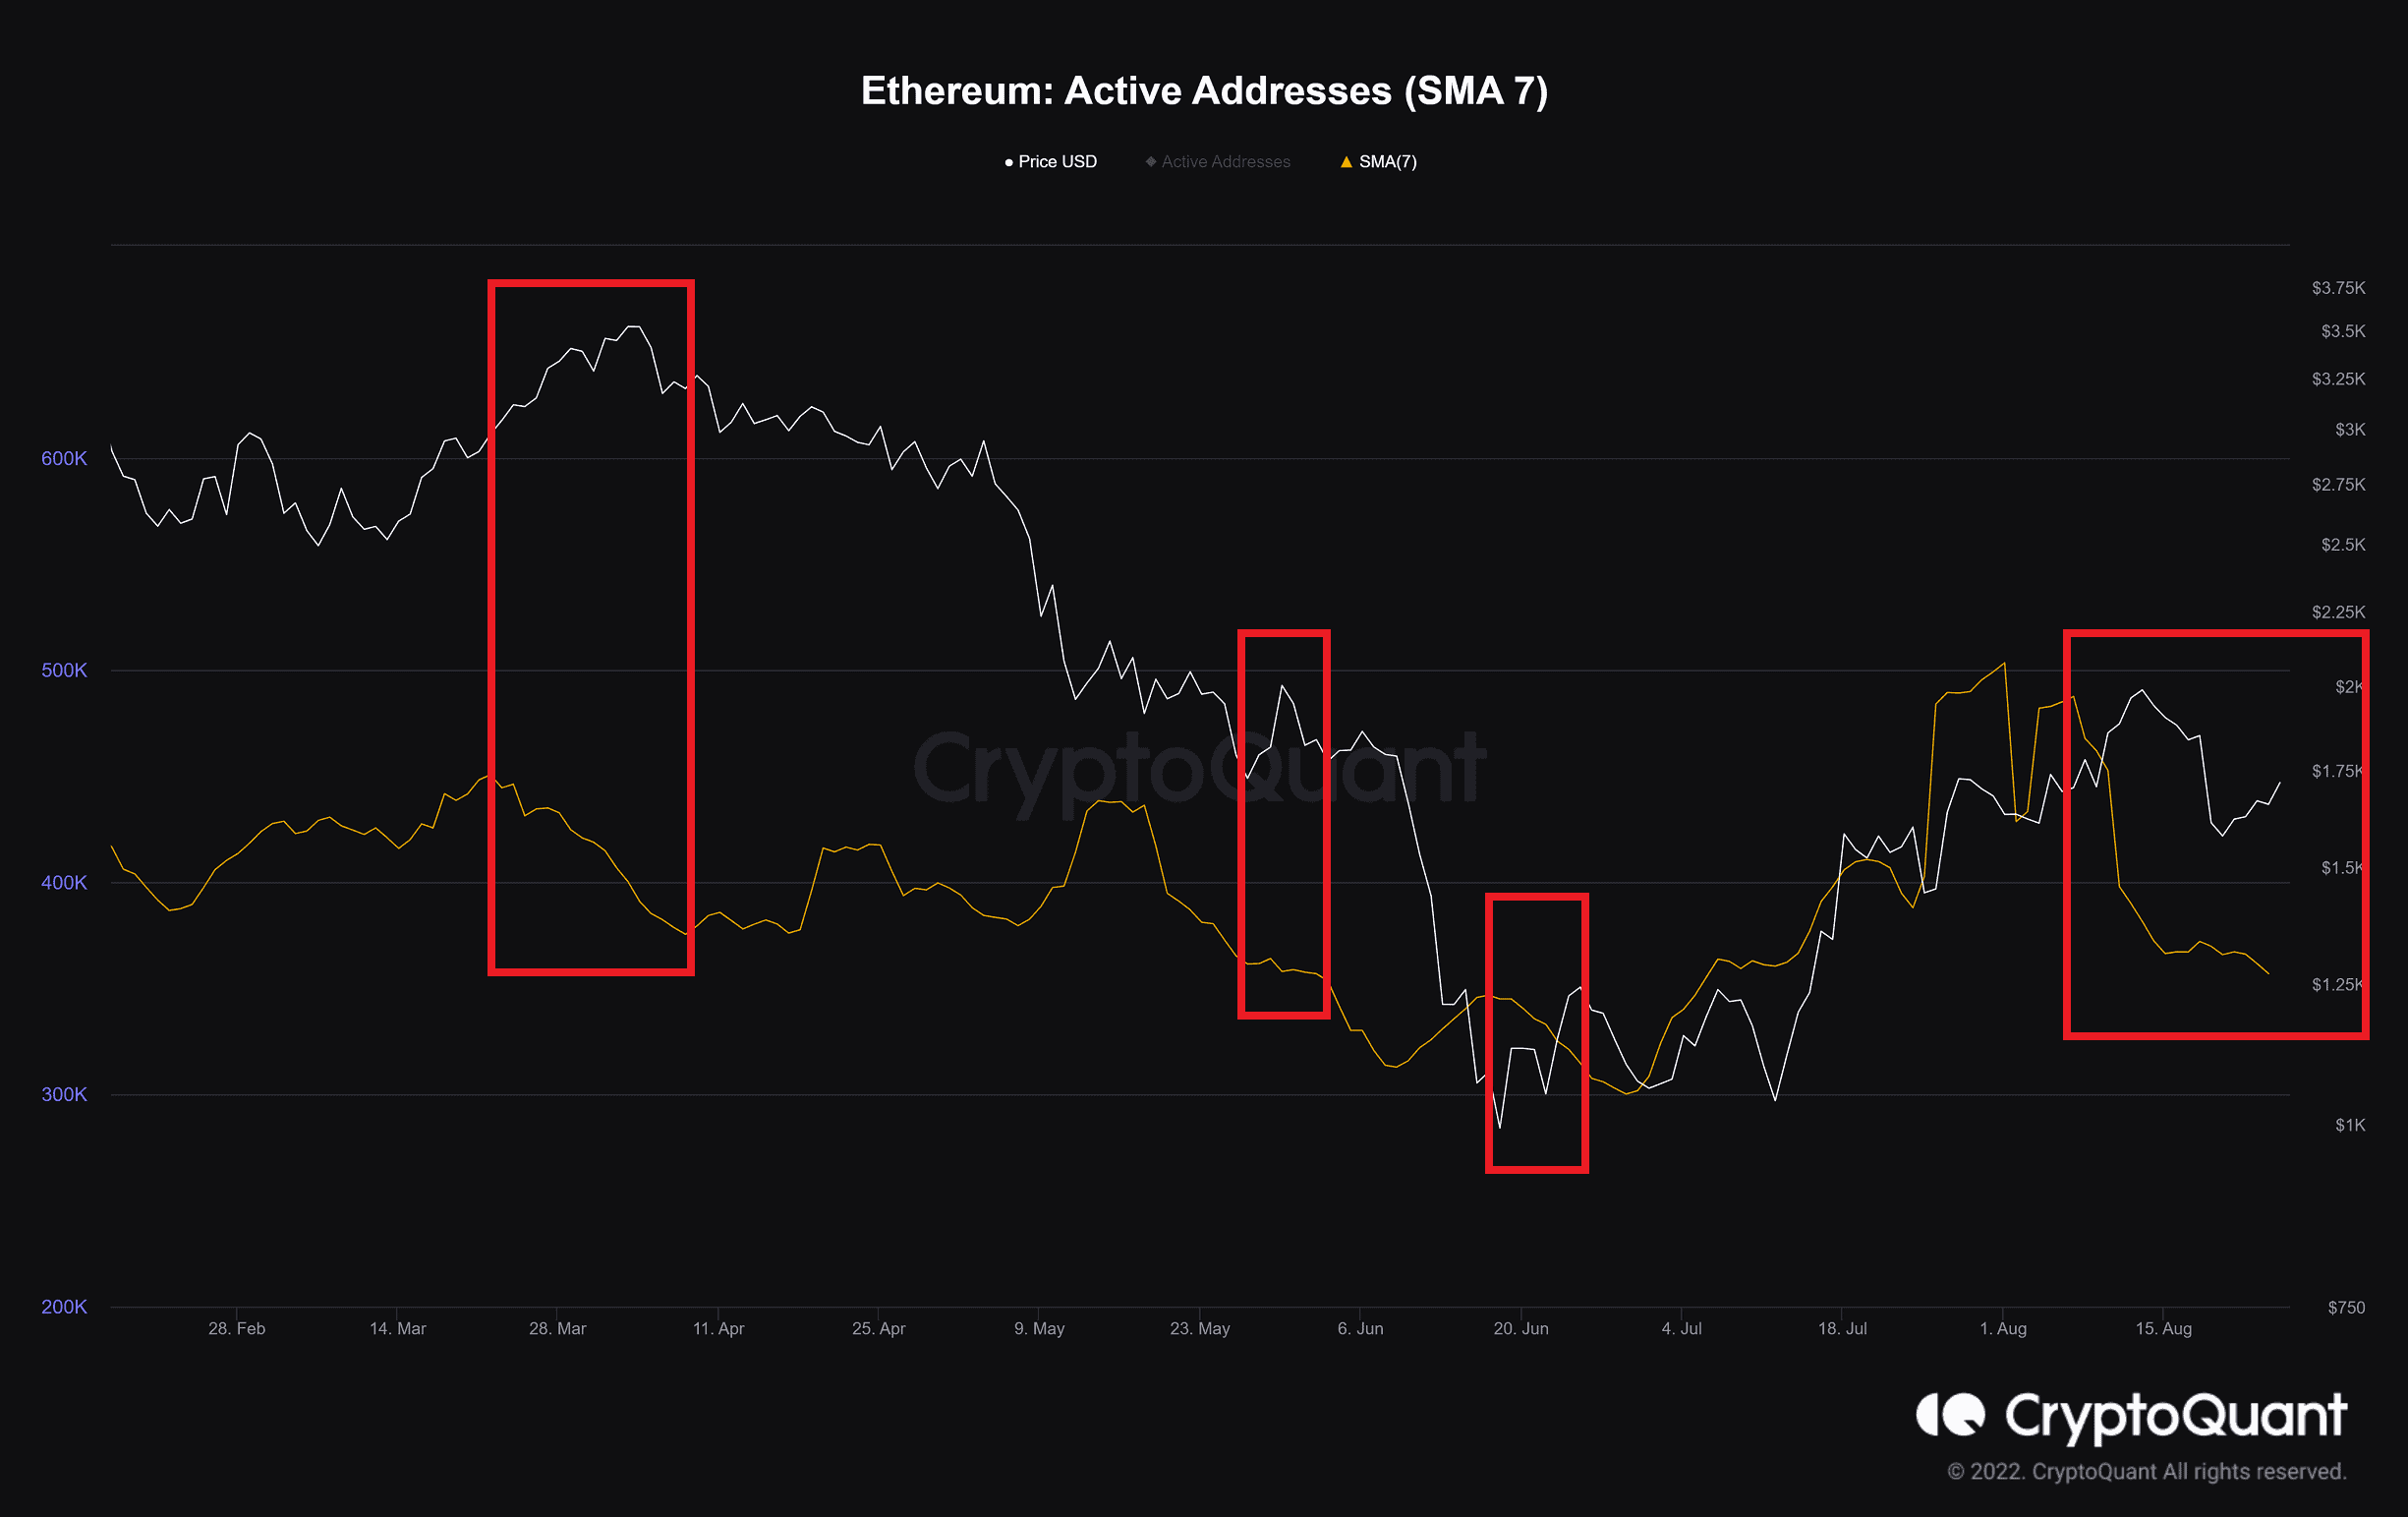
On-chain Analysis
Active Addresses (SMA 7)
Definition: The total number of unique active addresses, inclusive of senders and receivers.
On-chain activity shows that investors are slightly wary of the recent upward trend over the past few days. This is probably related to the special attention that traders pay to macroeconomic data these days. As marked in red on the chart, whenever the price increase is not accompanied by the growth of active addresses, ETH has failed to reach higher levels.