It has been 51 days since Ethereum experienced a significant crash and dropped to a new yearly low of .1K. Meanwhile, the price has been stuck in a price range between .1K and .3K. Further consolidation in the mentioned range would be the most likely scenario in the upcoming days. Technical Analysis By Shayan The Daily Chart Ethereum faces a critical price zone consisting of the 50-day moving average as a resistance and the multi-month channel’s middle level as a support. The price should soon exit from this tight range and determine the short-term direction. If ETH surpasses the 50-day moving average at 25, the bulls should expect a breakout of the consolidation range at .3K. However, if the price drops below the channel’s middle boundary, another price crash
Topics:
CryptoVizArt considers the following as important: ETH Analysis, ETHBTC, Ethereum (ETH) Price, ethusd
This could be interesting, too:
Mandy Williams writes Ethereum Derivatives Metrics Signal Modest Downside Tail Risk Ahead: Nansen
Jordan Lyanchev writes Weekly Bitcoin, Ethereum ETF Recap: Light at the End of the Tunnel for BTC
CryptoVizArt writes Will Weak Momentum Drive ETH to .5K? (Ethereum Price Analysis)
Jordan Lyanchev writes Bybit Hack Fallout: Arthur Hayes, Samson Mow Push for Ethereum Rollback
It has been 51 days since Ethereum experienced a significant crash and dropped to a new yearly low of $1.1K. Meanwhile, the price has been stuck in a price range between $1.1K and $1.3K. Further consolidation in the mentioned range would be the most likely scenario in the upcoming days.
Technical Analysis
By Shayan
The Daily Chart
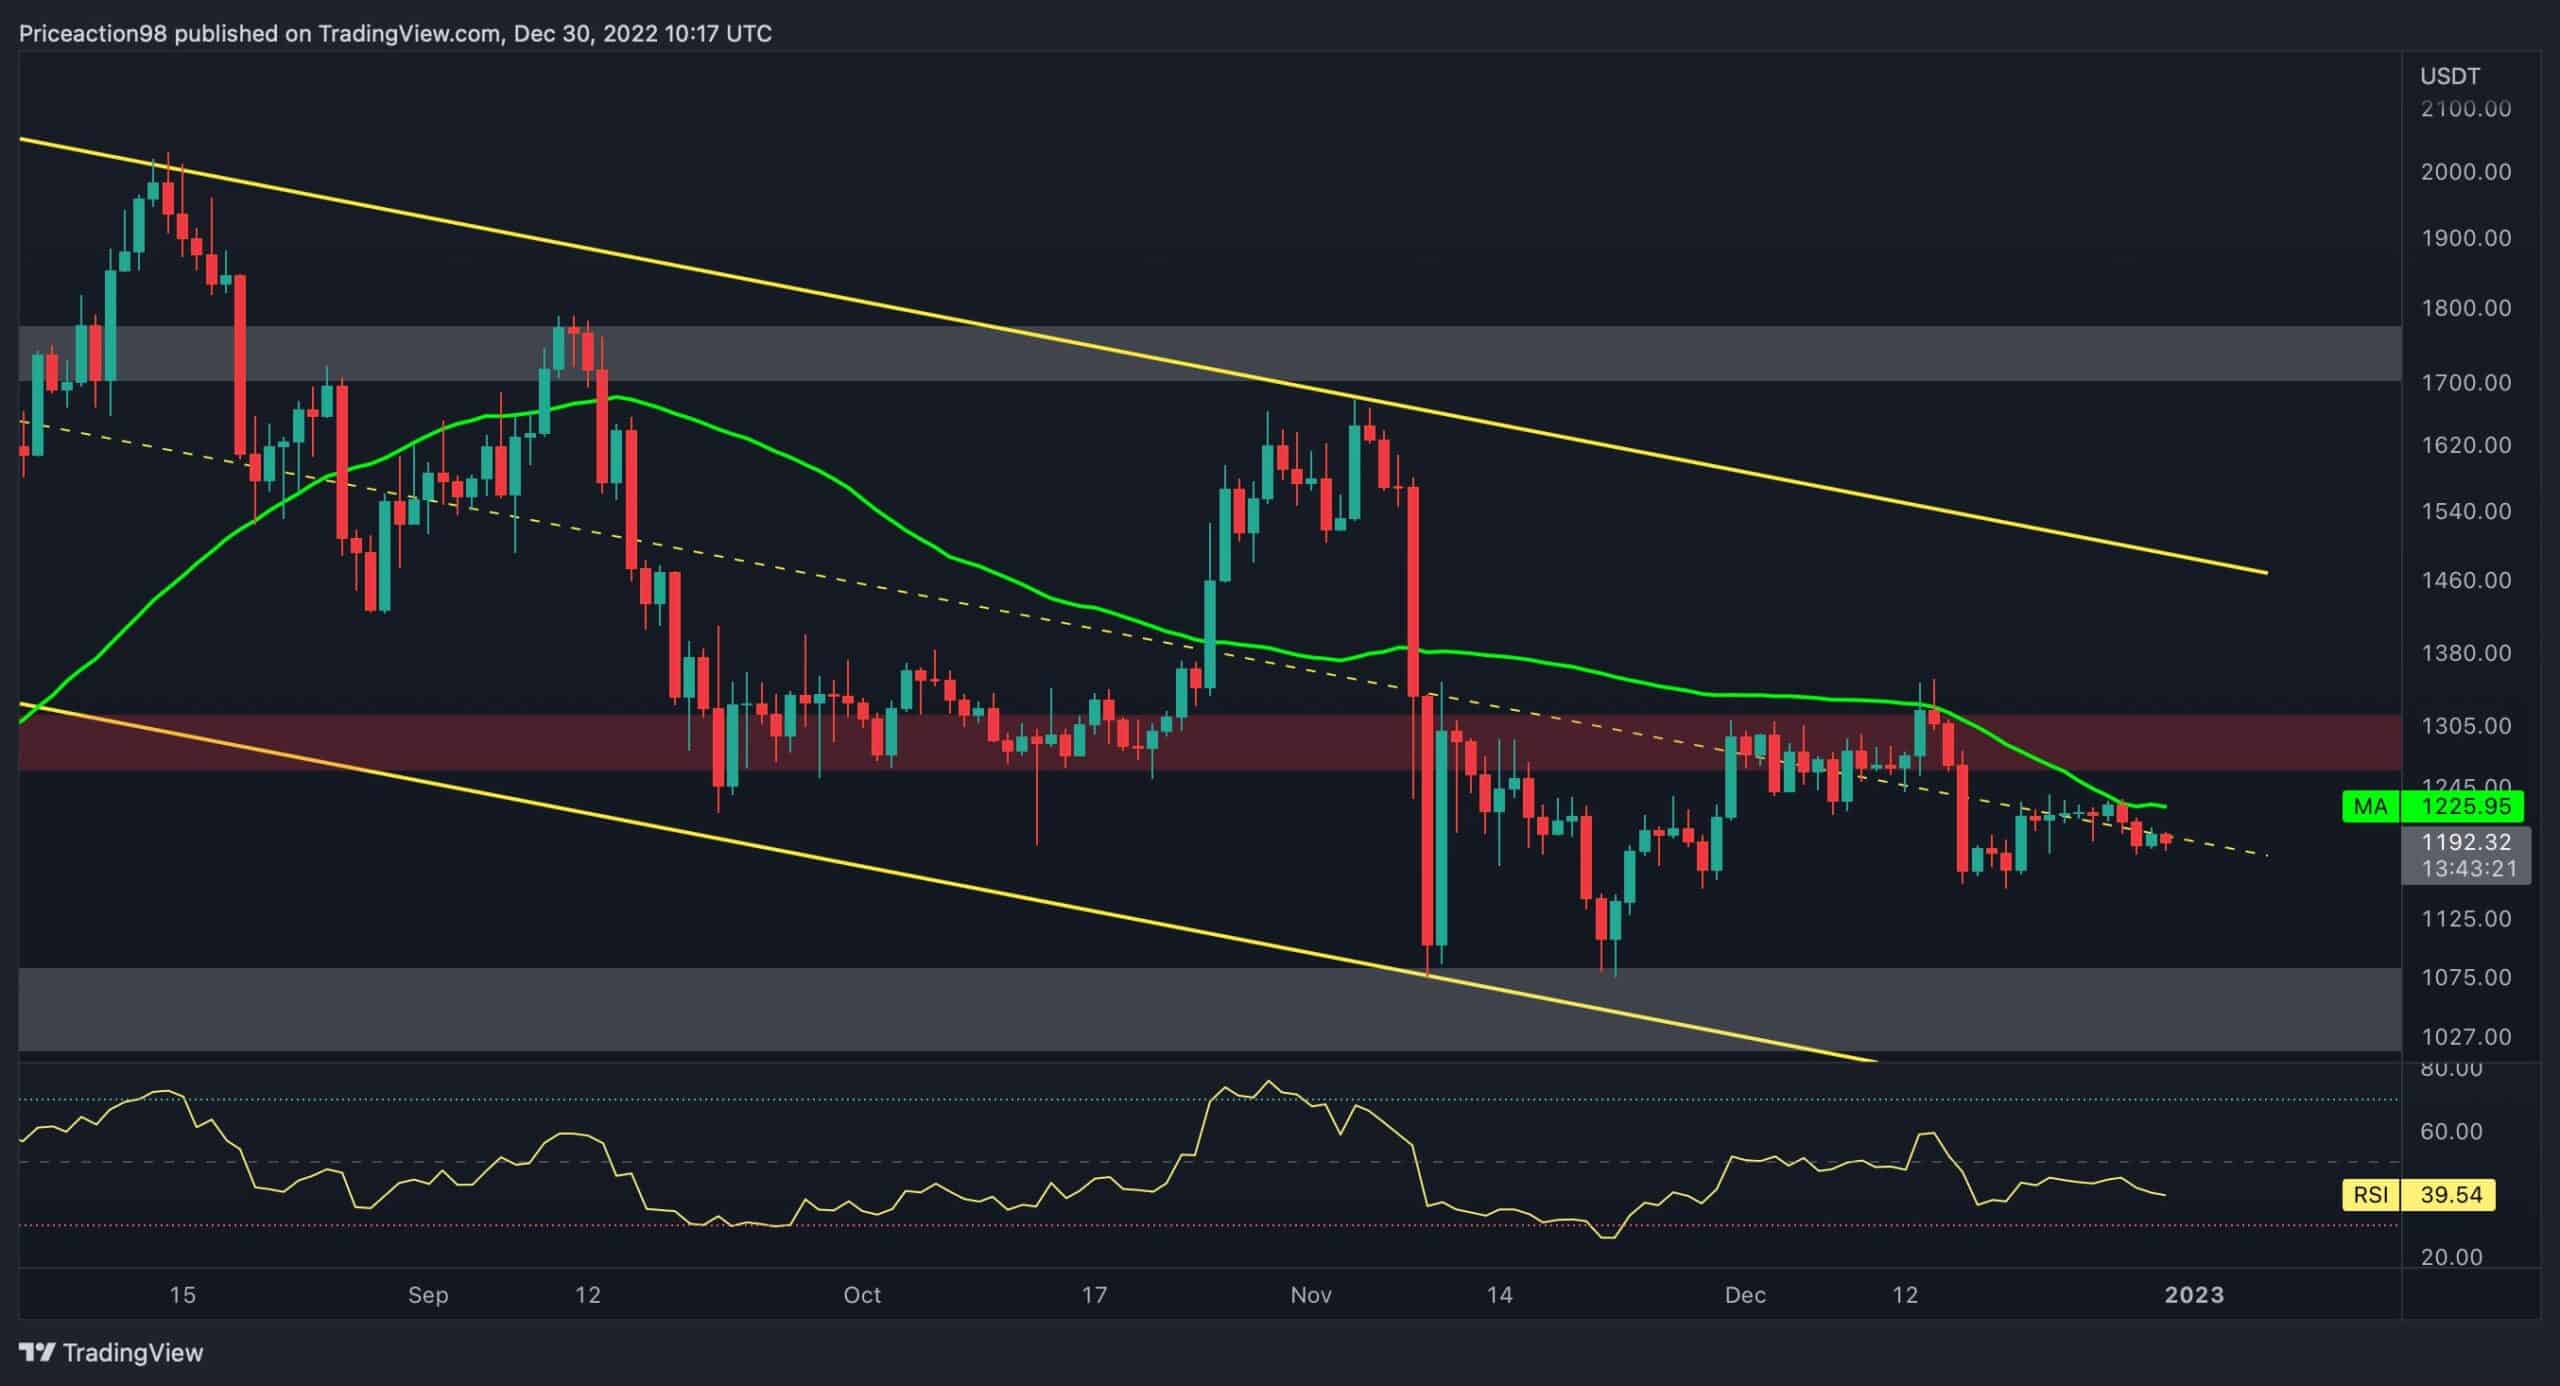
Ethereum faces a critical price zone consisting of the 50-day moving average as a resistance and the multi-month channel’s middle level as a support.
The price should soon exit from this tight range and determine the short-term direction. If ETH surpasses the 50-day moving average at $1225, the bulls should expect a breakout of the consolidation range at $1.3K.
However, if the price drops below the channel’s middle boundary, another price crash might happen, resulting in a plunge toward $1.1K static support (the consolidation range’s lower level).
The 4-Hour Chart
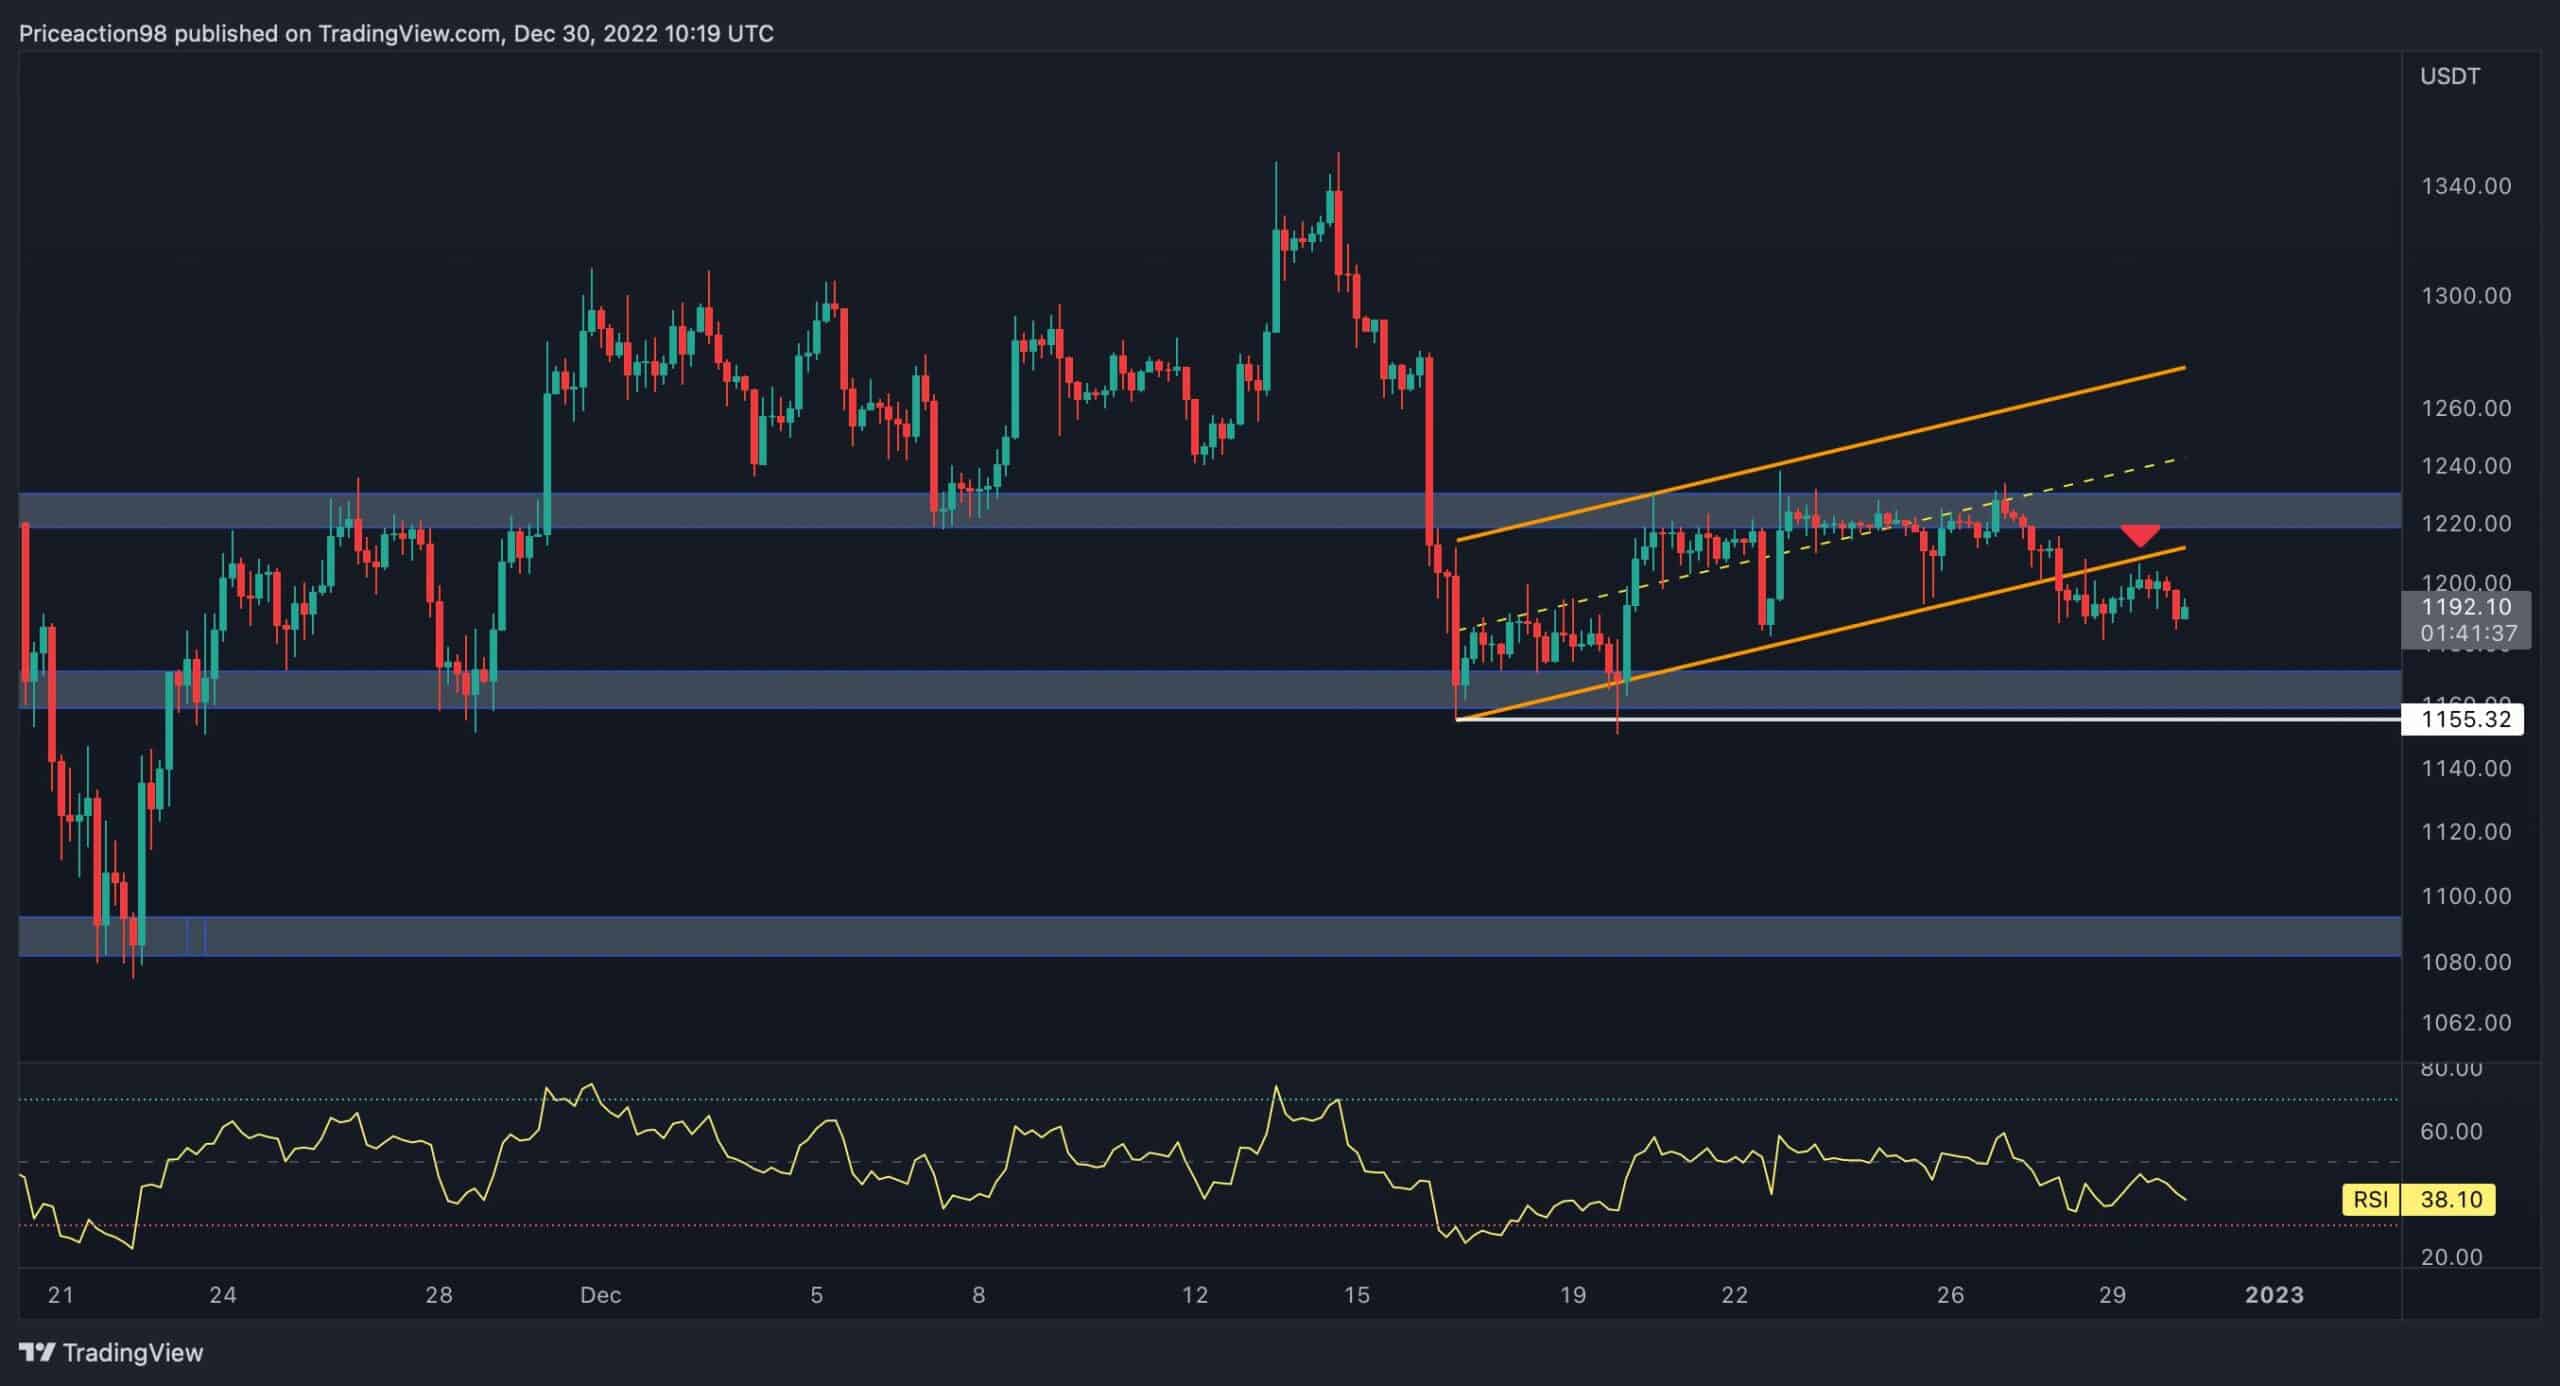
The price has finally broken the continuation correction bearish flag pattern to the downside. The cryptocurrency retested the broken level in the form of a pullback and is consolidating with extremely low volatility. Furthermore, there are three static price levels in the 4-hour timeframe; a resistance level at $1230 and two support levels at $1160 and $1100.
The price is currently in a consolidation phase between the $1230 resistance level and the $1160 support. Considering the low volatility and current price action, the price might be stuck in this range for the short-term view. However, if Ethereum plunges below the $1160 support level, the market will enter a new consolidation stage between the $1160 and $1100 levels.
Onchain Analysis
By Shayan
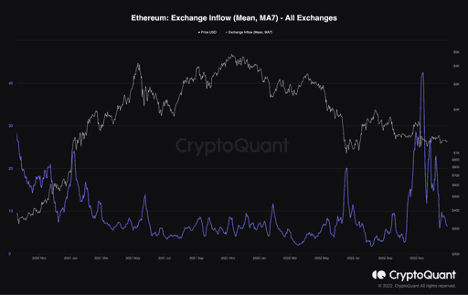
The whales and big players are the most critical and influential cohorts among the market participants, as they hold a significant portion of the supply. Hence, tracking their activity might play an important role in anticipating the market condition.
The chart contains the Exchange Inflow Mean (7-day moving average) and the price. A higher value indicates investors who deposited a lot at once are increasing lately. It could imply higher selling pressure from the big hands and a possible future price drop.
The metric surged impulsively before the major crash in November, indicating that the bigger hands might have caused the price drop by distributing their assets. However, the metric has calmed and decreased significantly. This shows that the market is suffering from a lack of activity. Nevertheless, it might be the calm before the storm.