The market is still in doubt, and the sideways trend has exhausted retail investors. Are we in the accumulation phase, or is this a temporary halt in a bear market? The Daily Chart: ETH has been trading above its dynamic support for more than a year, and the bears have not succeeded in breaking below. It seems that a significant uptrend and the beginning of a bull market starts with the ROC indicator crossing above the downtrend line in the ROC (30D), which has performed well in the past year. The bulls are defending the .3K-.4K support zone, while bears are protecting the resistance levels at K-.3K. Source: TradingViewThe 4-Hour Chart: On the 4H timeframe, the price fluctuates in a rectangle, which coincides with the fluctuation of the RSI (30D) inside the same
Topics:
CryptoVizArt considers the following as important: ETH Analysis, ETHBTC, Ethereum (ETH) Price, ethusd
This could be interesting, too:
Mandy Williams writes Ethereum Derivatives Metrics Signal Modest Downside Tail Risk Ahead: Nansen
Jordan Lyanchev writes Weekly Bitcoin, Ethereum ETF Recap: Light at the End of the Tunnel for BTC
CryptoVizArt writes Will Weak Momentum Drive ETH to .5K? (Ethereum Price Analysis)
Jordan Lyanchev writes Bybit Hack Fallout: Arthur Hayes, Samson Mow Push for Ethereum Rollback
The market is still in doubt, and the sideways trend has exhausted retail investors. Are we in the accumulation phase, or is this a temporary halt in a bear market?
The Daily Chart:
ETH has been trading above its dynamic support for more than a year, and the bears have not succeeded in breaking below.
It seems that a significant uptrend and the beginning of a bull market starts with the ROC indicator crossing above the downtrend line in the ROC (30D), which has performed well in the past year.
The bulls are defending the $2.3K-$2.4K support zone, while bears are protecting the resistance levels at $3K-$3.3K.

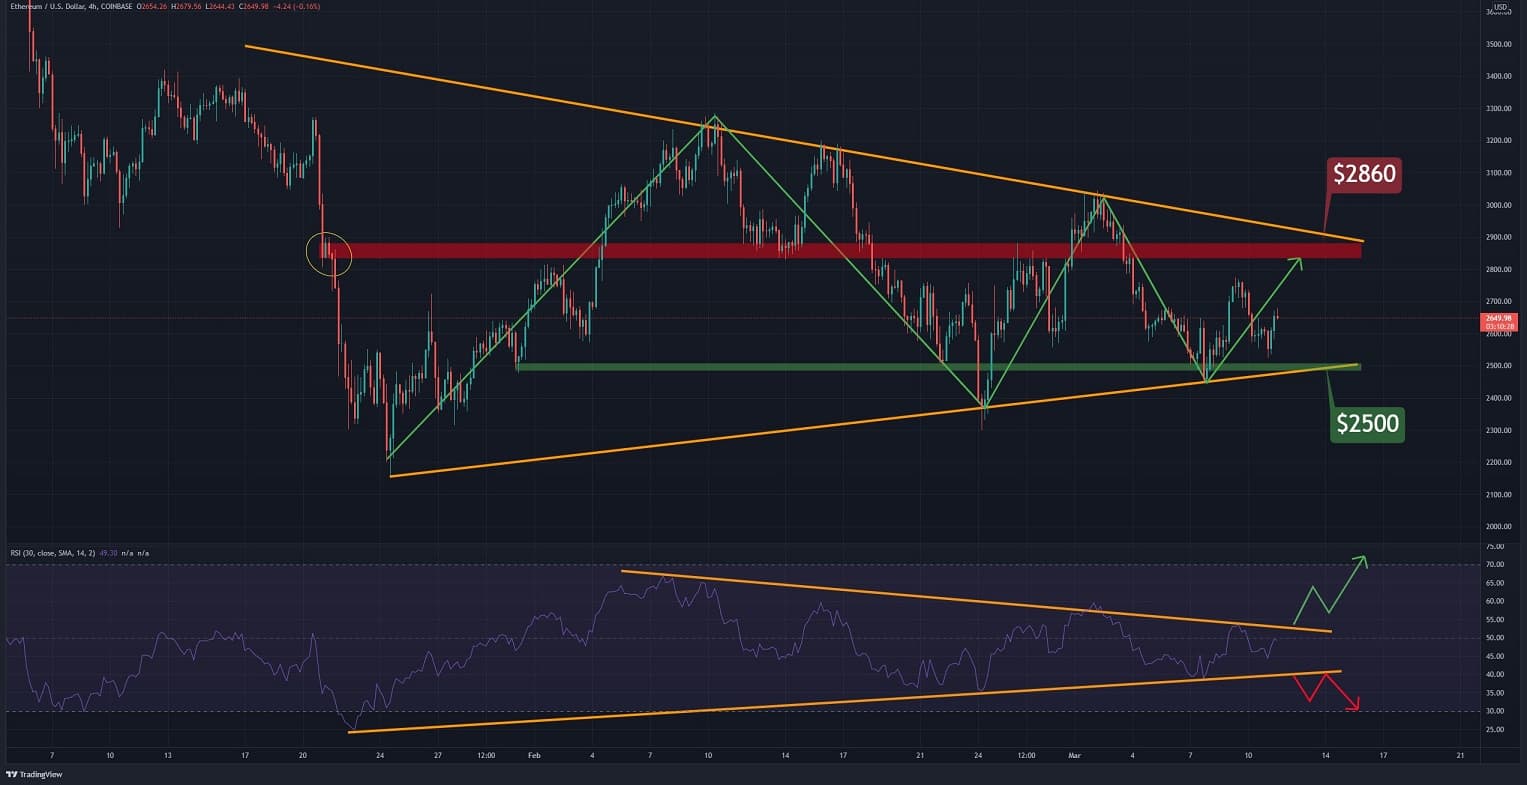
The 4-Hour Chart:
On the 4H timeframe, the price fluctuates in a rectangle, which coincides with the fluctuation of the RSI (30D) inside the same rectangle. Crossing above or below in the RSI can be lead to a powerful trend.
Conclusion
Considering the current market structure, it seems volatility will continue as long as the fear caused by the geopolitical conflicts alongside the uncertainty around the Federal Reserve’s decisions is the dominant sentiment.