Ethereum’s correction continues for the 4th day in a row, hat the excitement about the upcoming Merge in September is beginning to slow down. That said, the mid-term structure of ETH remains somewhat bullish, although bears currently seem to have the upper hand. Technical Analysis By Grizzly The Daily Chart After 74 days, the bulls aspired once again on August 13 to reclaim ,000 (in red) but were unsuccessful. Bears managed to barrel the price down about 8% from the recorded high of 30 (at the time of this writing). This resulted in the price moving towards the support line of the rising wedge pattern, which is technically a bearish pattern. The 20-day moving average line (in white) has also reached the critical support zone in the range of ,700-,800. This
Topics:
CryptoVizArt considers the following as important: ETH Analysis, ETHBTC, Ethereum (ETH) Price, ethusd
This could be interesting, too:
Mandy Williams writes Ethereum Derivatives Metrics Signal Modest Downside Tail Risk Ahead: Nansen
Jordan Lyanchev writes Weekly Bitcoin, Ethereum ETF Recap: Light at the End of the Tunnel for BTC
CryptoVizArt writes Will Weak Momentum Drive ETH to .5K? (Ethereum Price Analysis)
Jordan Lyanchev writes Bybit Hack Fallout: Arthur Hayes, Samson Mow Push for Ethereum Rollback
Ethereum’s correction continues for the 4th day in a row, hat the excitement about the upcoming Merge in September is beginning to slow down. That said, the mid-term structure of ETH remains somewhat bullish, although bears currently seem to have the upper hand.
Technical Analysis
By Grizzly
The Daily Chart
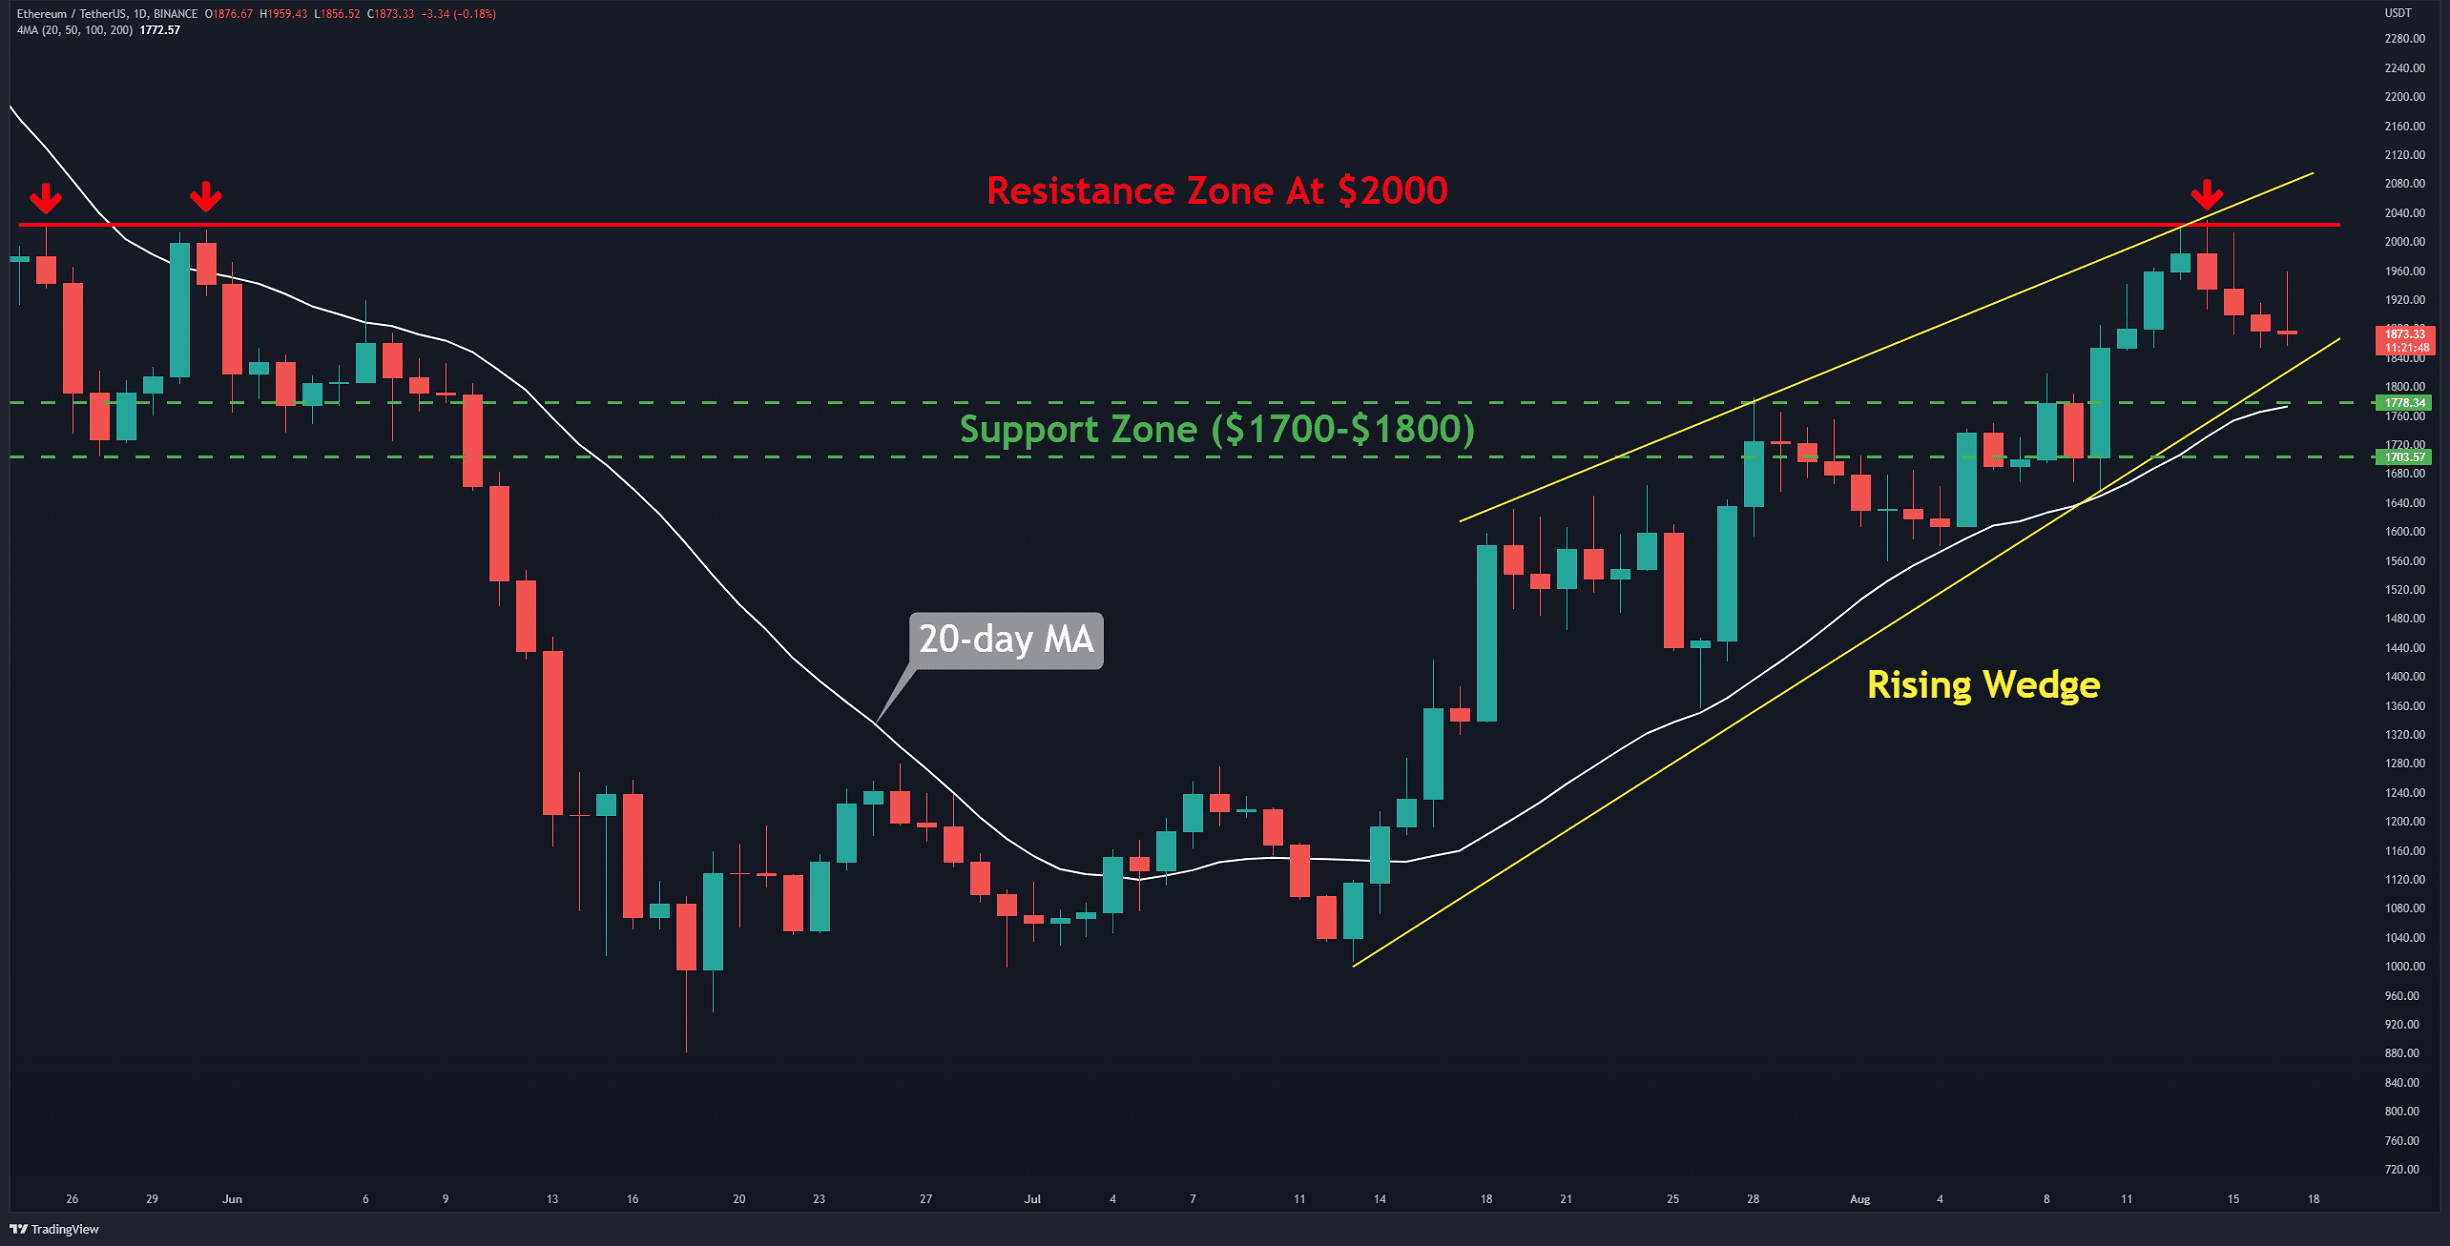
After 74 days, the bulls aspired once again on August 13 to reclaim $2,000 (in red) but were unsuccessful. Bears managed to barrel the price down about 8% from the recorded high of $2030 (at the time of this writing). This resulted in the price moving towards the support line of the rising wedge pattern, which is technically a bearish pattern.
The 20-day moving average line (in white) has also reached the critical support zone in the range of $1,700-$1,800. This suggests that solid support is forming there.
If the bulls are determined to resume the upward trend and retest the resistance at $2000, they should defend the mentioned zone. A break and close below it can trigger the formation of a bearish structure. In this case, the closest support is found at around $1,600.
Key Support Levels: $1800 & $1600
Key Resistance Levels: $2000 & $2200
Daily Moving Averages:
MA20: $1771
MA50: $1492
MA100: $1575
MA200: $2246
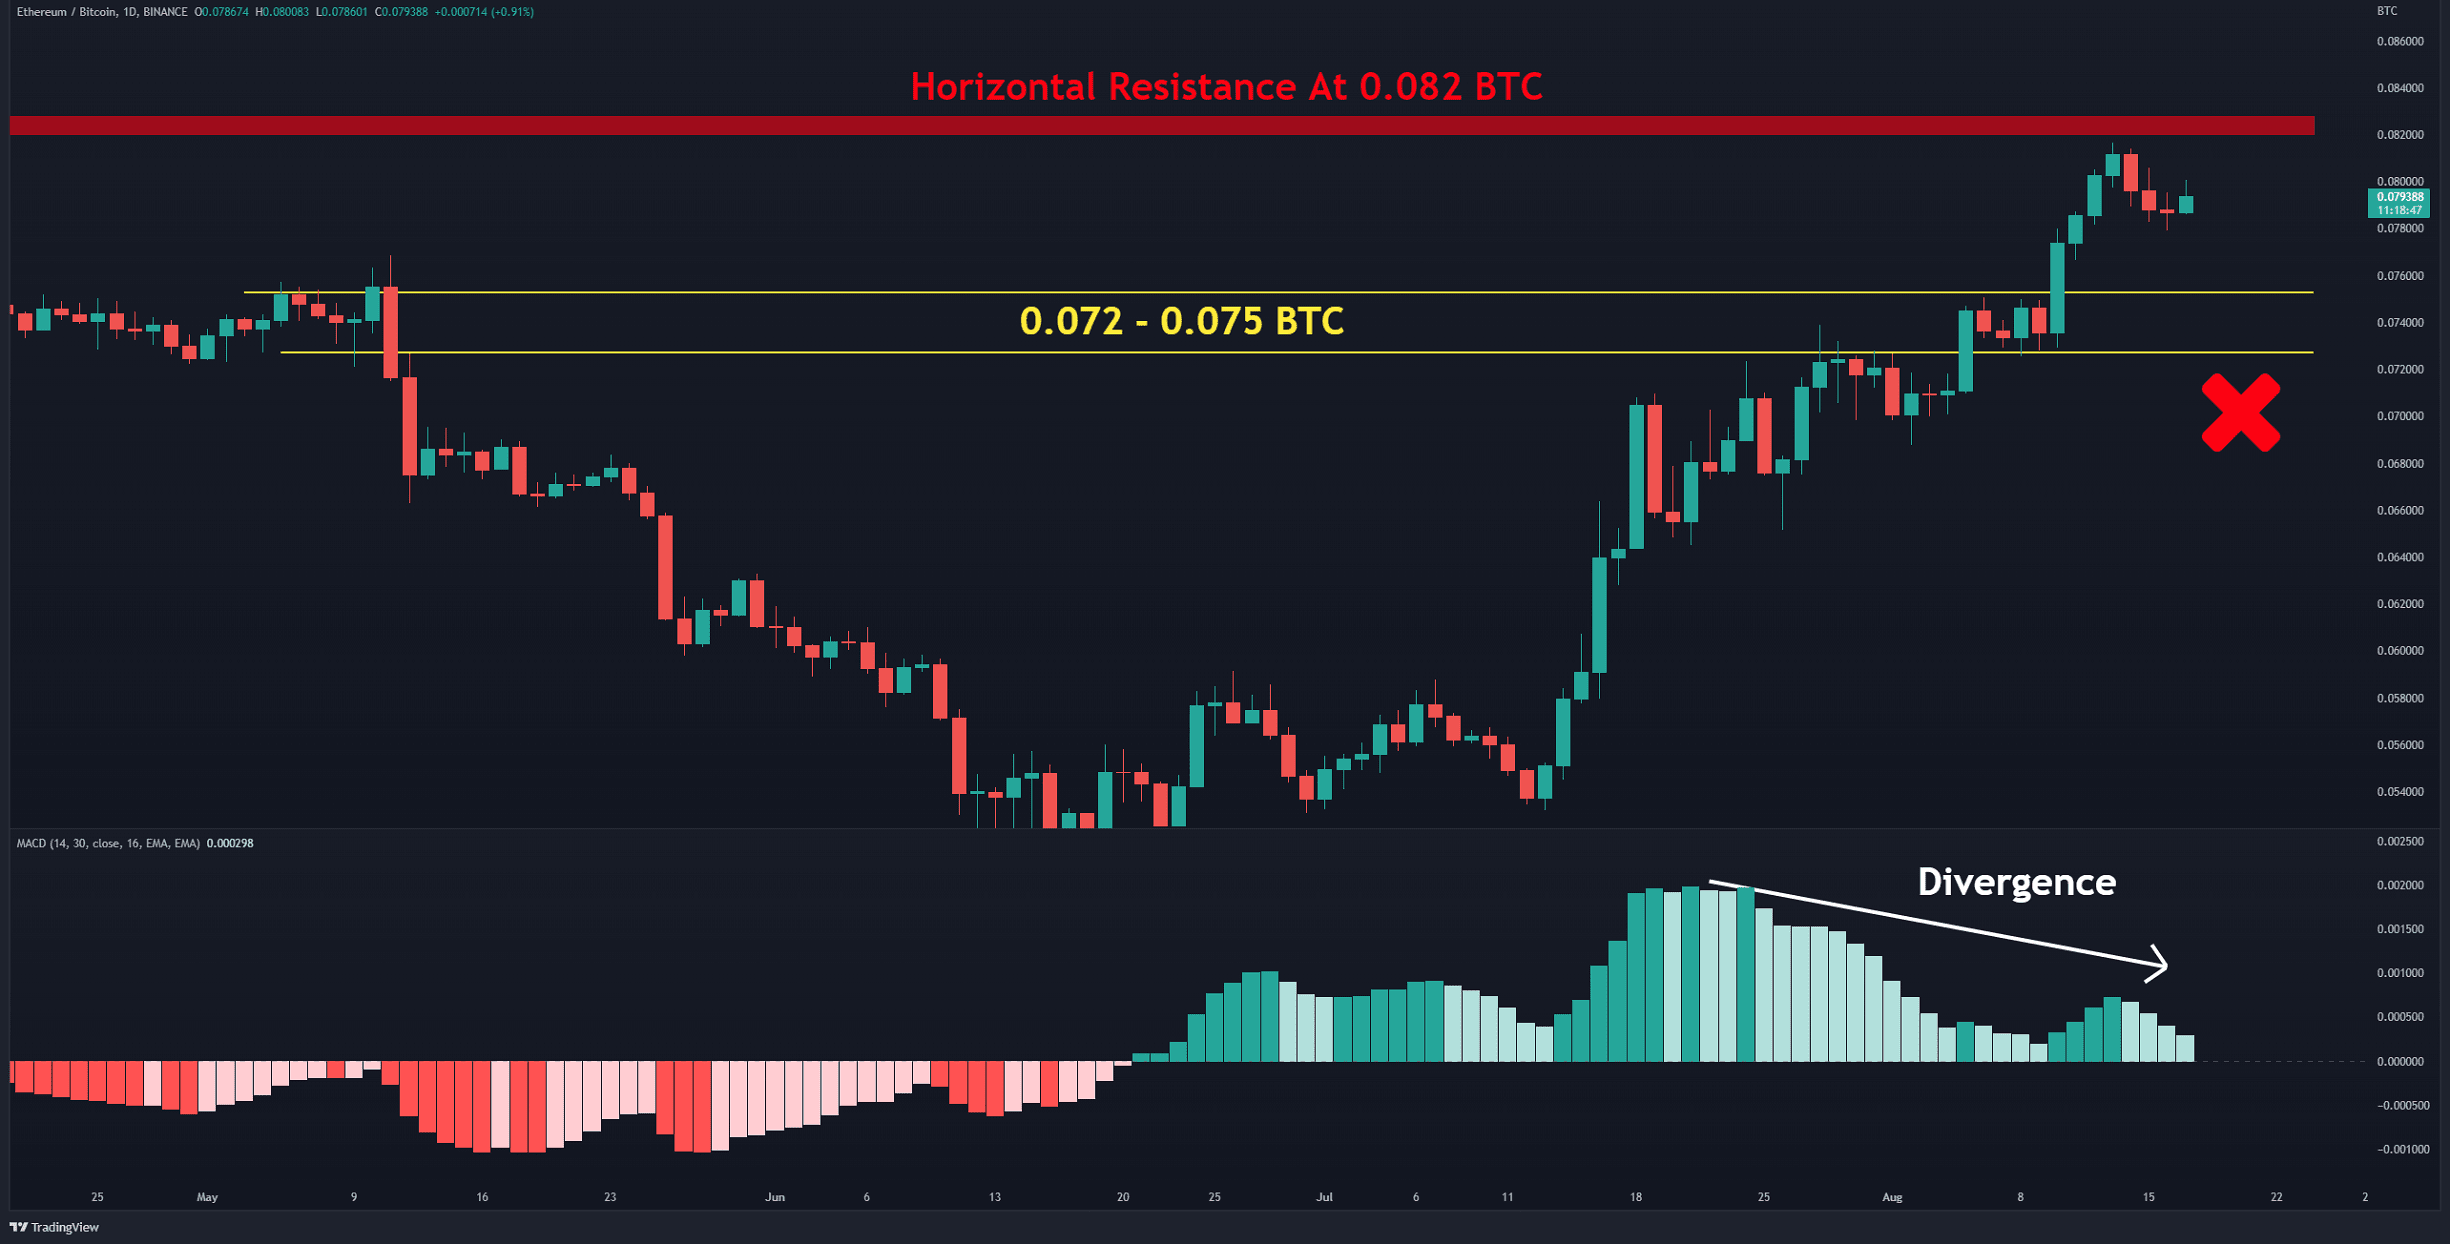
The ETH/BTC Chart
A divergence in the MACD indicator has appeared against Bitcoin. ETH experienced a short-term correction after hitting horizontal resistance at 0.082 BTC (in red). According to the formation of a green candle, it seems that investors are dumping their BTC for ETH.
The bullish view remains strong if the bulls can sustain the price above the support range at 0.072-0.075 BTC (in yellow). Conversely, if this level cracks, it will signal the start of a new downtrend with a target of 0.065 BTC. At the moment, the bulls are in control of this pair.
Key Support Levels: 0.0.75 & 0.065 BTC
Key Resistance Levels: 0.082 & 0.088 BTC
On-chain Analysis
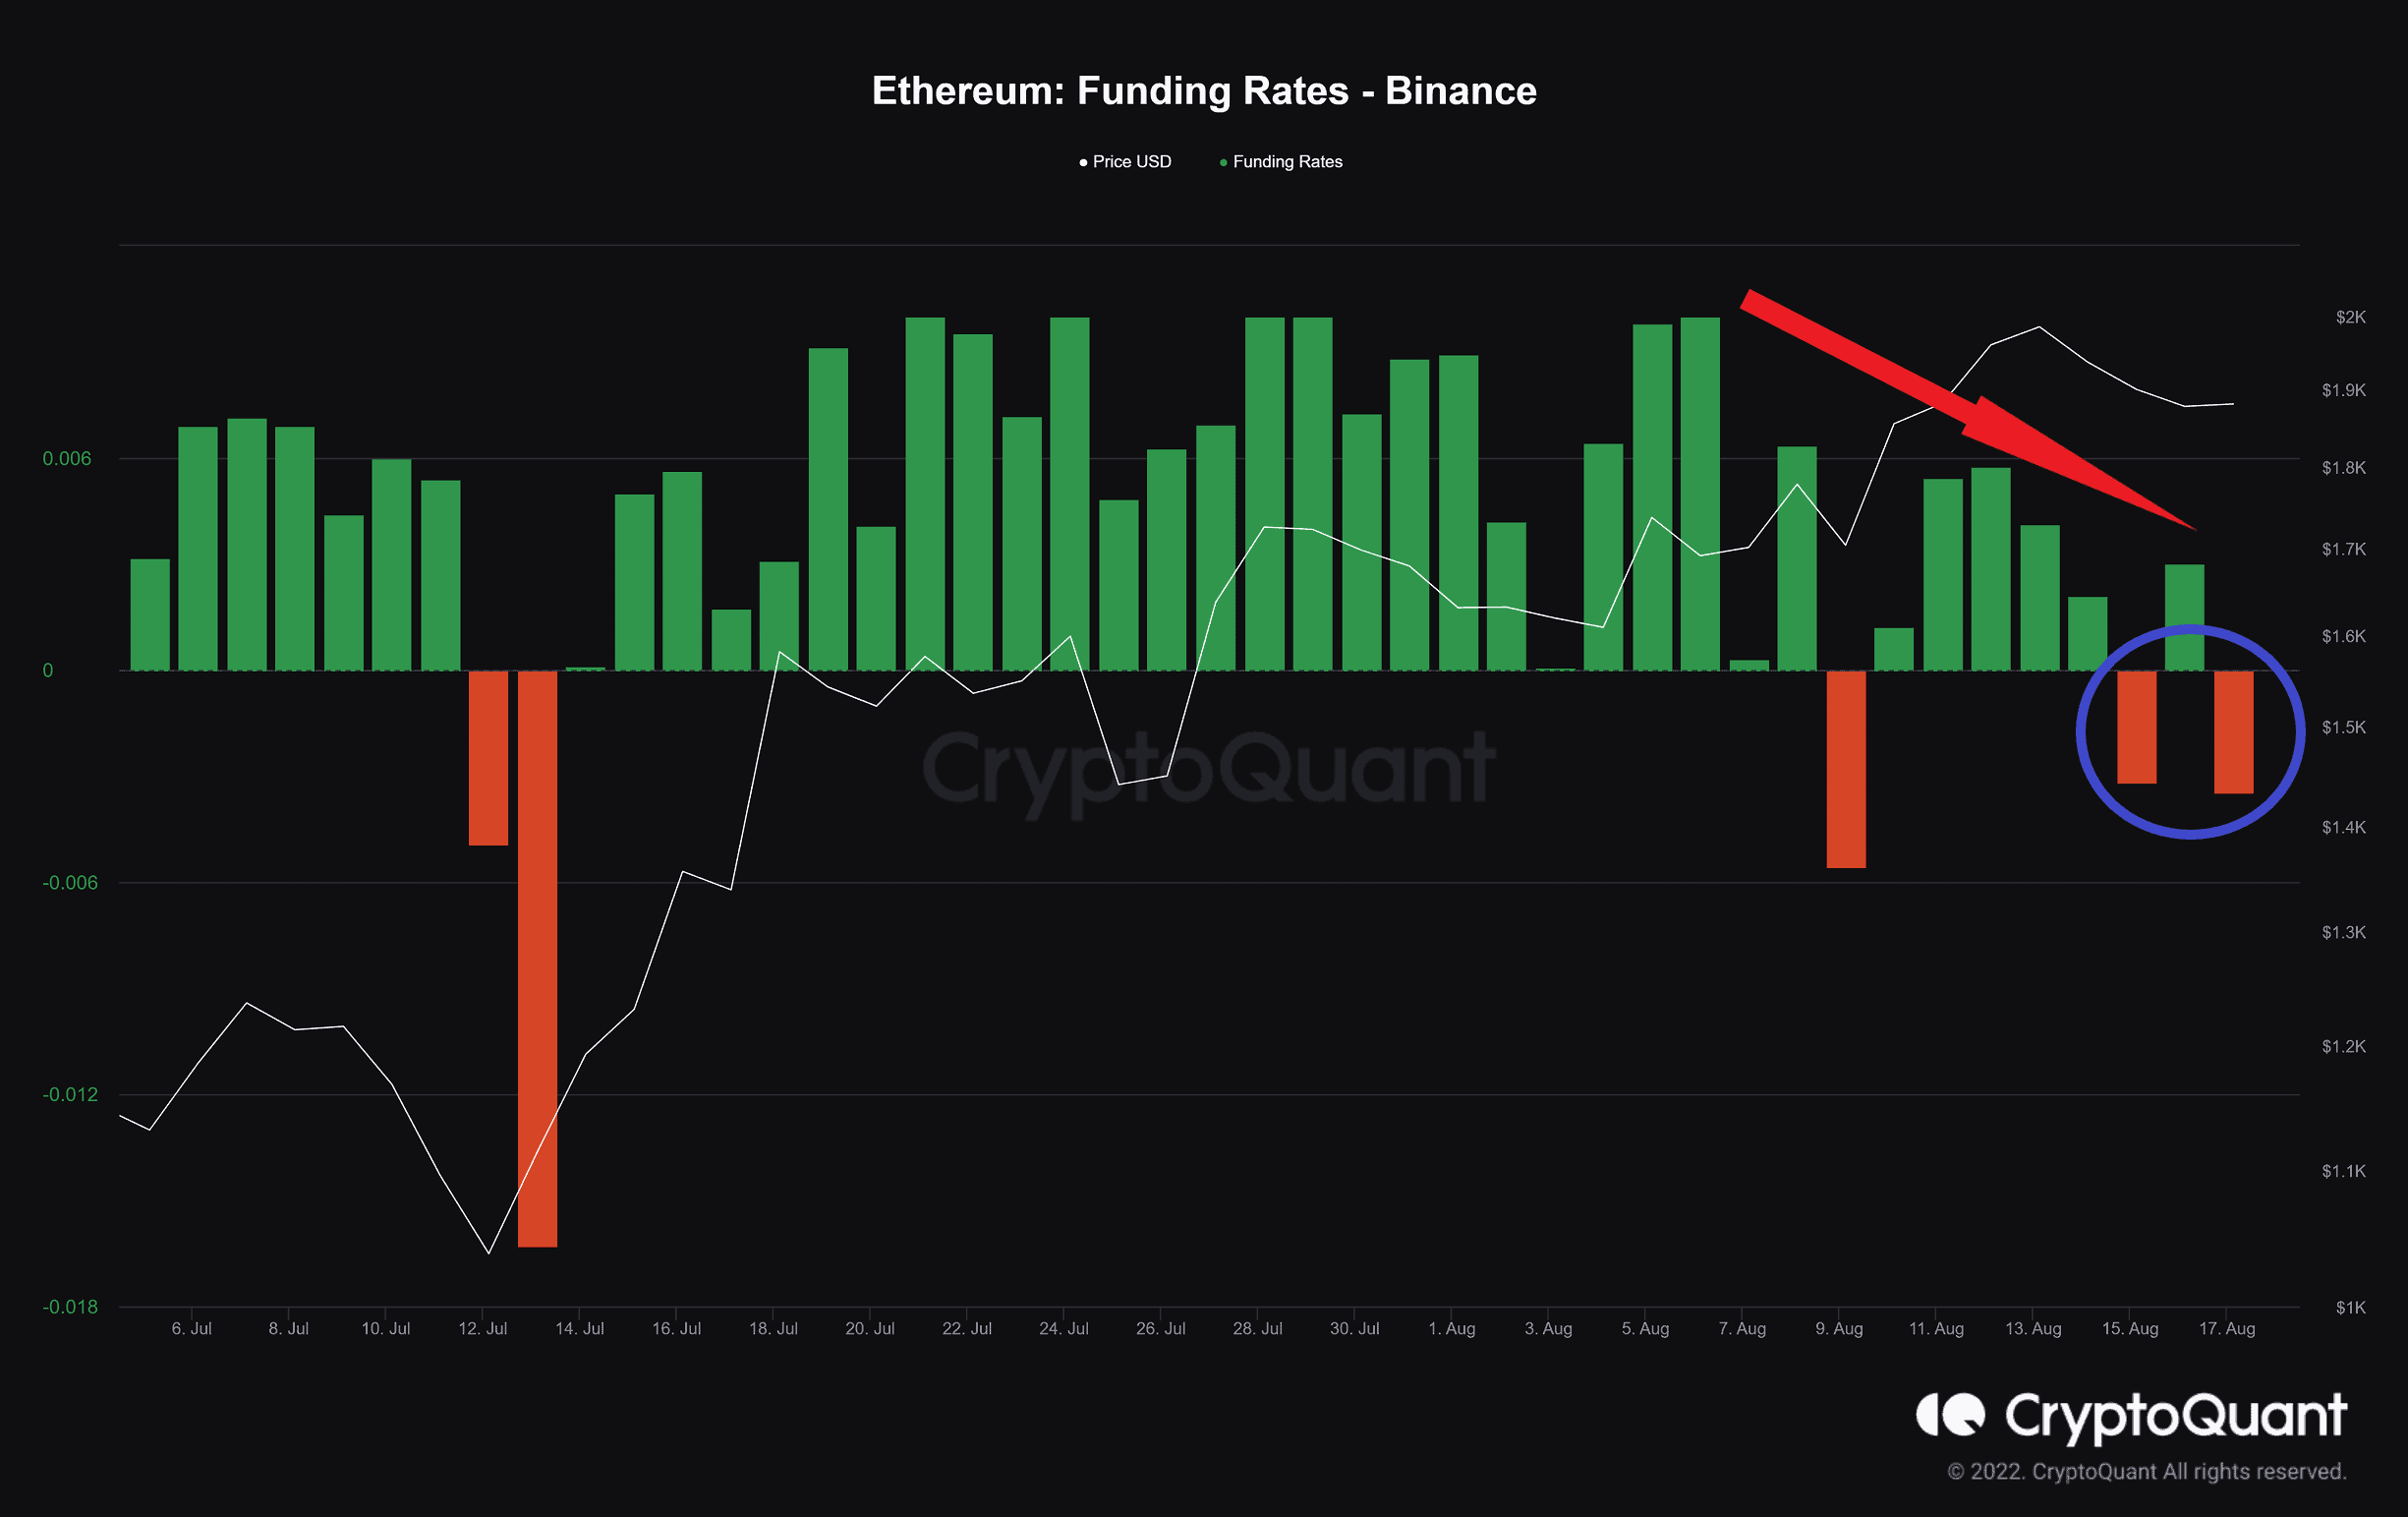
Funding Rates – Binance
Definition: Periodic payments to traders that are either long or short, based on the difference between perpetual contract markets and spot prices.
Positive funding rates indicate that long position traders are dominant and are willing to pay funding to short traders.
Negative funding rates indicate that short position traders are dominant and are willing to pay long traders.
After a long time, this funding rate was positive, and consecutive green histogram bars appeared on the chart. However, for a few days, red histogram bars have appeared in the funding rate of the Binance exchange, and where it is also decreasing. This shows that the bullish sentiment has become more fragile compared to the last two months. It must be considered that it has not yet reached the levels where it can be said that bearish sentiments dominate the derivatives market.