Following yesterday’s Fed interest rate announcement, Ethereum’s price has seemingly taken a U-turn, getting rejected from a significant resistance zone. Another bearish phase could soon begin unless the market rebounds over the next few days. Technical Analysis By: Edris The Daily Chart On the daily chart, the price has failed to break above the 00 level and is currently falling to the downside. The 50-day moving average has also been tested around the same area, but the price was also unsuccessful in closing above it. In case the price somehow breaks above the 00 level and the above-mentioned moving average, the 200-day moving average around the 00 mark would be the first potential obstacle. However, considering the current market structure, which hints at a
Topics:
CryptoVizArt considers the following as important: ETH Analysis, ETHBTC, Ethereum (ETH) Price, ethusd
This could be interesting, too:
Mandy Williams writes Ethereum Derivatives Metrics Signal Modest Downside Tail Risk Ahead: Nansen
Jordan Lyanchev writes Weekly Bitcoin, Ethereum ETF Recap: Light at the End of the Tunnel for BTC
CryptoVizArt writes Will Weak Momentum Drive ETH to .5K? (Ethereum Price Analysis)
Jordan Lyanchev writes Bybit Hack Fallout: Arthur Hayes, Samson Mow Push for Ethereum Rollback
Following yesterday’s Fed interest rate announcement, Ethereum’s price has seemingly taken a U-turn, getting rejected from a significant resistance zone. Another bearish phase could soon begin unless the market rebounds over the next few days.
Technical Analysis
By: Edris
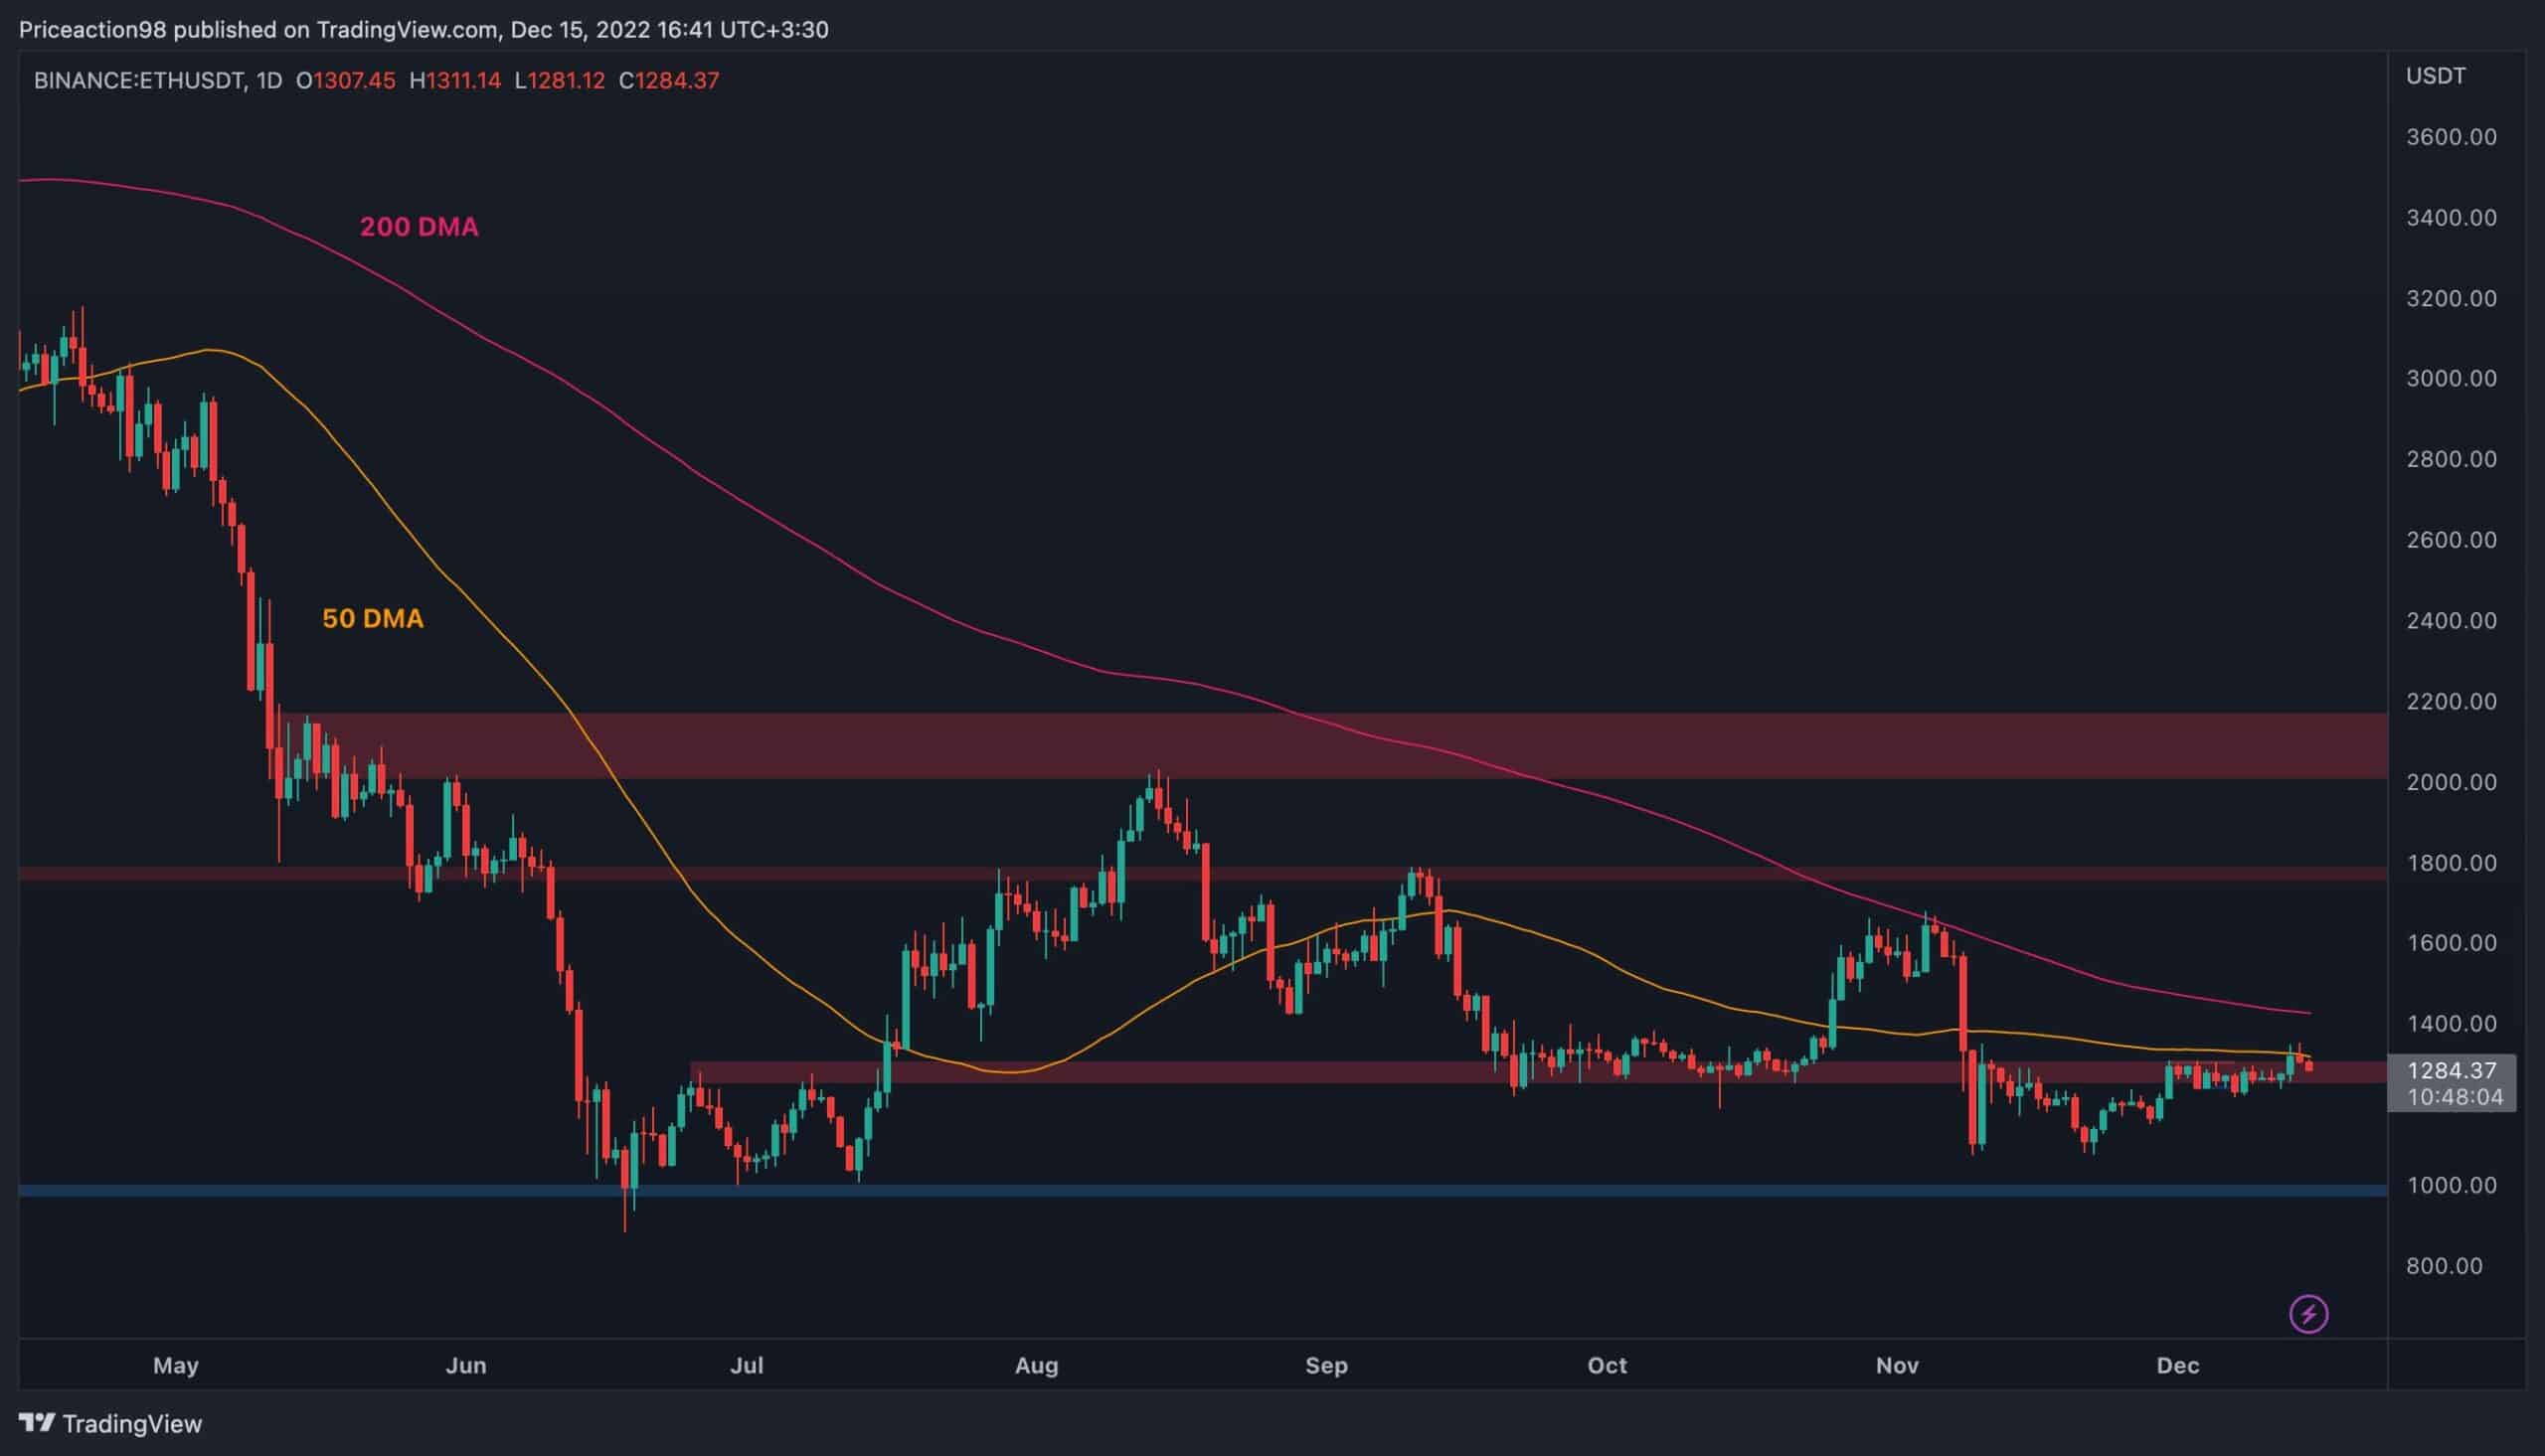
The Daily Chart
On the daily chart, the price has failed to break above the $1300 level and is currently falling to the downside. The 50-day moving average has also been tested around the same area, but the price was also unsuccessful in closing above it.
In case the price somehow breaks above the $1300 level and the above-mentioned moving average, the 200-day moving average around the $1400 mark would be the first potential obstacle.
However, considering the current market structure, which hints at a failed breakout from the $1300 level, a drop toward $1000 would be the more likely outcome. The $1000 area would be a key level to watch as it could lead to another disastrous crash if broken to the downside.
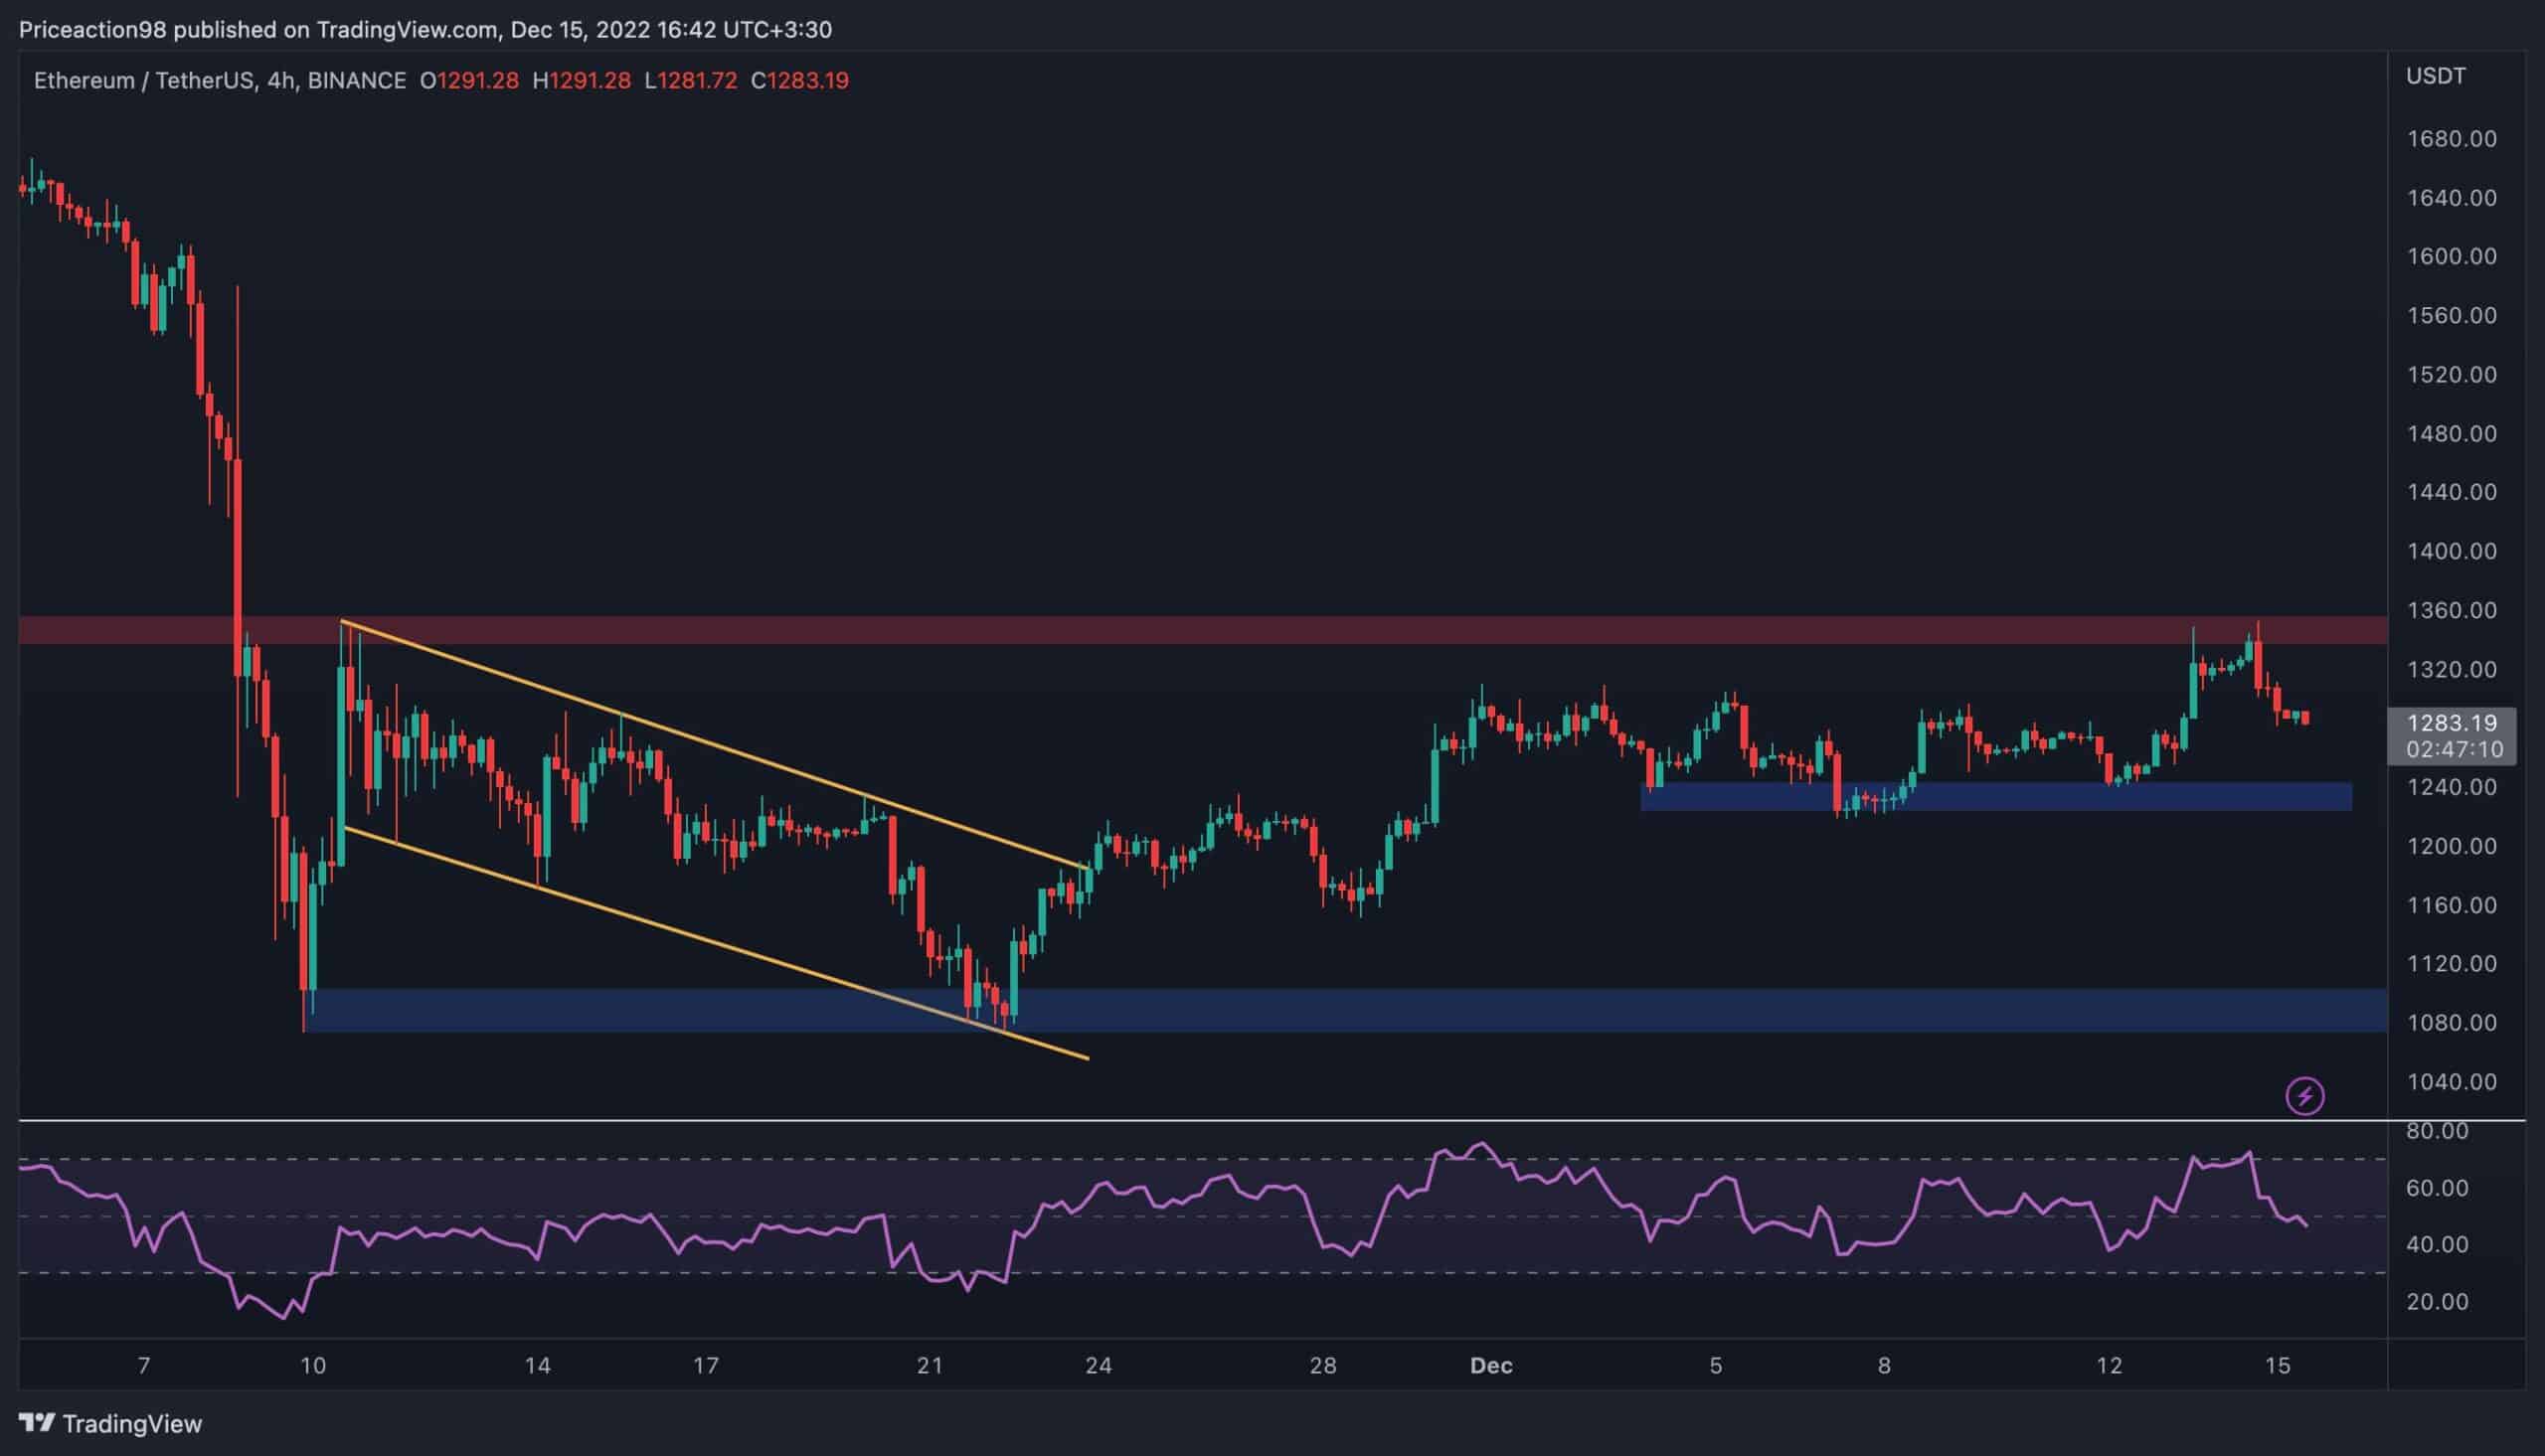
The 4-Hour Chart
In the 4-hour timeframe, the current market structure becomes more clear. The price has been impulsively rejected from the $1300 resistance level and is currently bound to retest the $1240 support area.
The rejection was signaled beforehand, as the RSI indicator has been trending around the overbought area, pointing to a probable bearish reversal in the short term. The popular oscillator has now dropped below the 50% mark, indicating a bearish dominance as the momentum is shifting downward.
Unless the market structure changes in the next few days, a retest of the $1240 support level and even a crash towards the stronger $1100 area would be probable in the coming weeks.
Sentiment Analysis
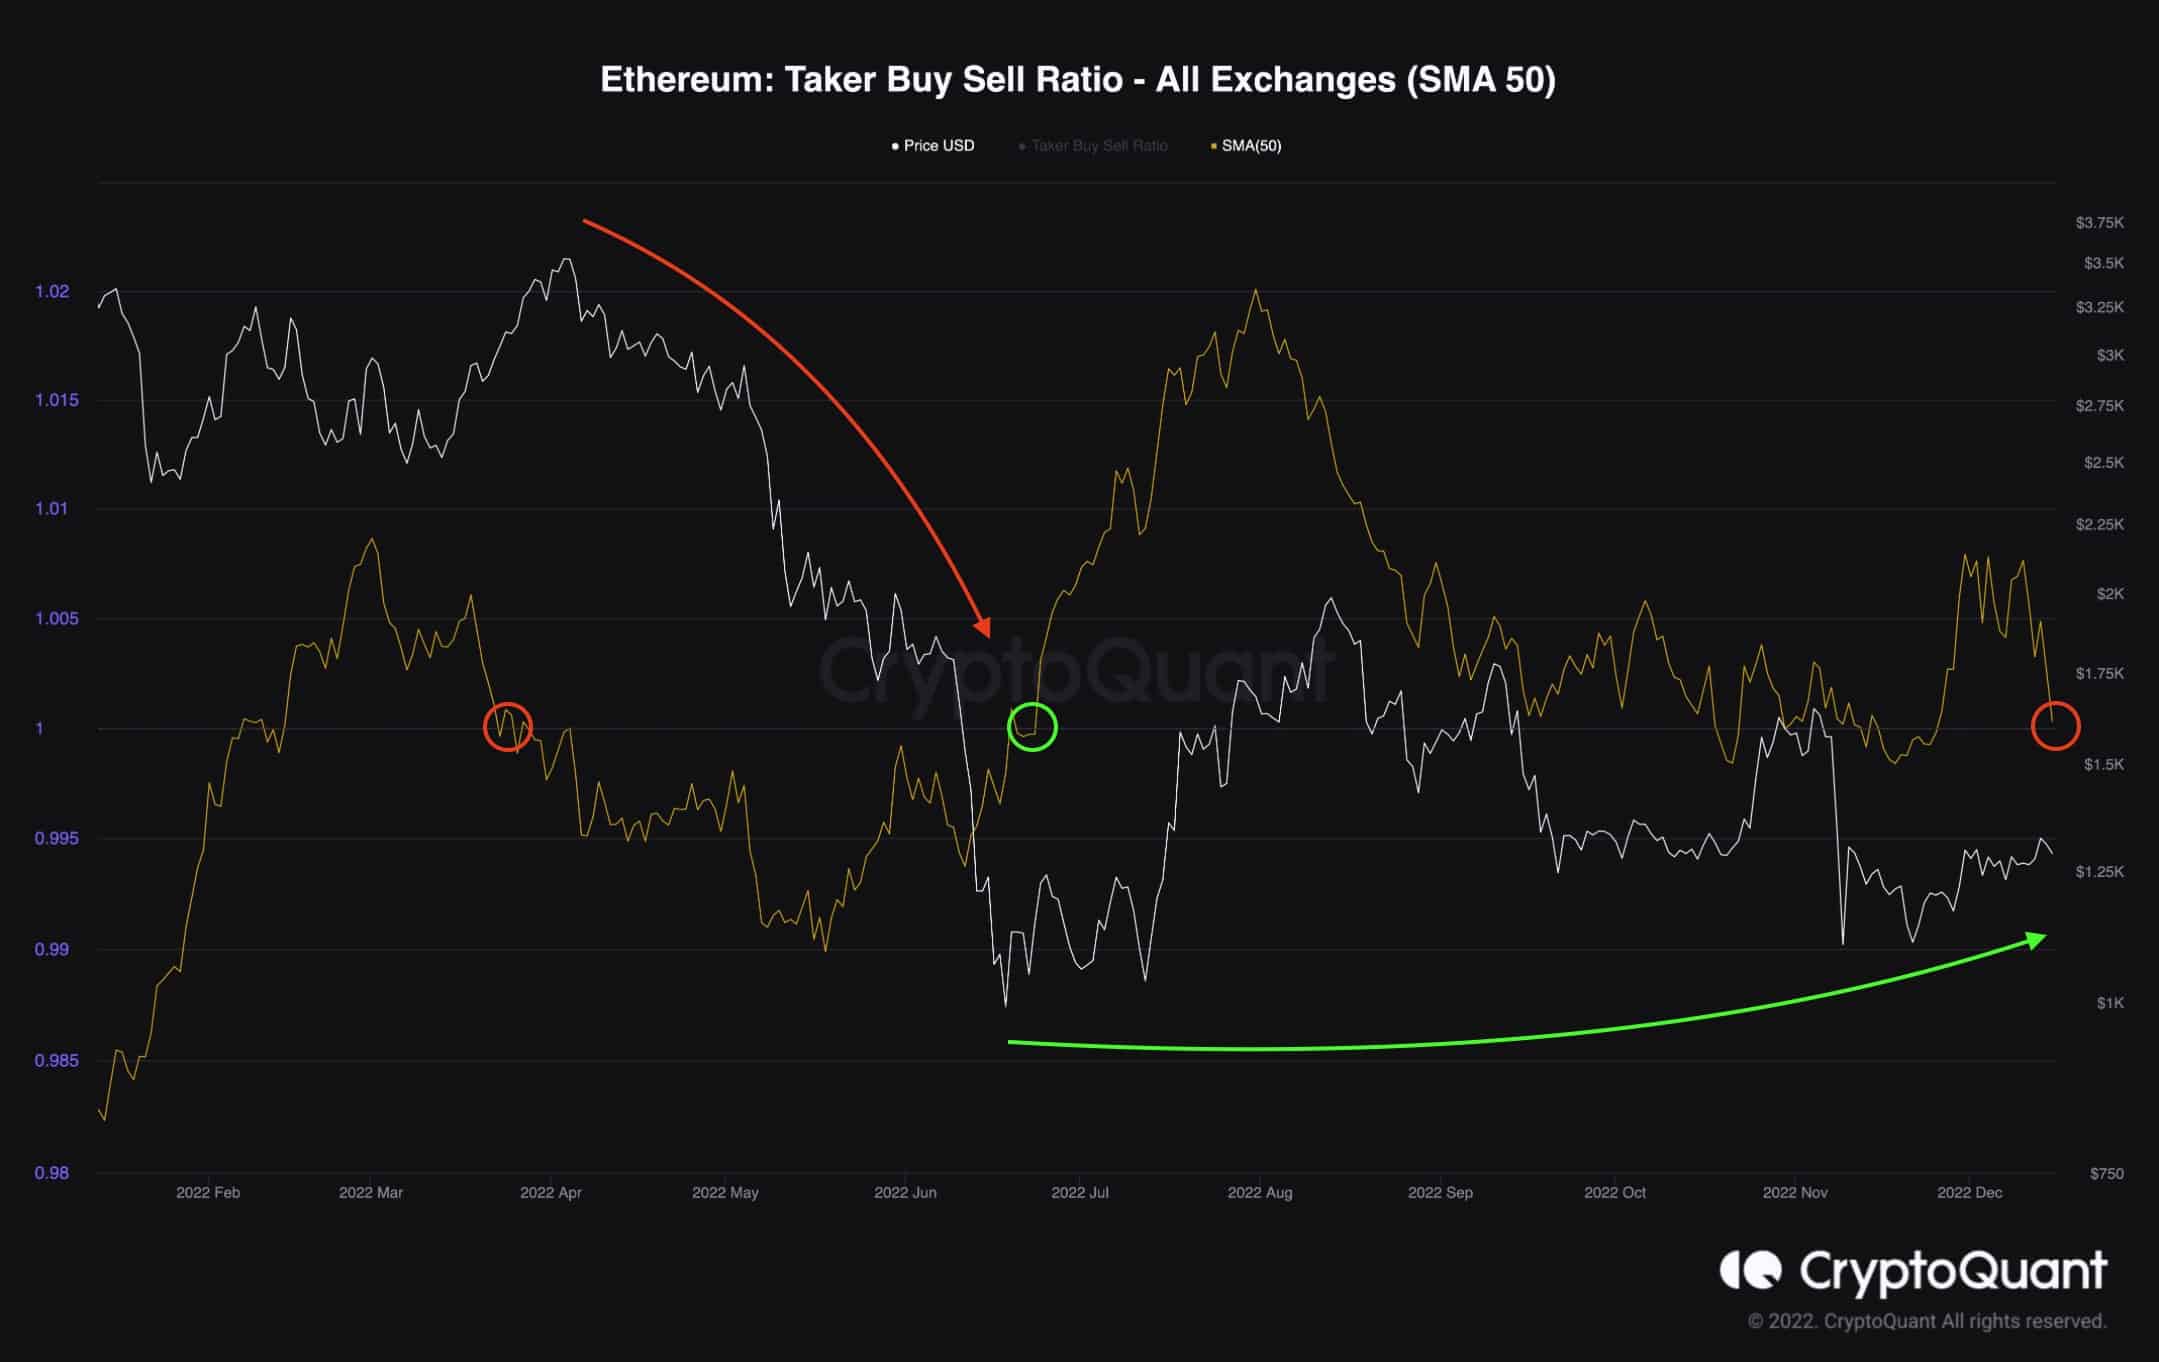
Ethereum Taker Buy Sell Ratio
While Ethereum’s price has been showing relative resilience by not making a new lower low during the FTX crash, the futures market could be suggesting that things are about to change.
This chart demonstrates the 50-day moving average of the Taker Buy Sell Ratio, which is primarily used for evaluating the futures market sentiment, as it indicates whether the bulls or bears are more aggressive.
Values above 1 are associated with bullish sentiment; conversely, values below 1 showcase the bears’ dominance.
Shifts above or below this threshold are also important, as the metrics’ decline below 1 in March signaled the eventual crash, which started soon after. On the contrary, as the ratio rose above 1 in June, the crash came to a halt, and the market has been consolidating and even experiencing short-term price rallies.
Currently, the Taker Buy Sell Ratio is rapidly approaching 1, which indicates aggressive short selling happening in the futures market.
In the event the metric drops below 1, the bears would assert their dominance once again, and a further crash could be on the horizon for Ethereum.