Over the course of the last month, Ethereum has adopted a sinusoidal pattern. Sellers defended the ,400, while buyers were protecting ,200 strongly. After reaching a peak at 30 on August 23, the overall structure remains negative. Technical Analysis By Grizzly The Daily Chart The price is moving in a narrow range on the daily chart against the US dollar, resulting in minimal change in the overall trend. Furthermore, on a larger scale, the pair is clearly declining in a falling wedge (in yellow). Technically, this pattern is often considered bullish, provided that the price breaks out of the ceiling. Currently, the top of the wedge is between ,400 and ,420. If the cryptocurrency breaks above this level, a new green wave with the first target of ,650 could be
Topics:
CryptoVizArt considers the following as important: ETH Analysis, ETHBTC, Ethereum (ETH) Price, ethusd
This could be interesting, too:
CryptoVizArt writes Will Weak Momentum Drive ETH to .5K? (Ethereum Price Analysis)
Jordan Lyanchev writes Bybit Hack Fallout: Arthur Hayes, Samson Mow Push for Ethereum Rollback
Mandy Williams writes Ethereum Key Metrics Point to Persistent Bullish Outlook for ETH: CryptoQuant
CryptoVizArt writes Ethereum Price Analysis: Following a 15% Weekly Crash, What’s Next for ETH?
Over the course of the last month, Ethereum has adopted a sinusoidal pattern. Sellers defended the $1,400, while buyers were protecting $1,200 strongly. After reaching a peak at $2030 on August 23, the overall structure remains negative.
Technical Analysis
By Grizzly
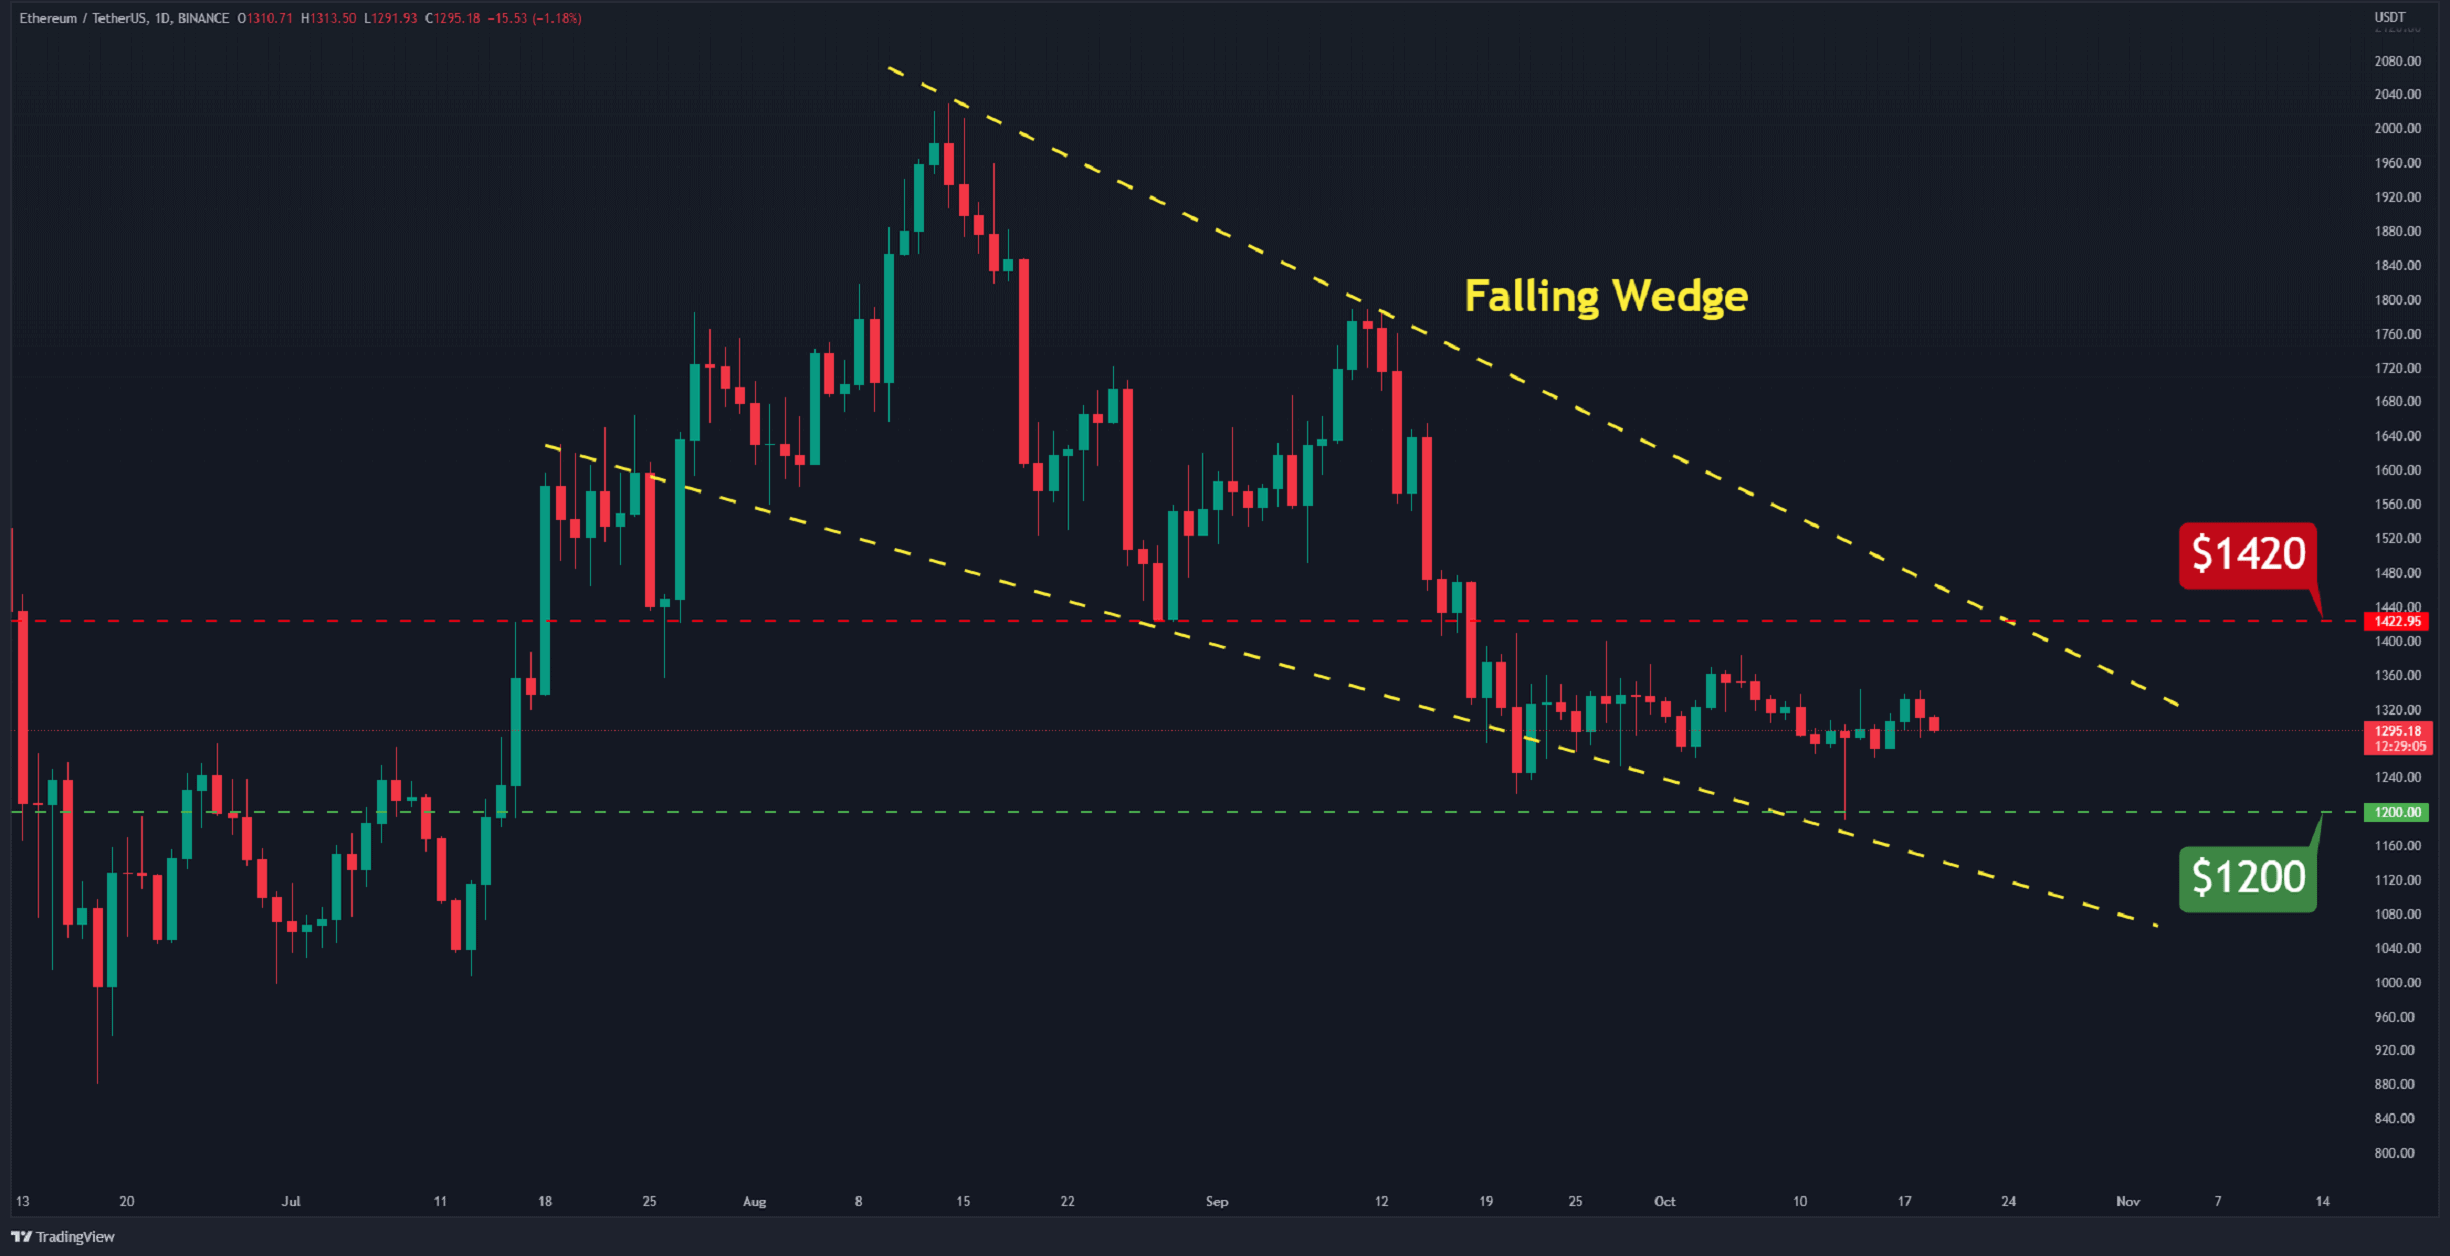
The Daily Chart
The price is moving in a narrow range on the daily chart against the US dollar, resulting in minimal change in the overall trend. Furthermore, on a larger scale, the pair is clearly declining in a falling wedge (in yellow). Technically, this pattern is often considered bullish, provided that the price breaks out of the ceiling.
Currently, the top of the wedge is between $1,400 and $1,420. If the cryptocurrency breaks above this level, a new green wave with the first target of $1,650 could be underway.
Suppose, however, that the price of Ethereum goes below $1,200. In this case, the wedge bottom near $1,000 has the ability to keep the price from falling any lower.
Key Support Levels: $1200 & $1000
Key Resistance Levels: $1420 & $1650
Daily Moving Averages:
MA20: $1312
MA50: $1419
MA100: $1516
MA200: $1797
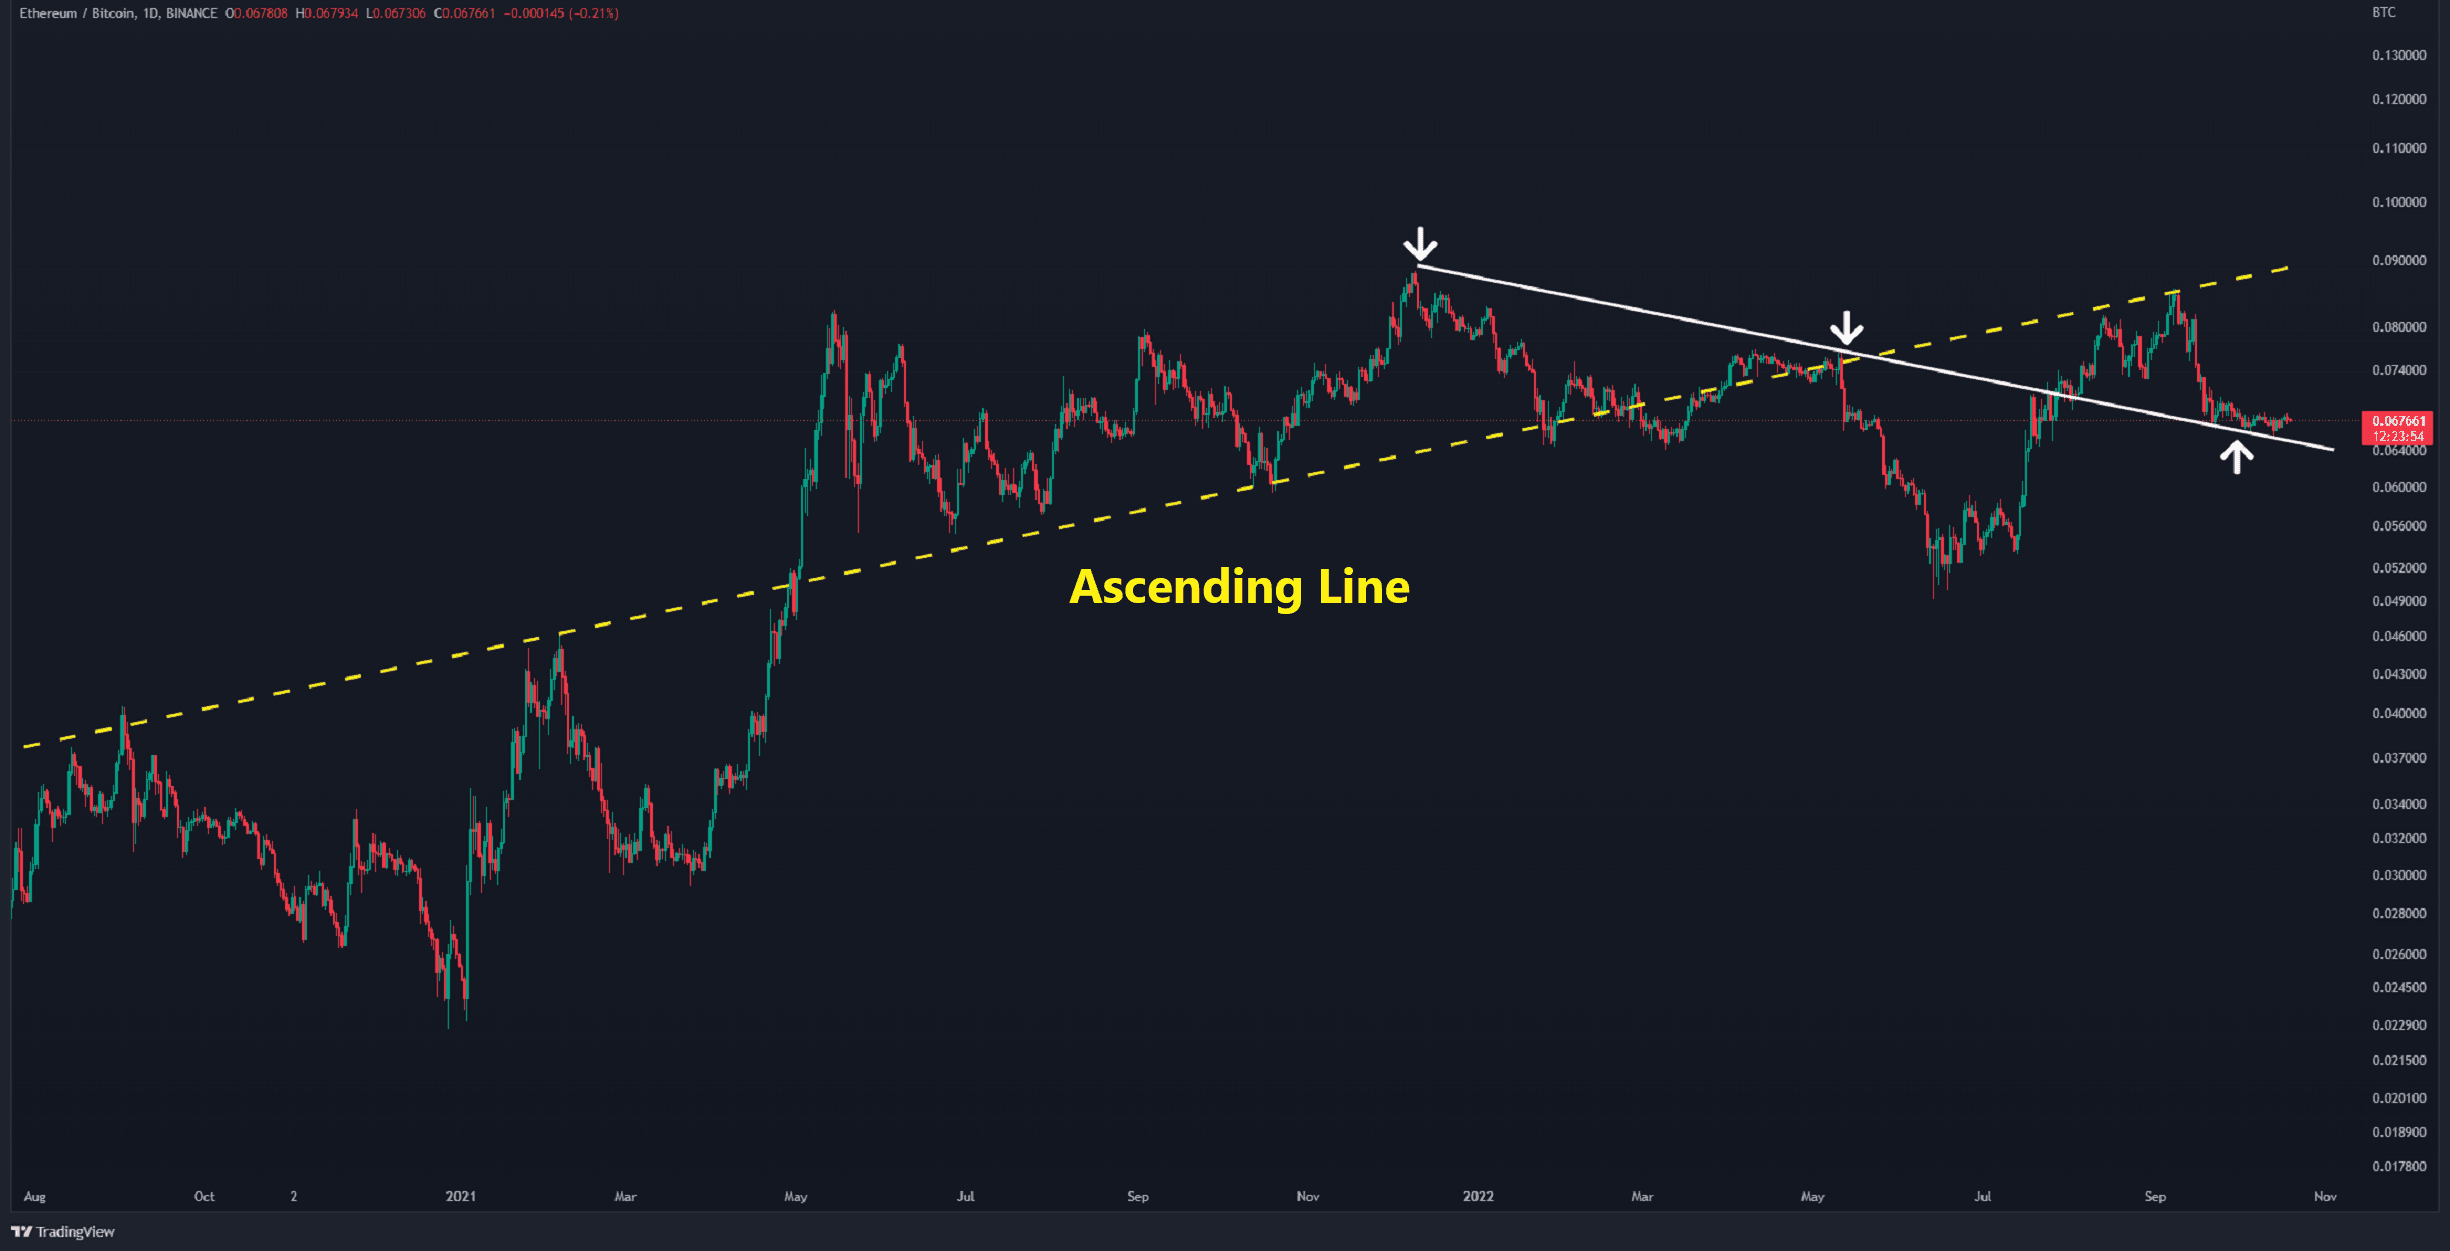
The ETH/BTC Chart
Against Bitcoin, the descending line (in white) acts as support. It has served as a deterrent to dips in the price three times in the last month.
The critical level on this chart, however, is the horizontal support at 0.065 BTC. If the pair breaks and closes below this level, it will be ready to test 0.06 BTC. The overall negative structure will stay in place until the price rises above the horizontal barrier of 0.073 BTC.
In this event, a bullish rally is likely to begin, retesting the highest level set in 2022 around 0.085 BTC
Key Support Levels: 0.065 & 0.06 BTC
Key Resistance Levels: 0.073 & 0.085 BTC