Bitcoin’s price continues to trade sideways as no big movements in either direction have taken place. As of this writing, the K and K levels are yet to be broken. Technical Analysis By: Edris The Daily Chart On the daily timeframe, the price recently retested the broken, bearish trendline and the K support level. These levels provided enough support to prevent another dip toward lower prices. However, the 50-day moving average located at around K is persisting as a strong obstacle and is putting the brakes on a potential rally toward the K area. The 100-day moving average can also be considered a significant dynamic resistance that could reject the price in case of a bullish breakout from the 50-day MA. Right now, a positive trend cannot be anticipated
Topics:
CryptoVizArt considers the following as important: Bitcoin (BTC) Price, BTC Analysis, btcusd, btcusdt
This could be interesting, too:
Chayanika Deka writes XRP, SOL, and ADA Inclusion in US Crypto Reserve Pushes Traders on Edge
Chayanika Deka writes Why Arthur Hayes Is Bullish on Bitcoin Under Trump’s Economic Strategy
Mandy Williams writes Why the Bitcoin Market Is Stuck—and the Key Metric That Could Change It: CryptoQuant CEO
Wayne Jones writes Metaplanet Acquires 156 BTC, Bringing Total Holdings to 2,391
Bitcoin’s price continues to trade sideways as no big movements in either direction have taken place. As of this writing, the $18K and $20K levels are yet to be broken.
Technical Analysis
By: Edris
The Daily Chart
On the daily timeframe, the price recently retested the broken, bearish trendline and the $18K support level. These levels provided enough support to prevent another dip toward lower prices. However, the 50-day moving average located at around $19K is persisting as a strong obstacle and is putting the brakes on a potential rally toward the $24K area.
The 100-day moving average can also be considered a significant dynamic resistance that could reject the price in case of a bullish breakout from the 50-day MA. Right now, a positive trend cannot be anticipated before a break above these two levels and, eventually, the $24K static resistance.
So, although the market has broken above the long-term bearish trendline, the continuation of a downtrend still remains the more probable scenario as the market structure is still far from bullish.

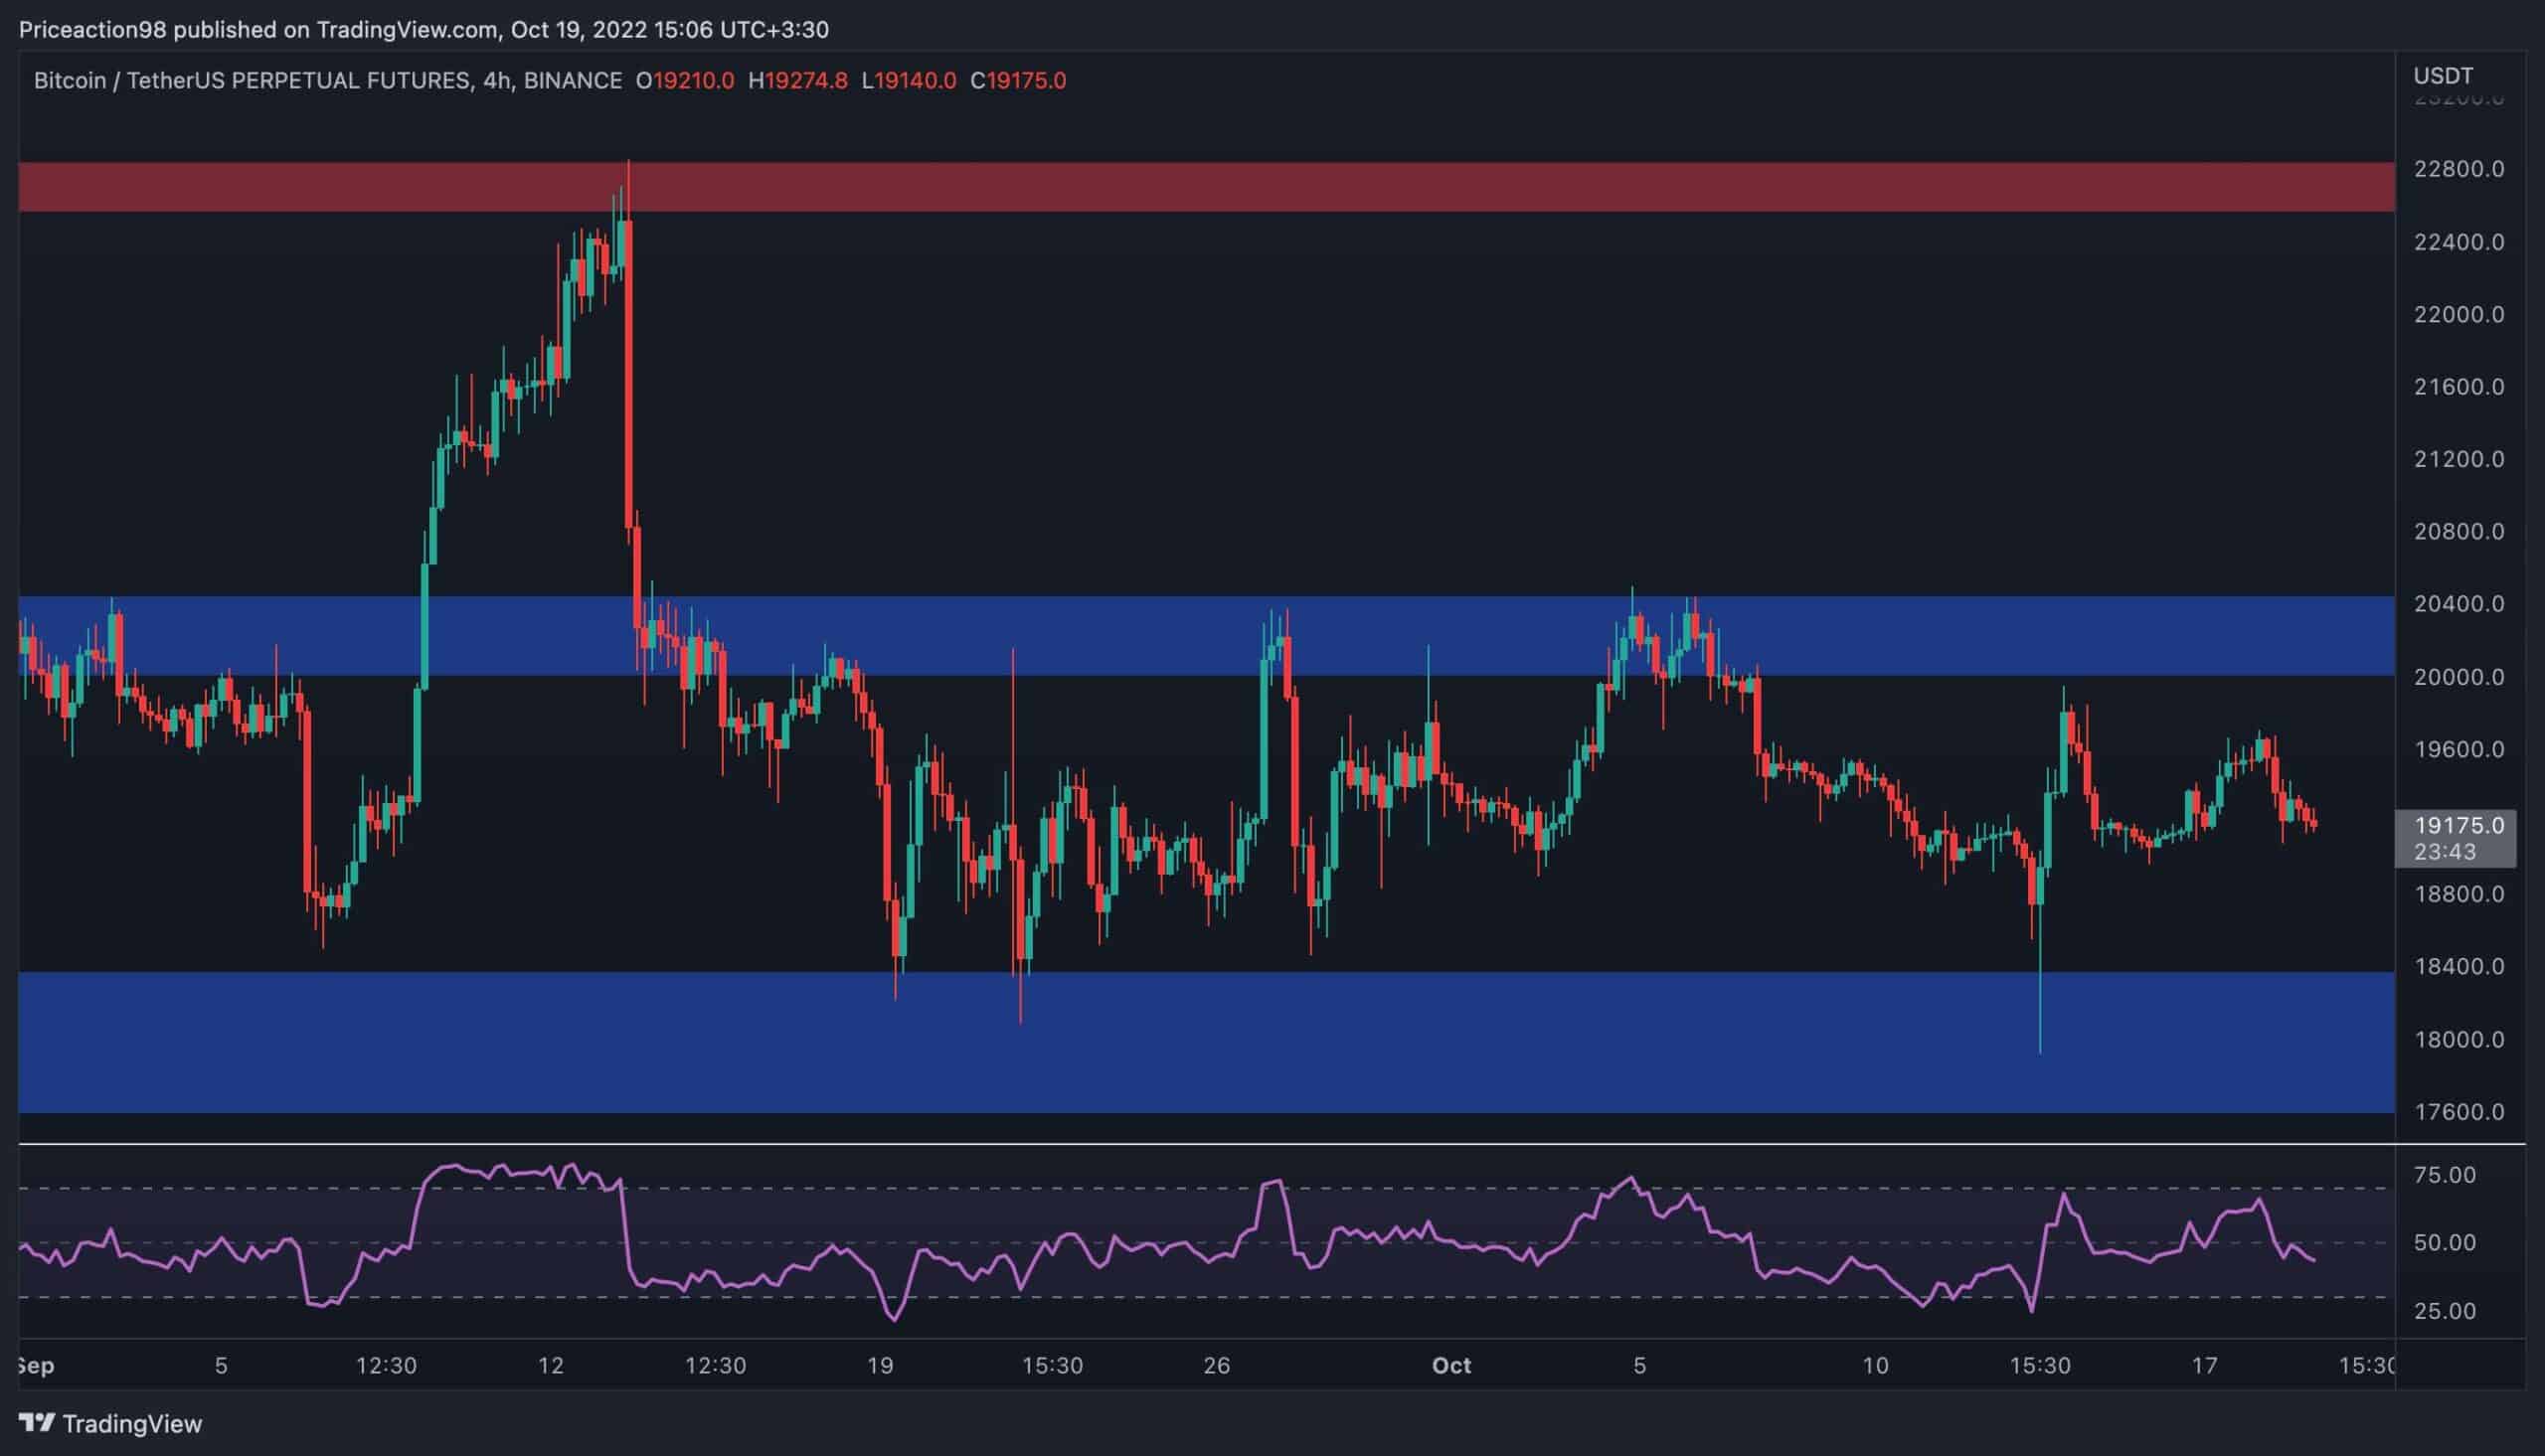
The 4-Hour Chart
On the 4-hour chart, the price action is going through an exhaustive and choppy period, and Bitcoin is still trapped in a tight range between the $20K and $18K levels.
There appears to be no intent in the market to break the above-mentioned range to either side, and no clear price action pattern is forming to offer a clue on the short-term direction. The RSI indicator is also showing values around 50%, suggesting that the momentum is in a state of equilibrium in this timeframe.
All in all, a breakout above the $20K level could initiate a rally towards the $22,500 mark and, eventually, the $24K level.
On the other hand, a bearish breakout from the $18K support level might prove disastrous, as it would pave the way for an even deeper drop and further elongate the bear market.
Onchain Analysis
By Shayan
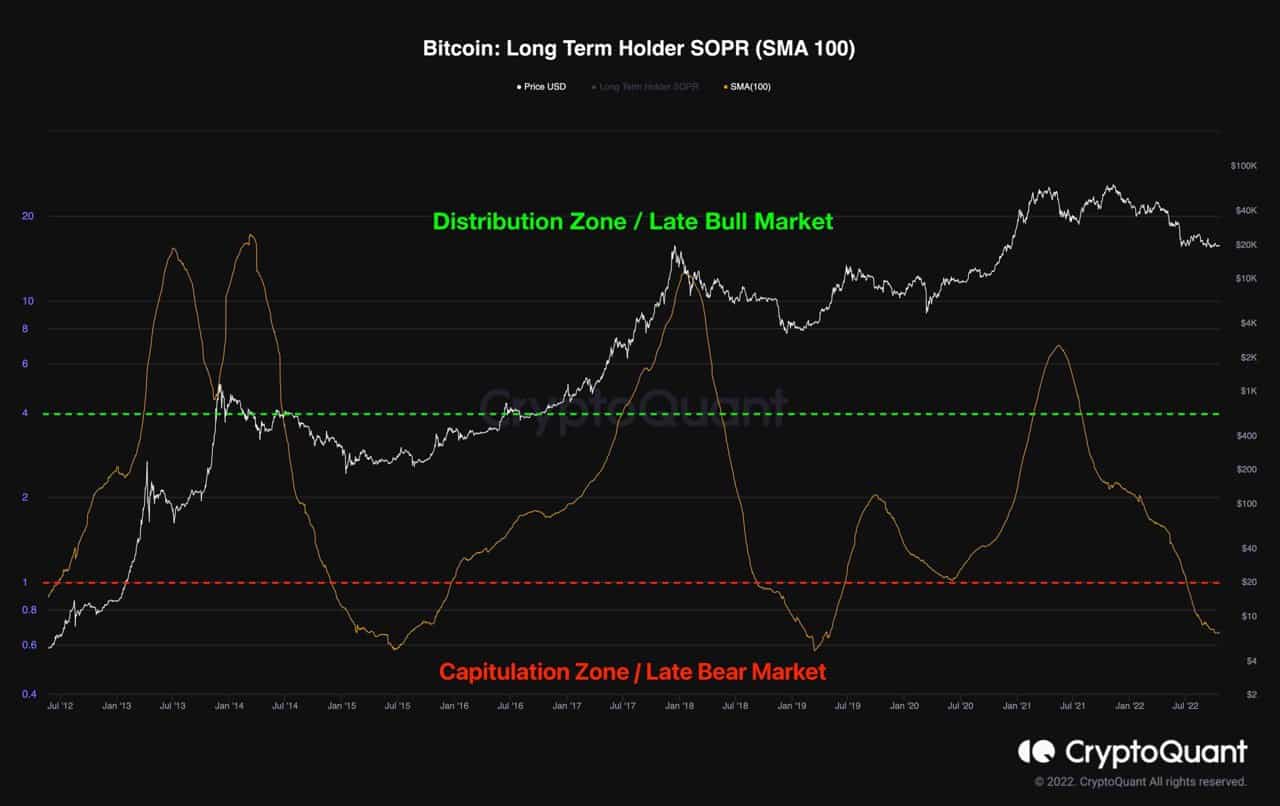
Long-Term Holder SOPR (SMA 100)
The crypto market typically finds its bottom when huge losses are imposed on market participants, signaling what is referred to as “Capitulation.” In the Bitcoin market, there is a great deal of focus on the capitulation of short-term holders, as it helps to determine local bottoms during a long-term bullish trend.
However, short-term holders’ capitulation is not a very helpful indicator during the bearish stage of the market, as most of the supply is kept by long-term holders. So, tracking their behavior should help analysts anticipate the direction.
The chart below illustrates the 100-day moving average of the long-term holders’ SOPR – a metric that calculates the profits/losses realized by this cohort.
During previous bear markets, a prolonged period of long-term holders’ capitulation ensued as these participants realized their losses.
Currently, the long-term holders are going through a significant capitulation phase. They have been selling at a loss, implying that the smart money accumulation phase had begun.