Yesterday, much like the stock markets, cryptocurrencies had rough times. Ethereum lost about 9% of its value, and the bears pushed the price toward the support at ,800. Technical Analysis By Grizzly The Daily Chart On the daily timeframe, Ethereum entered a correction phase after failing to break the barrier of Fibonacci Retracement at 0.618. It is currently forming a bullish pattern with the formation of higher highs and lows. However, the main question is whether the bears would allow the support at 00 to be considered a higher low? If this happens, a retest of the horizontal resistance in the range of 00-00 would be slightly more probable. Breaking it and forming another higher high could push the price to 00. The downtrend momentum seems to have somewhat
Topics:
CryptoVizArt considers the following as important: ETH Analysis, ETHBTC, Ethereum (ETH) Price, ethusd
This could be interesting, too:
Mandy Williams writes Ethereum Derivatives Metrics Signal Modest Downside Tail Risk Ahead: Nansen
Jordan Lyanchev writes Weekly Bitcoin, Ethereum ETF Recap: Light at the End of the Tunnel for BTC
CryptoVizArt writes Will Weak Momentum Drive ETH to .5K? (Ethereum Price Analysis)
Jordan Lyanchev writes Bybit Hack Fallout: Arthur Hayes, Samson Mow Push for Ethereum Rollback
Yesterday, much like the stock markets, cryptocurrencies had rough times. Ethereum lost about 9% of its value, and the bears pushed the price toward the support at $2,800.
Technical Analysis
By Grizzly
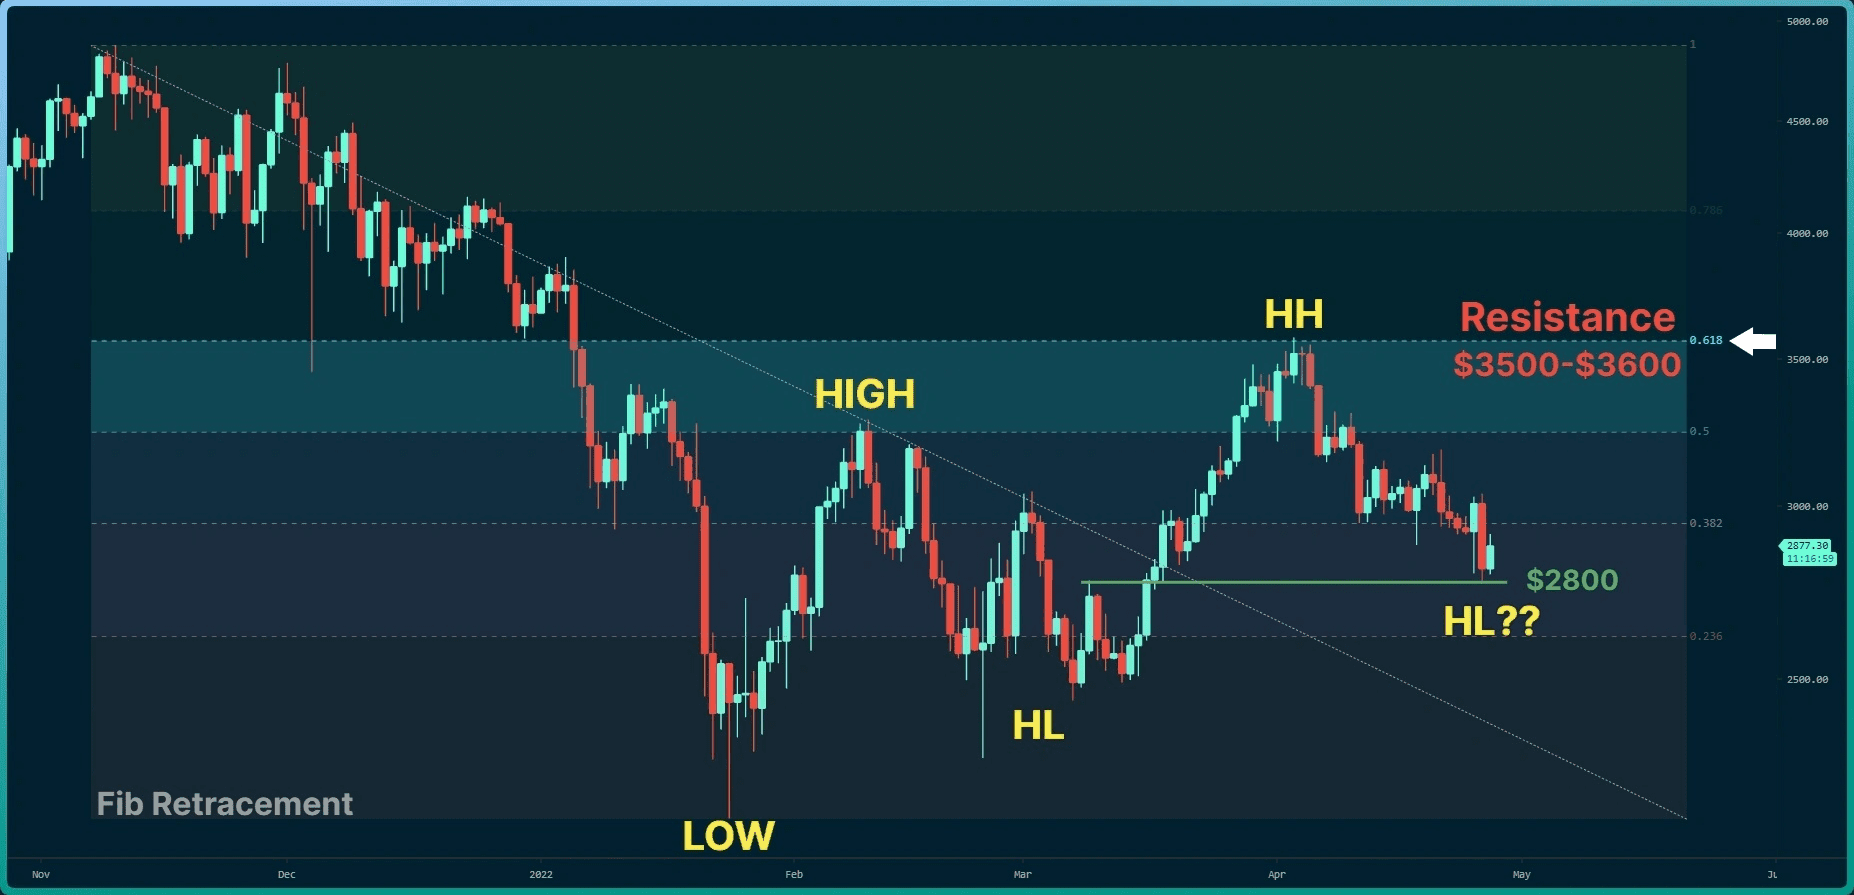
The Daily Chart
On the daily timeframe, Ethereum entered a correction phase after failing to break the barrier of Fibonacci Retracement at 0.618. It is currently forming a bullish pattern with the formation of higher highs and lows. However, the main question is whether the bears would allow the support at $2800 to be considered a higher low?
If this happens, a retest of the horizontal resistance in the range of $3500-$3600 would be slightly more probable. Breaking it and forming another higher high could push the price to $4000. The downtrend momentum seems to have somewhat eased, and sellers are gradually losing power although still holding the upper hand.
Support Key Levels: $2500 & $2300
Resistance Key Levels: $3300 & $3600
Moving Averages:
MA20: $3030
MA50: $3036
MA100: $2907
MA200: $3470
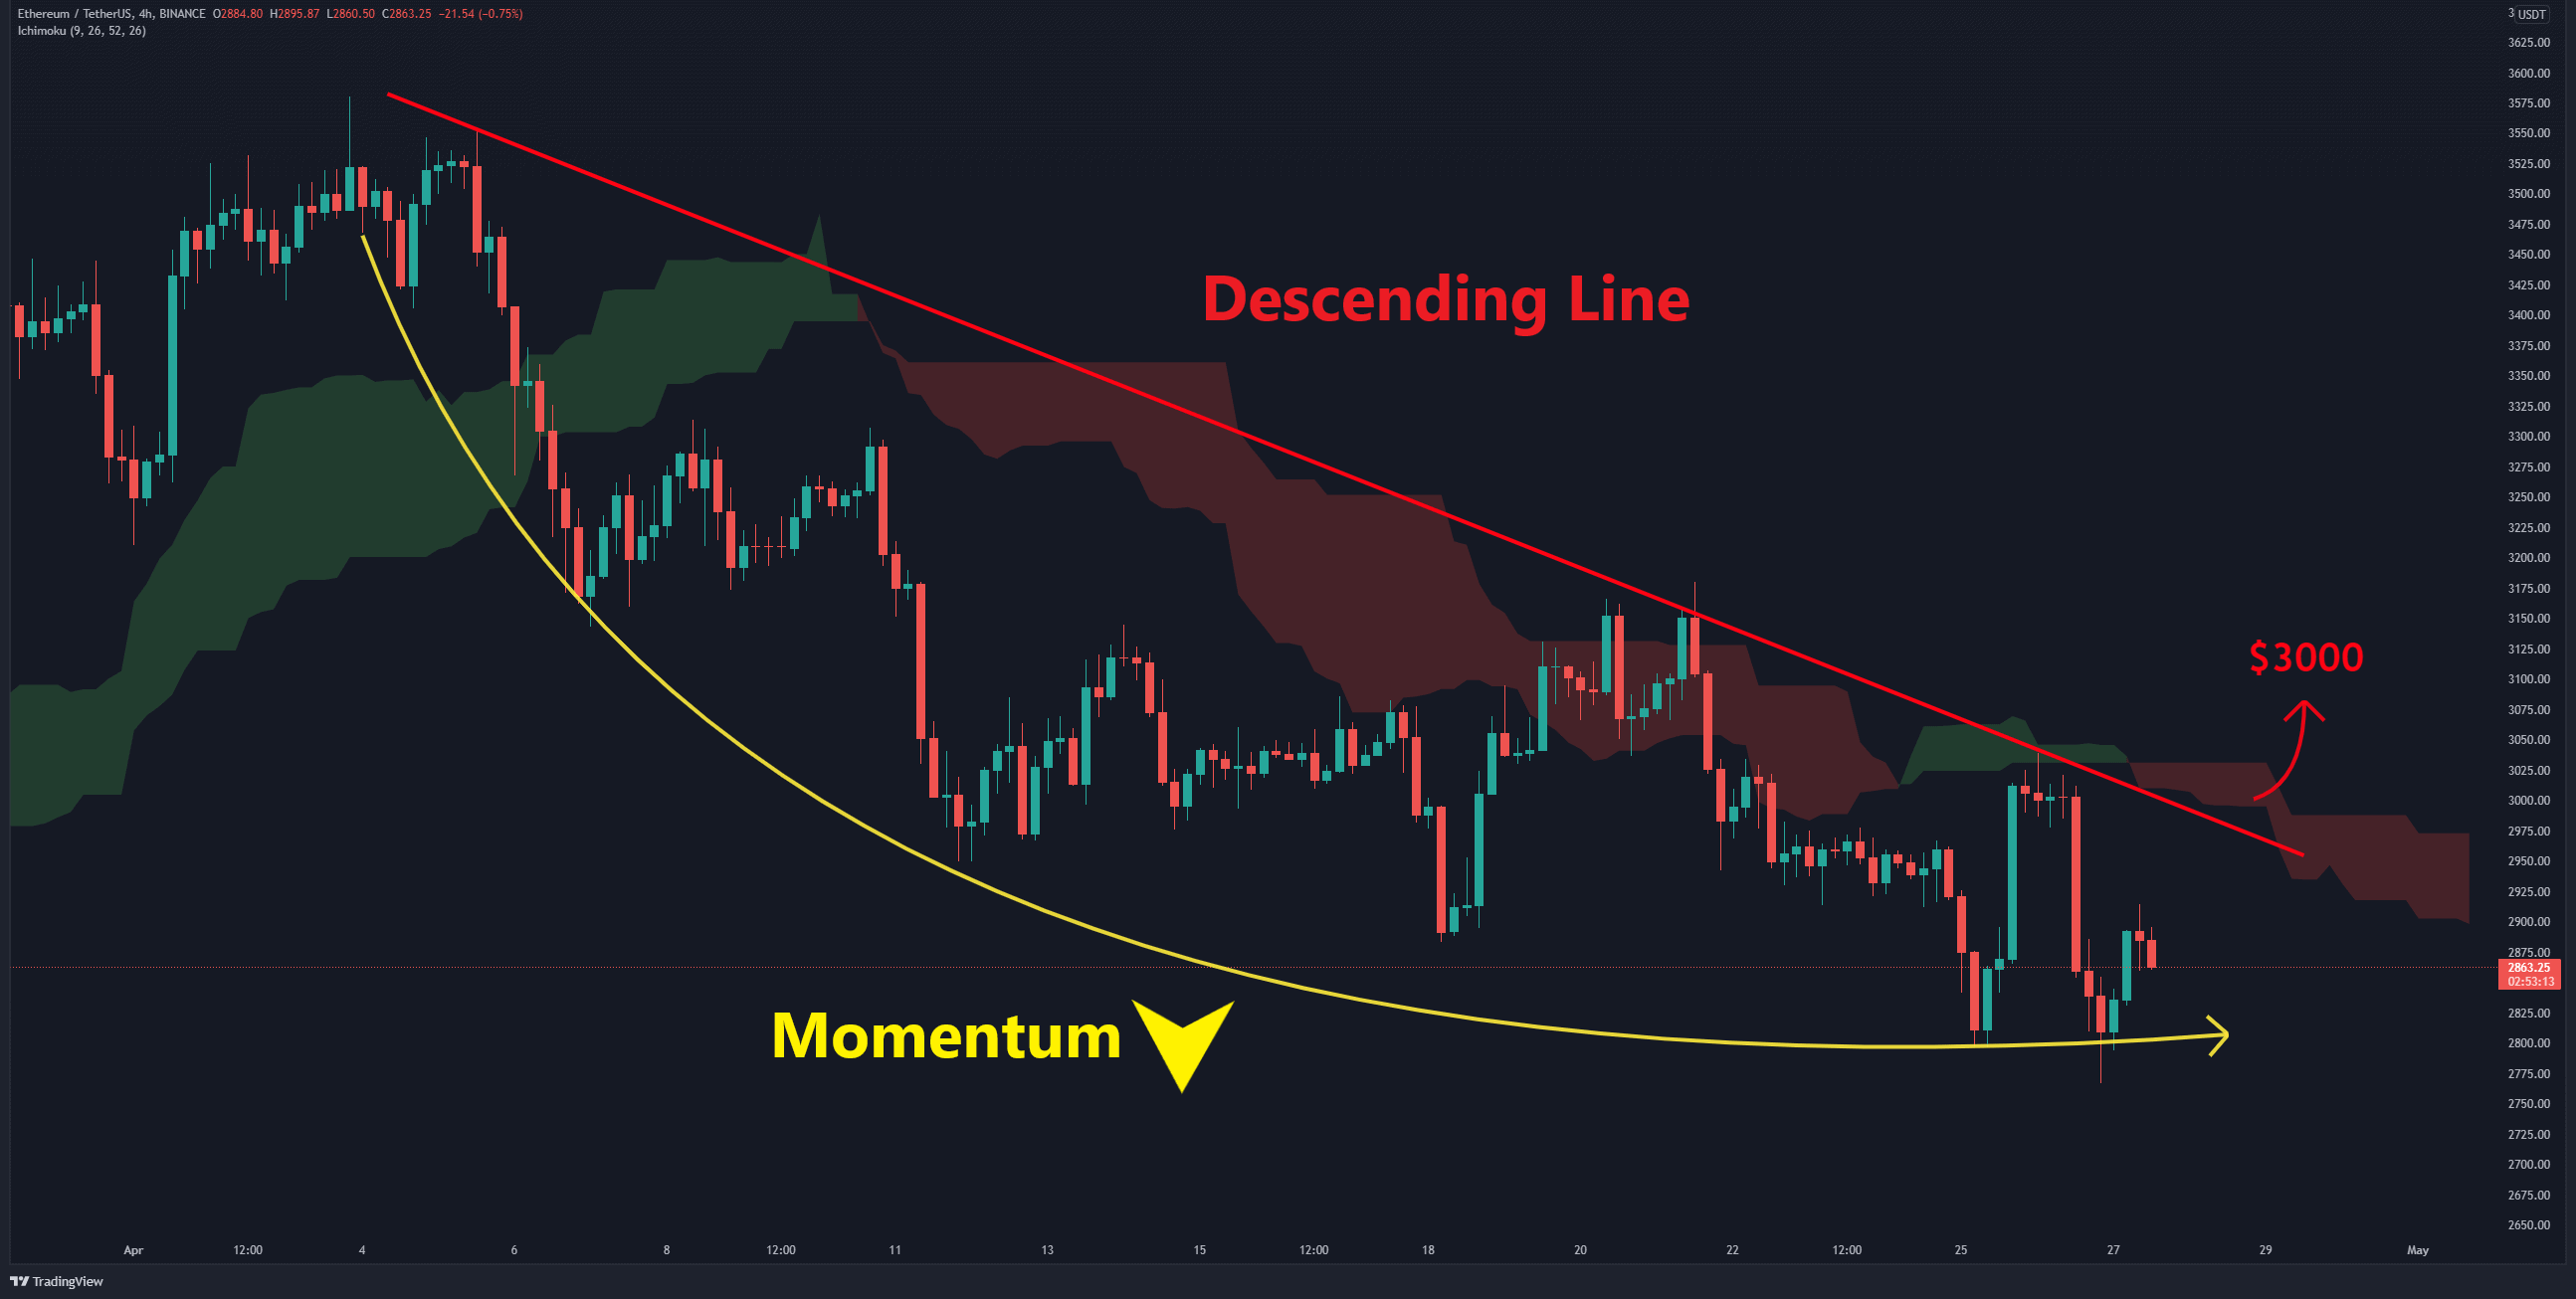
The 4-Hour Chart
On the 4-hour timeframe, ETH is trading below the descending line (marked red) and the Ichimoku Cloud, which acts as a resistance. What is remarkable is that the downward momentum in this timeframe gradually decreases. If ETH can hold support at $2800 and build a higher high in this zone, one can expect the bulls to retest the resistance at $3000, which is the main barrier in the lower timeframe.
On-chain- analysis
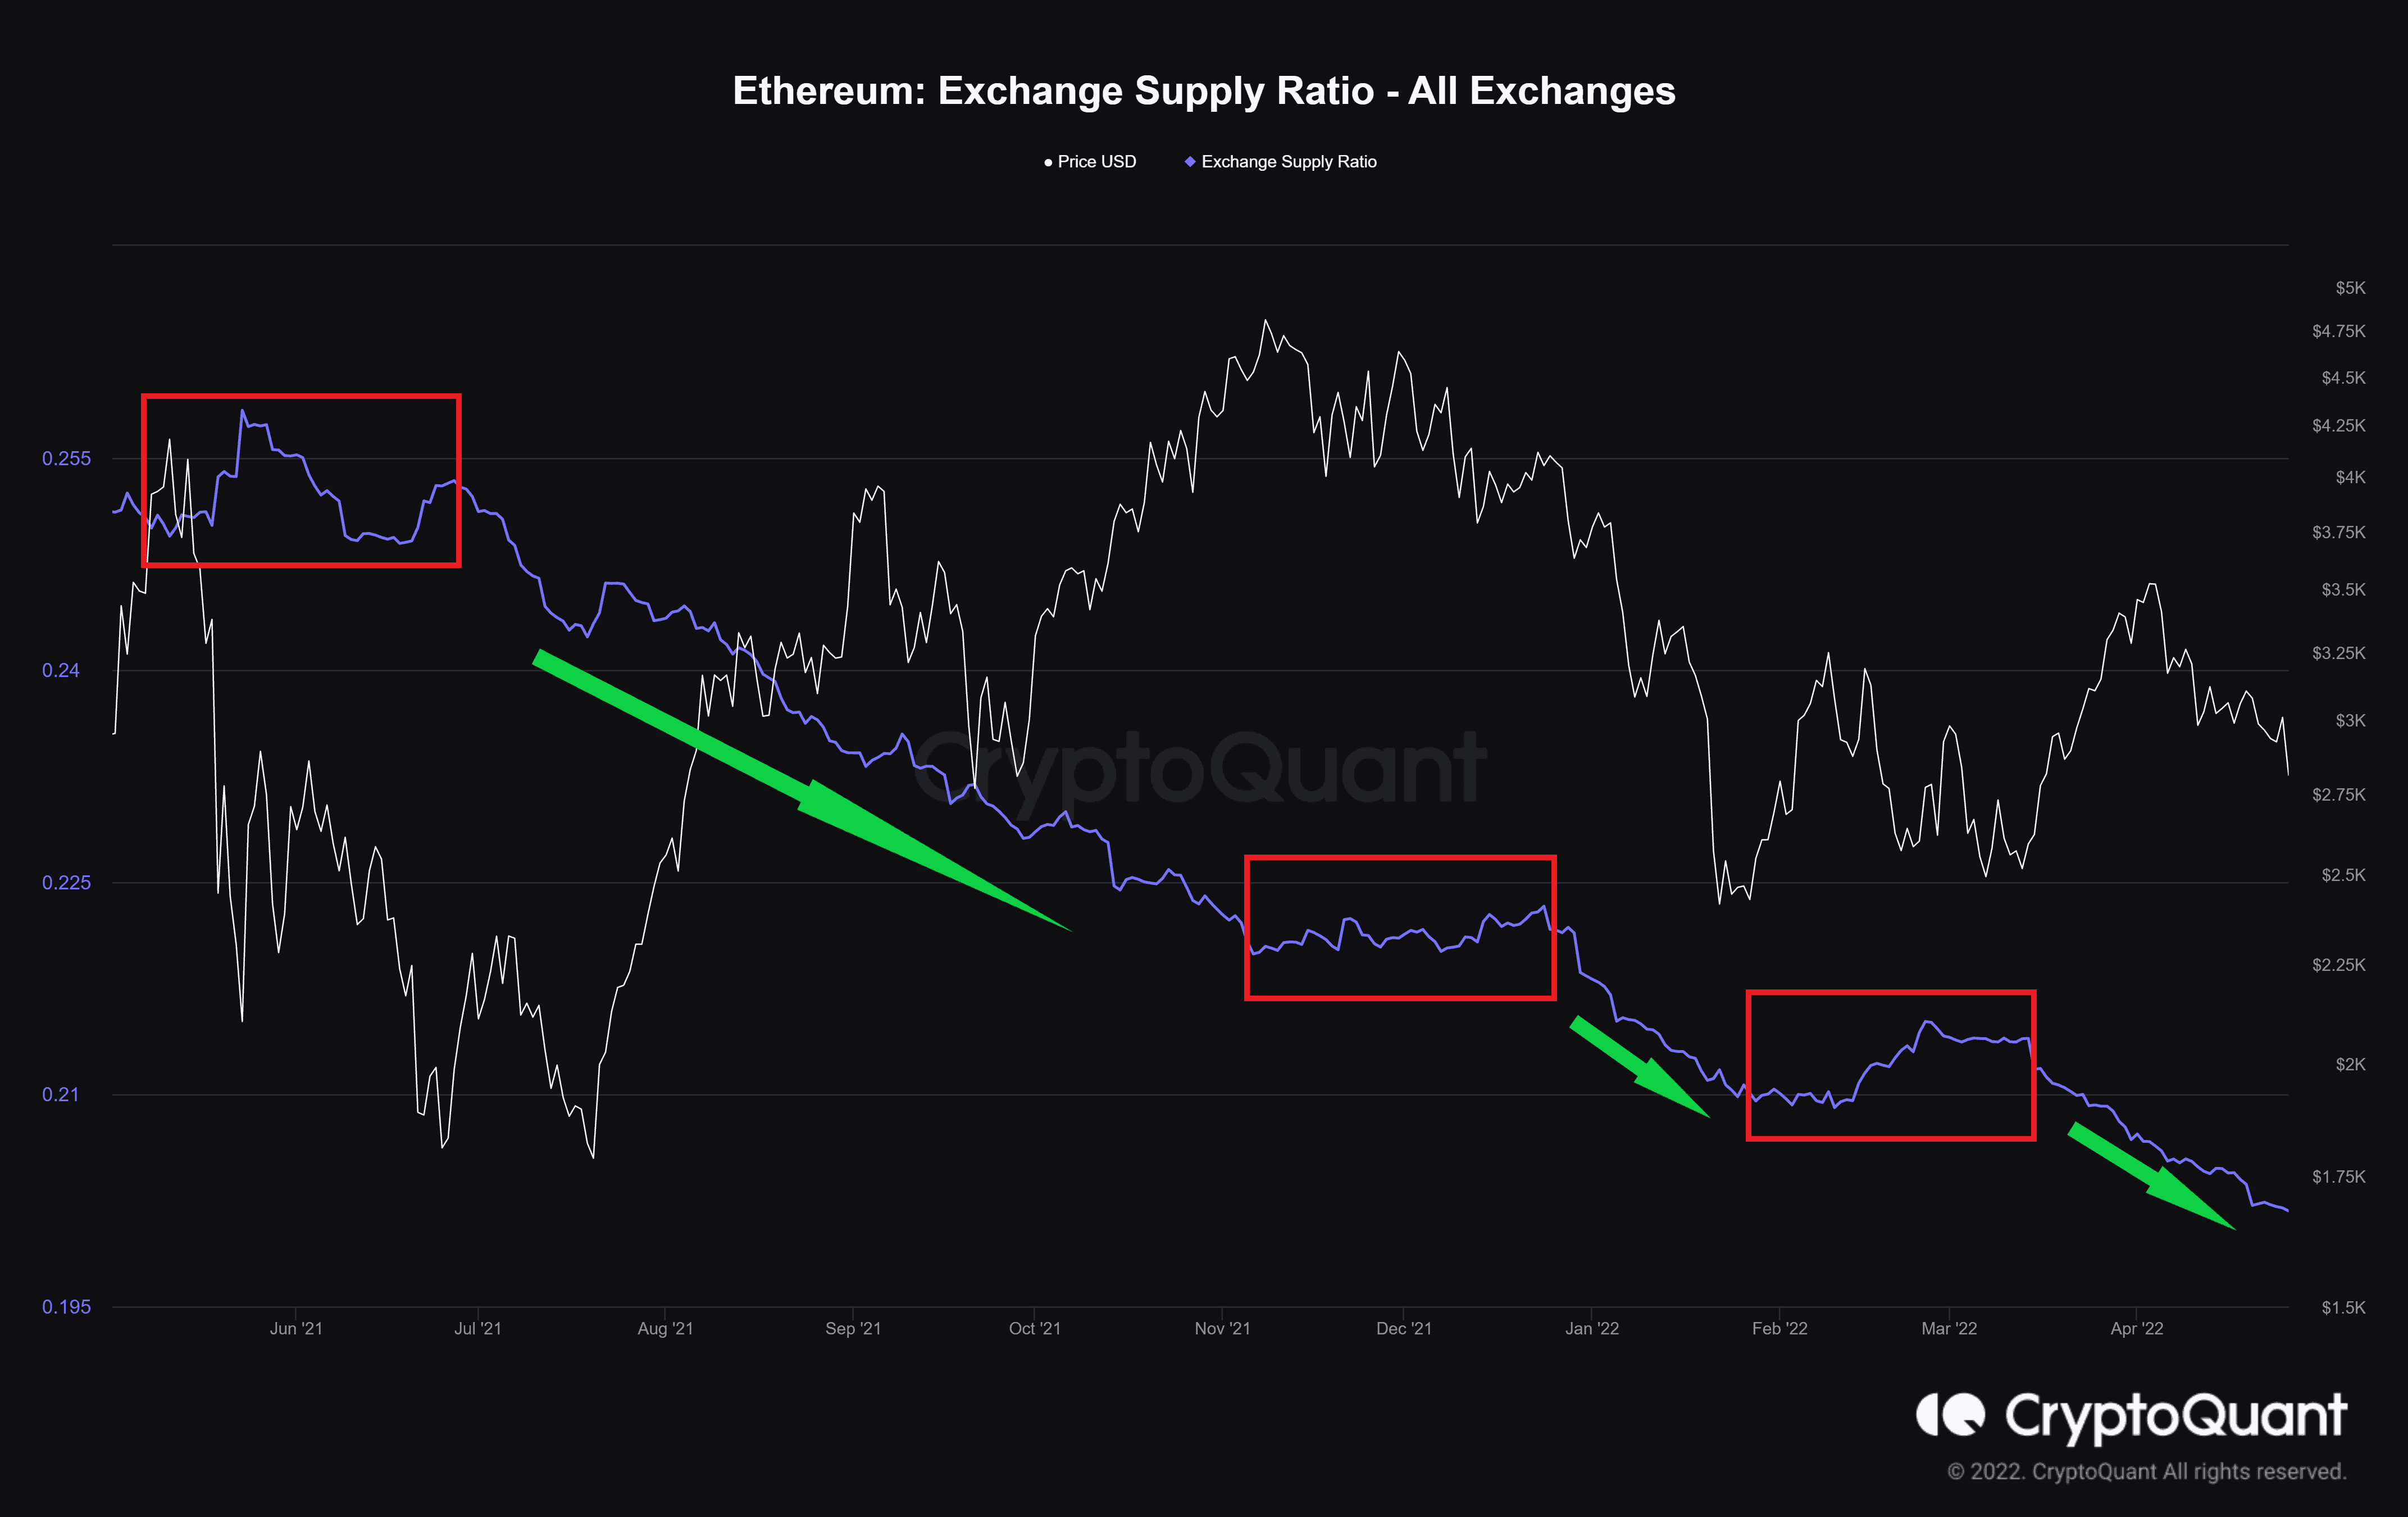
Exchange Supply Ratio
Exchange Supply Ratio is calculated as the exchange reserve divided by the total supply for a specific asset such as bitcoin.
As it is shown in the chart, despite the price decreases, this metric continues the downward trend, which we have already seen in the past uptrends. There is currently no sign of investors’ willingness to deposit their tokens into exchanges.