Following a drop to a 3.5-week lohasETH had seen a slight recovery in today’s market action as the price is struggling to maintain above Now of now, all eyes are on the support, which lies on yesterday’s low at 00, where lies the 50-day moving average line. Technical Analysis By: Grizzly The Daily Chart The ETH/USDT trading pair could not avoid the recent crypto correction, which triggered a rapid downward move from around ,000, which was recorded just a week ago. Ethereum is in a position for further gains so long as the bulls don’t allow prices to slip below the mentioned key support. Therefore, From the bullish side, if ETH maintains this level, ETH’s further targets lie around the horizontal resistance at ,200, which intersects with the resistance of the
Topics:
CryptoVizArt considers the following as important: ETH Analysis, ETHBTC, Ethereum (ETH) Price, ethusd
This could be interesting, too:
Mandy Williams writes Ethereum Derivatives Metrics Signal Modest Downside Tail Risk Ahead: Nansen
Jordan Lyanchev writes Weekly Bitcoin, Ethereum ETF Recap: Light at the End of the Tunnel for BTC
CryptoVizArt writes Will Weak Momentum Drive ETH to .5K? (Ethereum Price Analysis)
Jordan Lyanchev writes Bybit Hack Fallout: Arthur Hayes, Samson Mow Push for Ethereum Rollback
Following a drop to a 3.5-week lohasETH had seen a slight recovery in today’s market action as the price is struggling to maintain above Now of now, all eyes are on the support, which lies on yesterday’s low at $1500, where lies the 50-day moving average line.
Technical Analysis
By: Grizzly
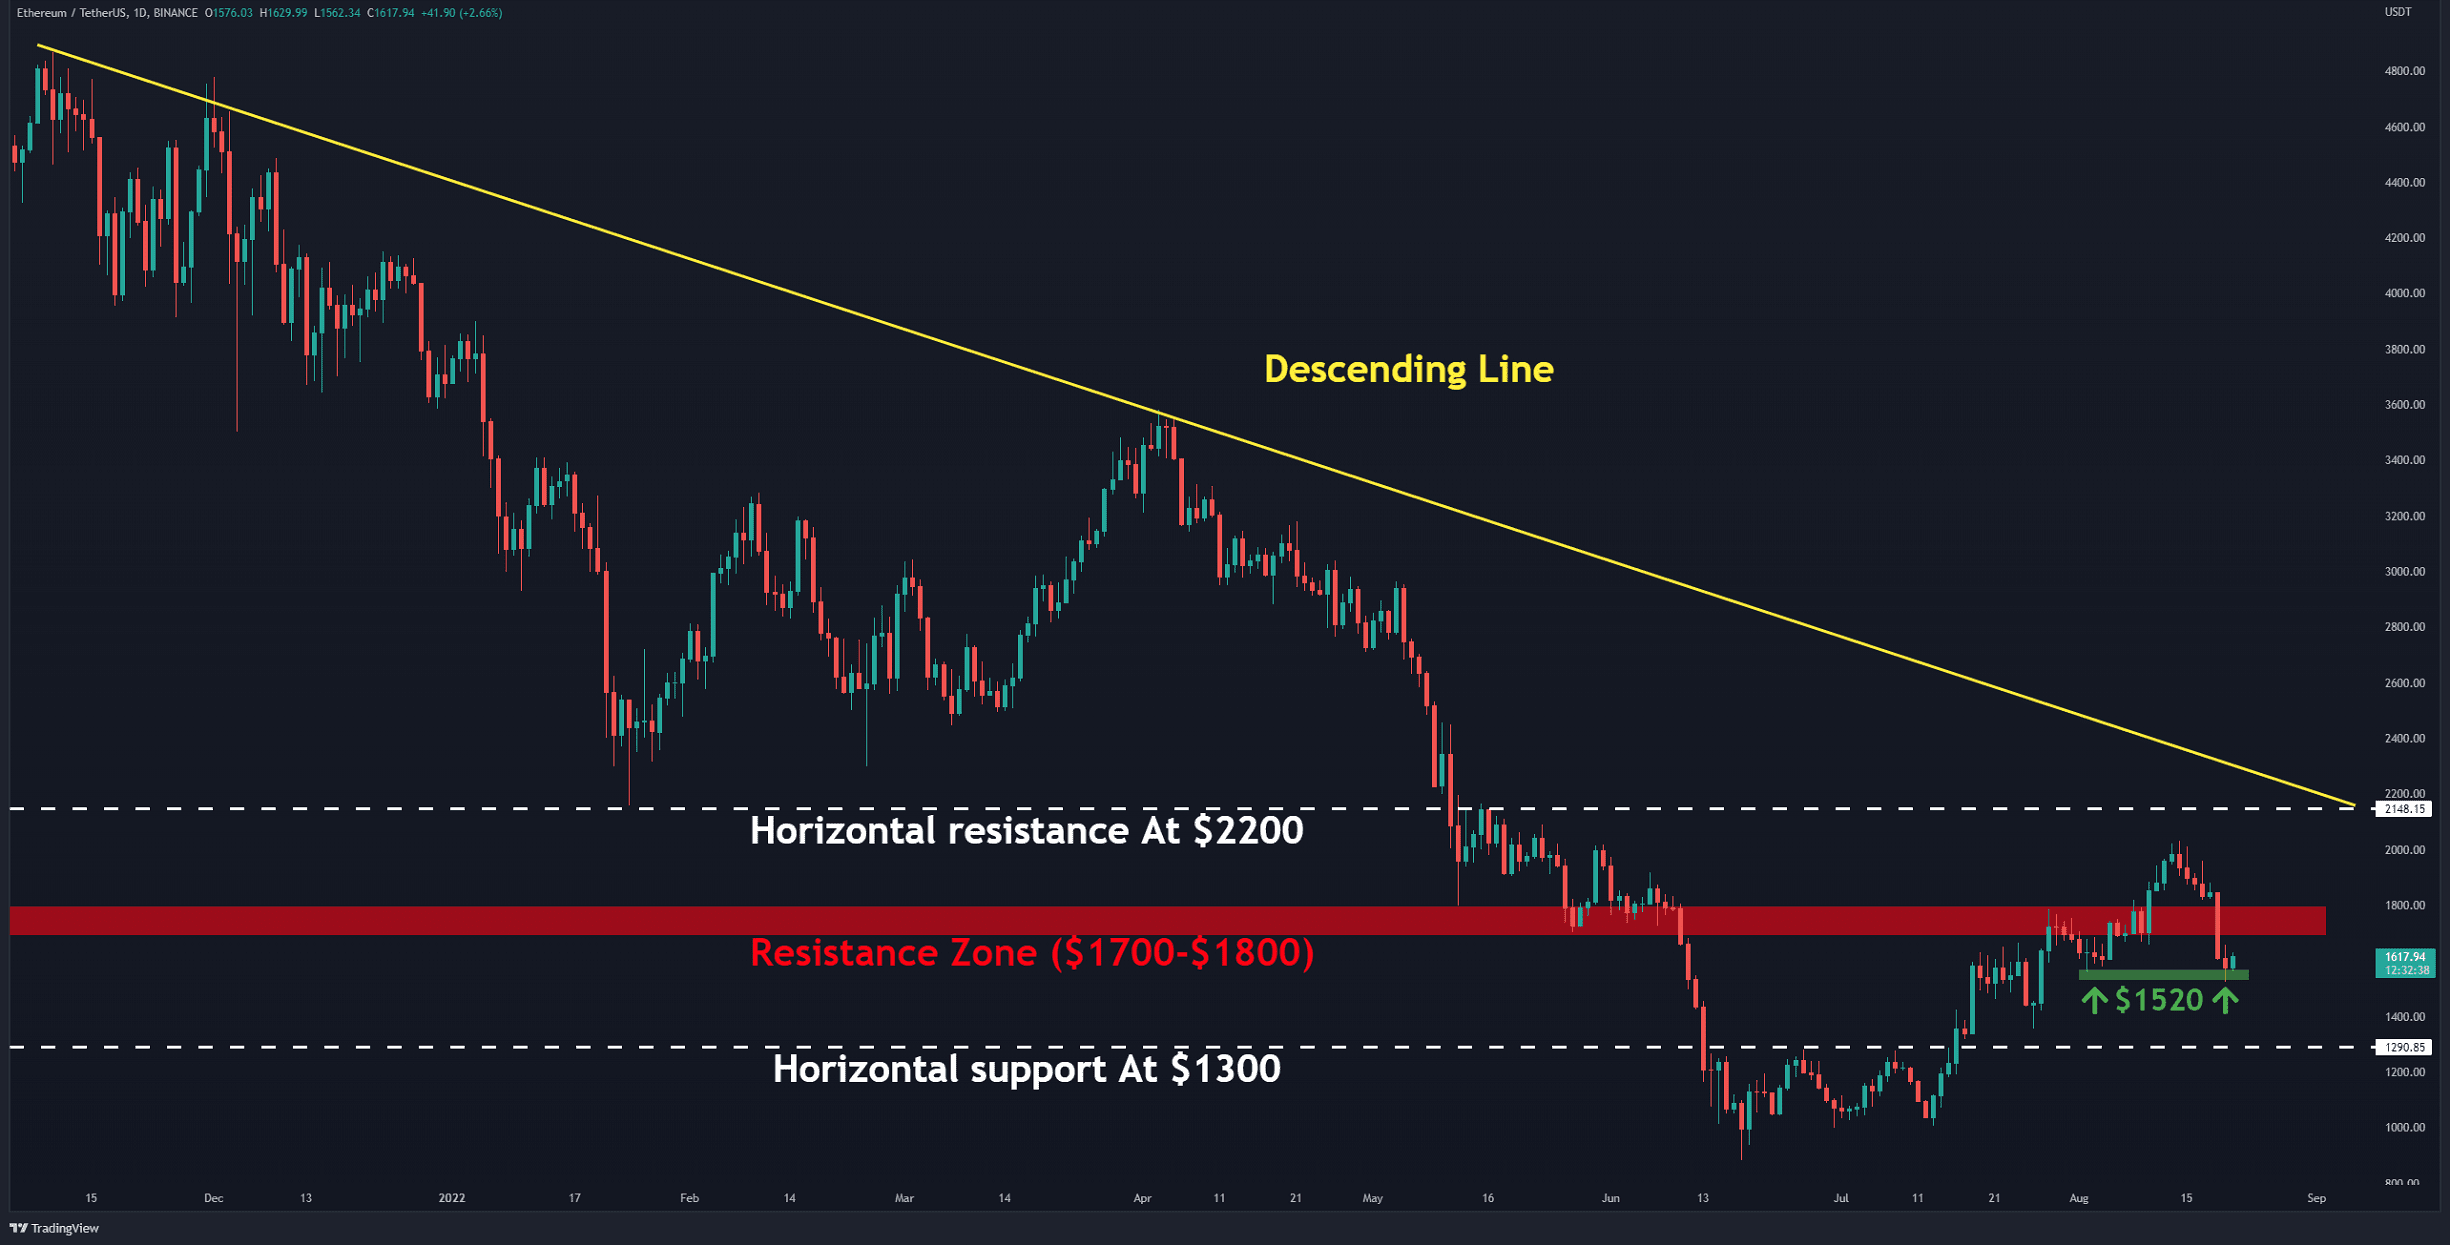
The Daily Chart
The ETH/USDT trading pair could not avoid the recent crypto correction, which triggered a rapid downward move from around $2,000, which was recorded just a week ago.
Ethereum is in a position for further gains so long as the bulls don’t allow prices to slip below the mentioned key support. Therefore,
From the bullish side, if ETH maintains this level, ETH’s further targets lie around the horizontal resistance at $2,200, which intersects with the resistance of the descending line (in yellow).
Conversely, a drop below $1500 will likely cause ETH to retest lower targets, such as $1,300. This will also mean a higher low for ETH, which is textbook bearish.
Key Support Levels: $1500 & $1300
Key Resistance Levels: $1700 & $2000
Daily Moving Averages:
MA20: $1767
MA50: $1539
MA100: $1557
MA200: $2225
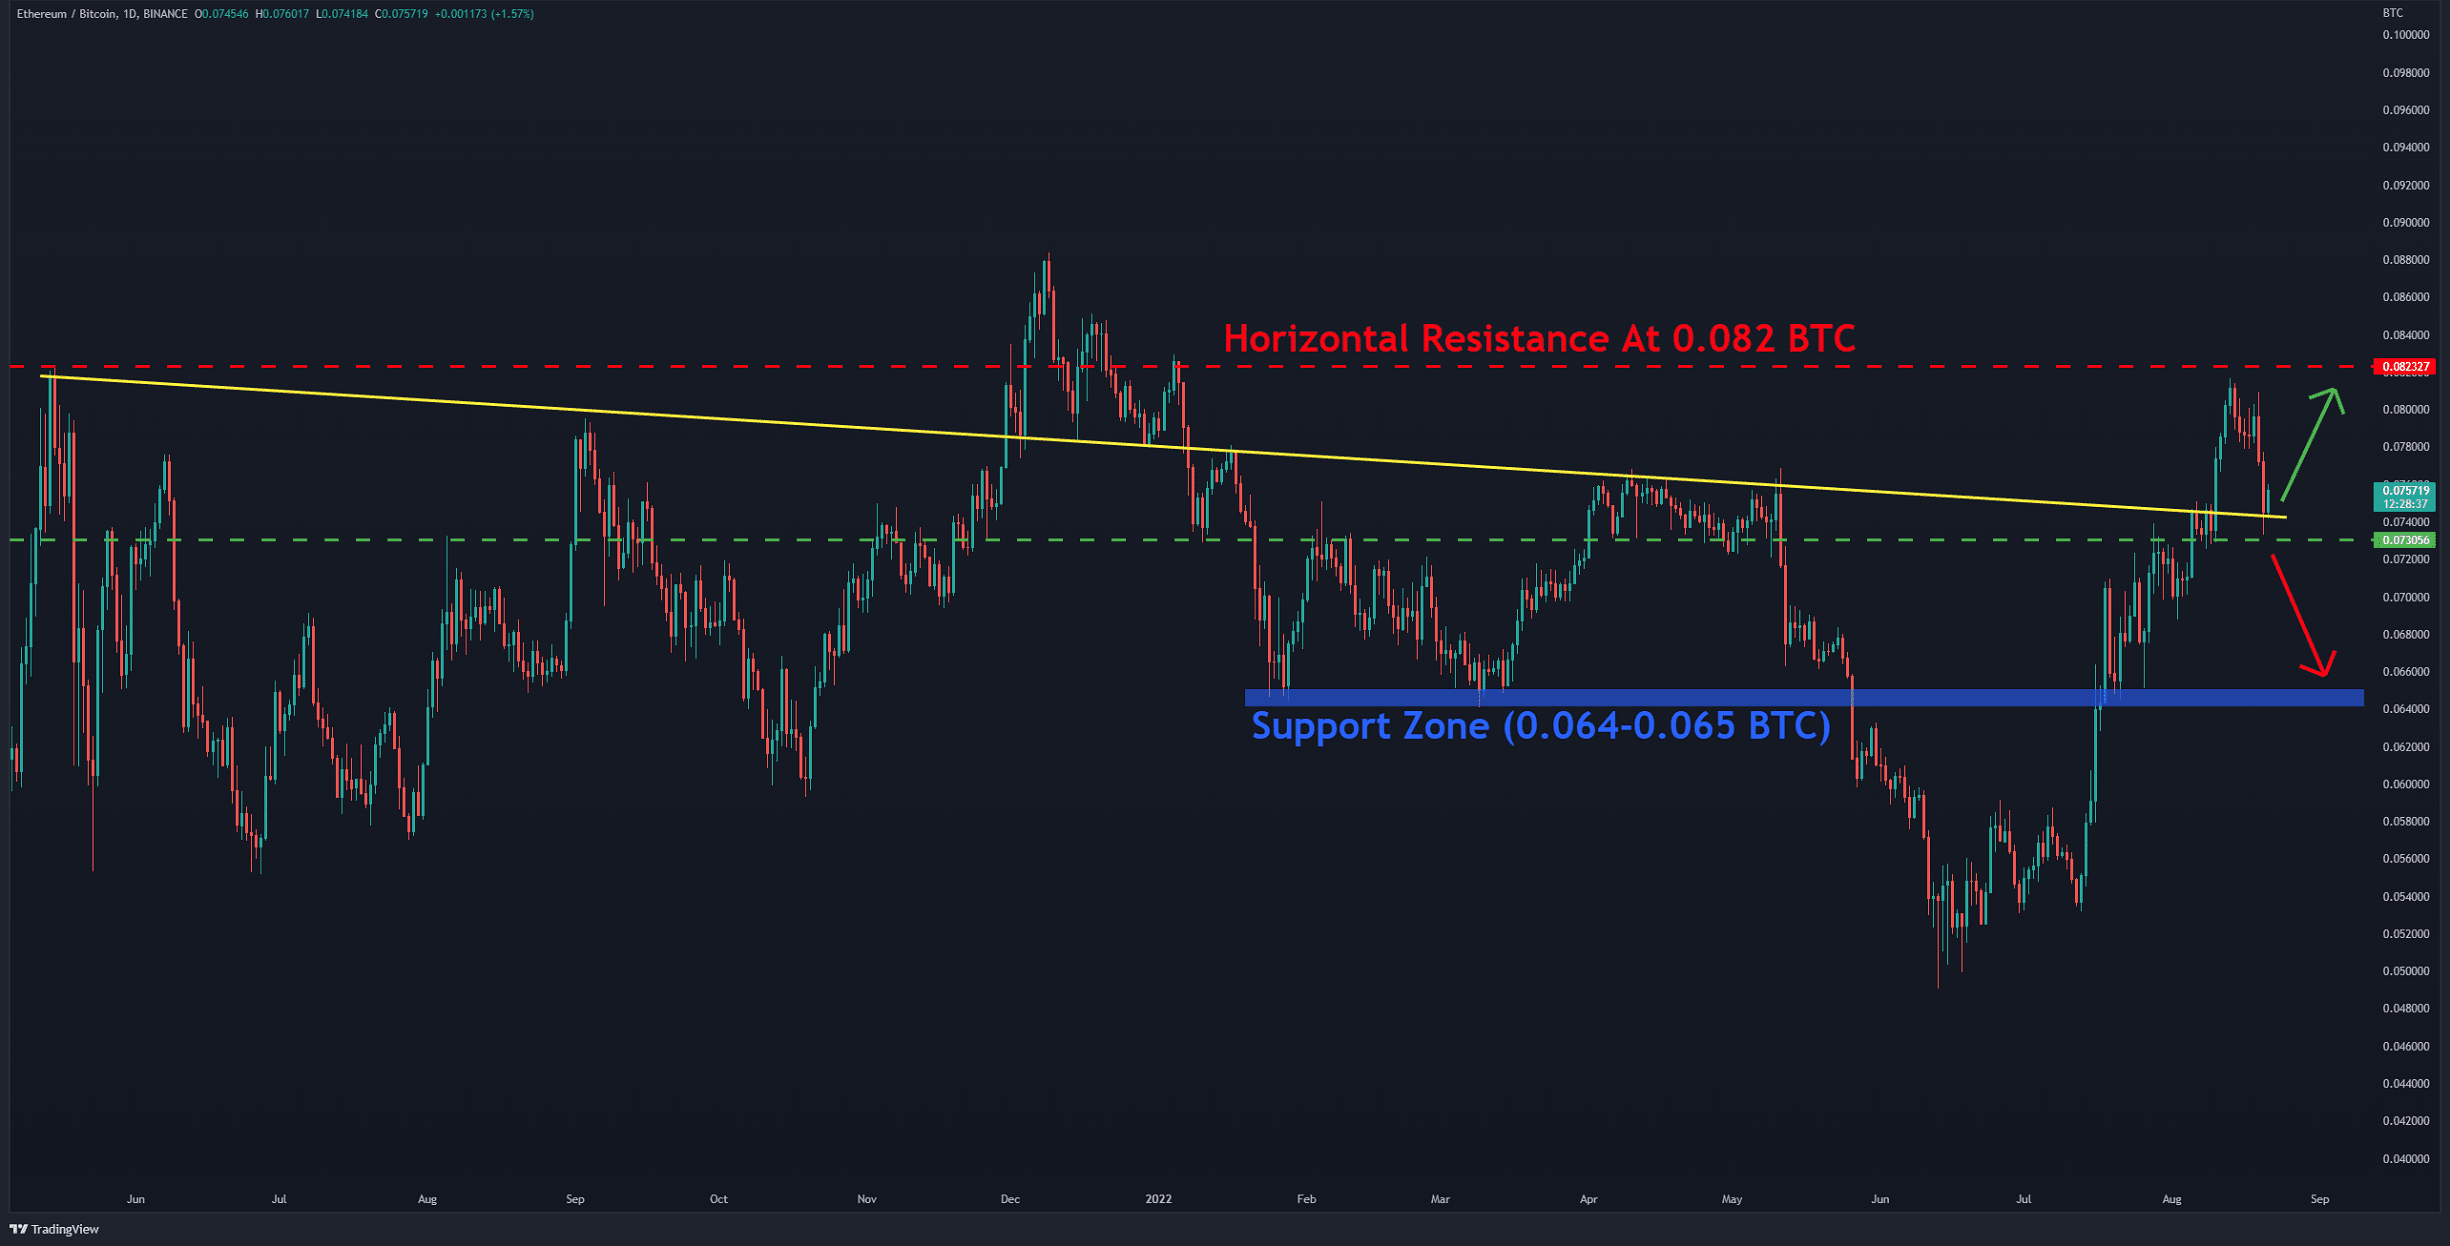
The ETH/BTC Chart
Against Bitcoin, ETH is experiencing a pullback to the descending line (in yellow). This line overlaps with the horizontal resistance at 0.073 BTC (in green). A break and close below this zone can signal further downside action, with a possible target around 0.065 BTC (in blue).
However, if we speculate that the bulls overpower the bears in this area, the overhead resistance at 0.082 BTC (in red) is expected to be retested.
Key Support Levels: 0.0.073 & 0.065 BTC
Key Resistance Levels: 0.082 & 0.088 BTC
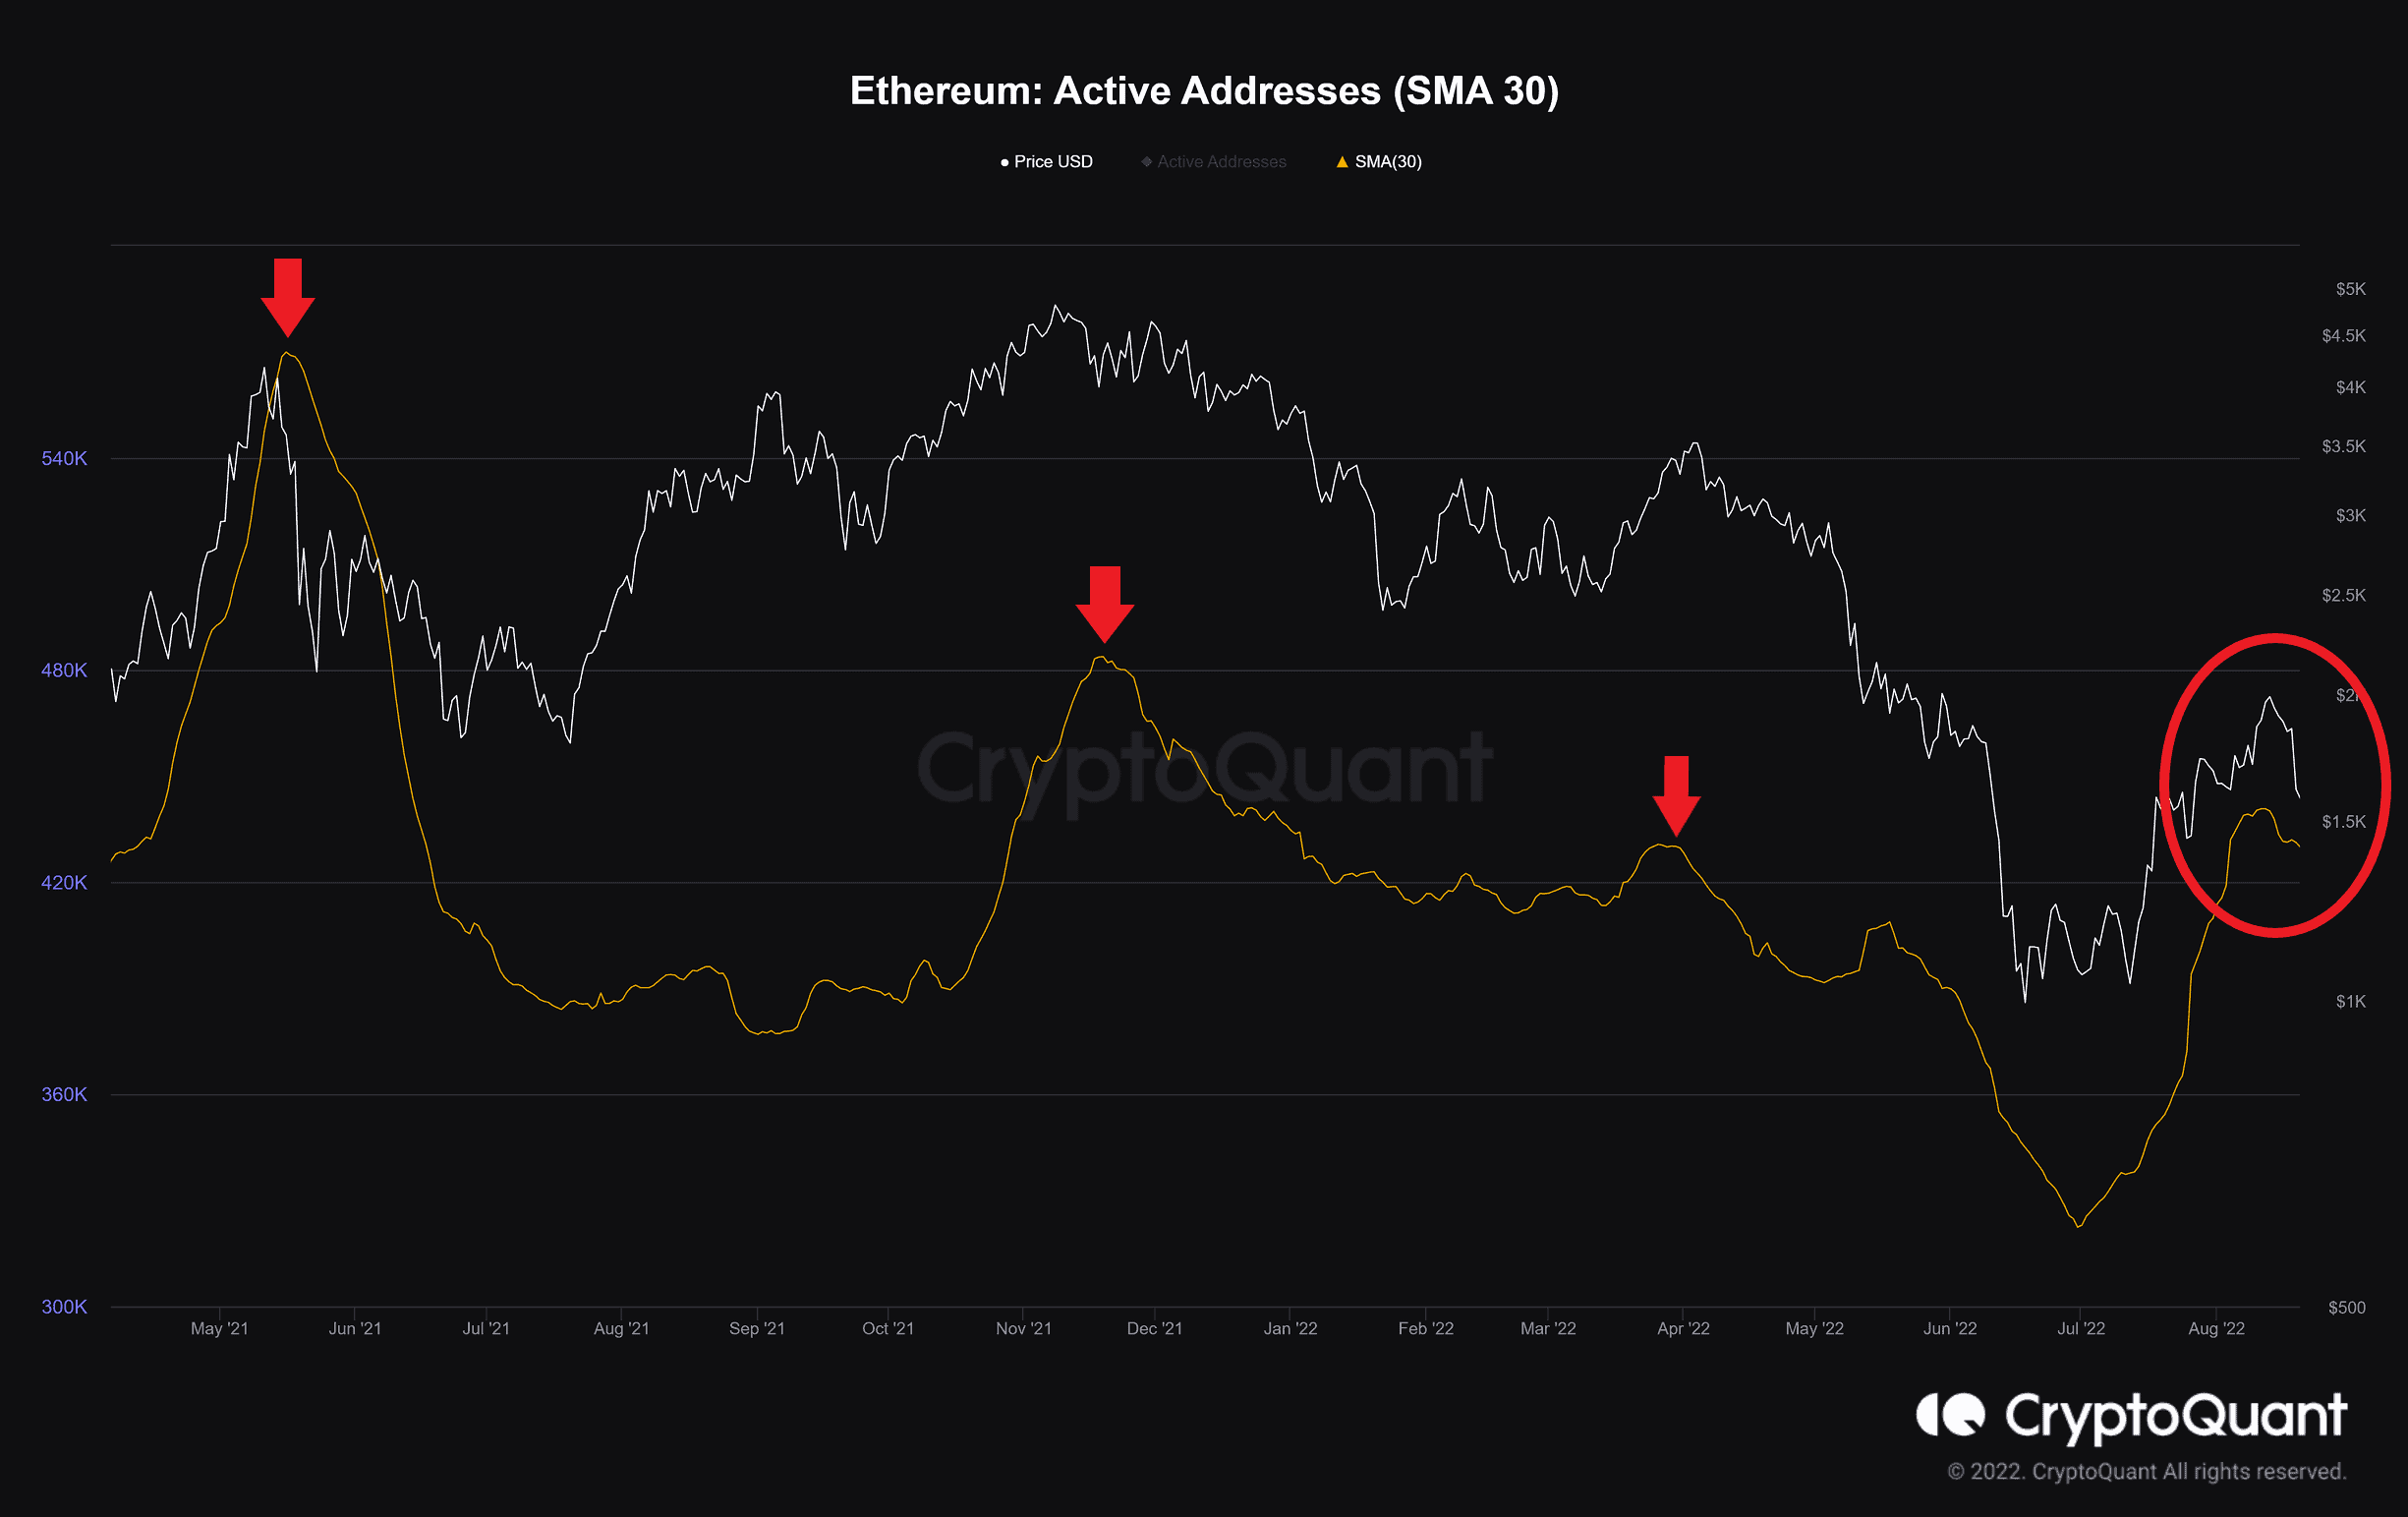
Sentiment On-Chain Analysis
Active Addresses (SMA 30): The total number of unique active addresses, including senders and receivers.
Bullish trends are often accompanied by increased on-chain activity, suggesting a healthy pattern. In the last three months, the number of active addresses increased sharply, but this growth slowed when the price reached technical resistance.
Considering the historical data as follows, if this decline in this particular metric continues, there is a possibility of touching lower levels in the price chart.