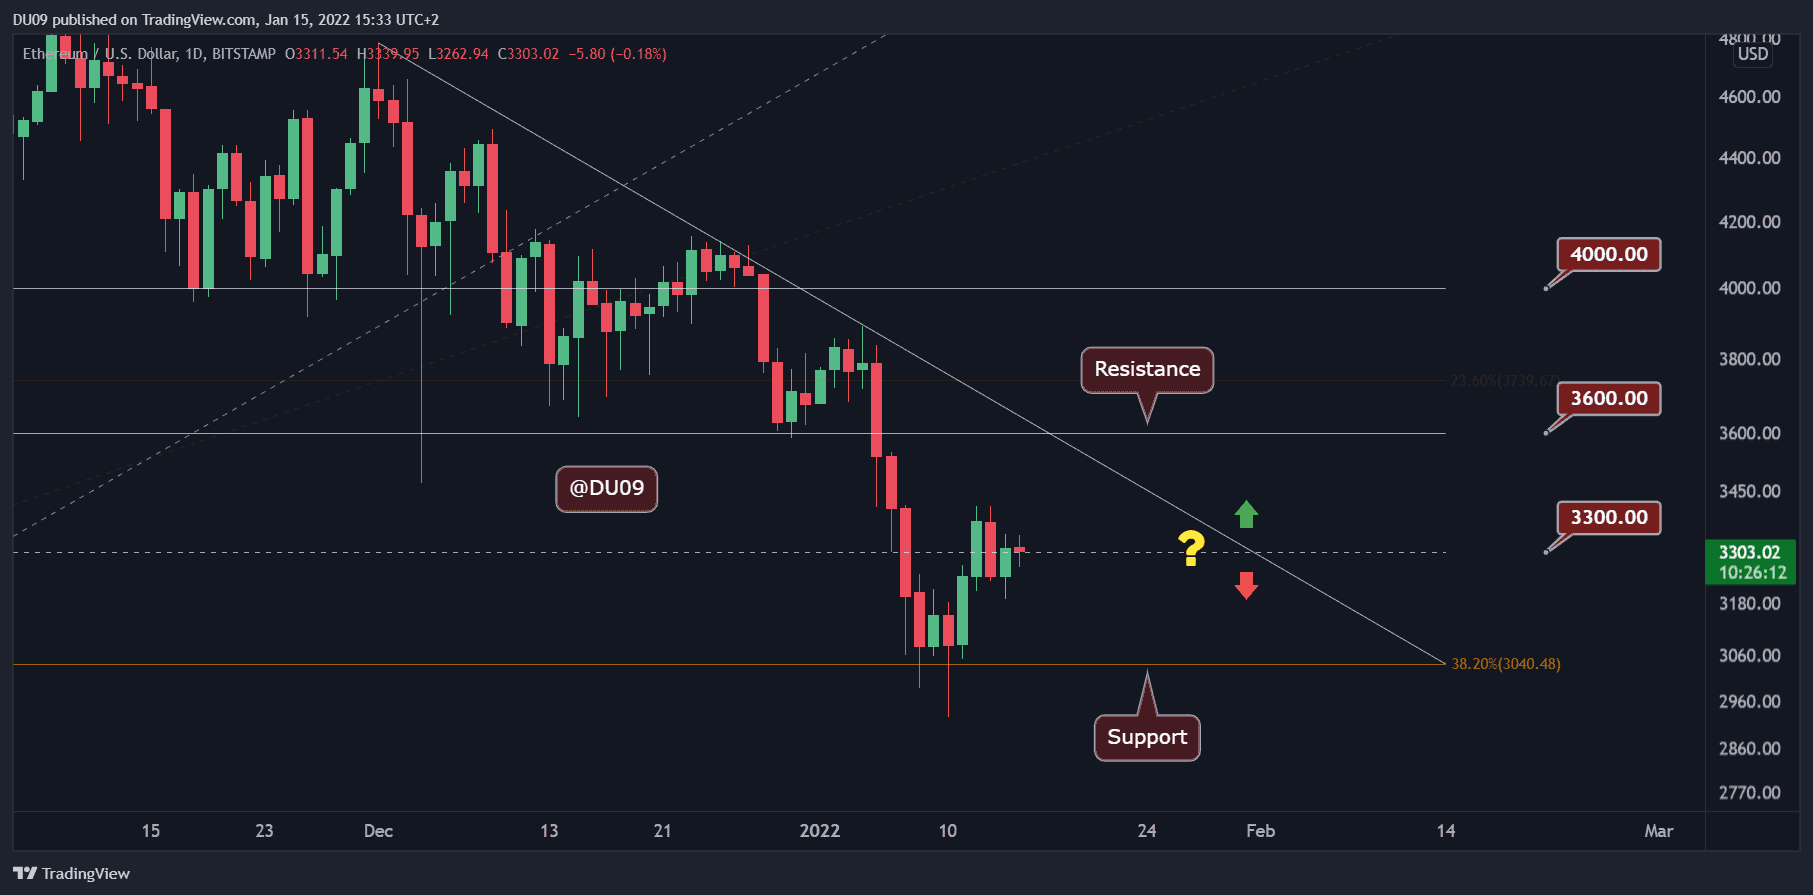
ETH has been hovering around ,300 for a few days, unable to move beyond this key level. However, there are several bullish signals that can break this impasse. Key Support levels: ,000, ,750 Key Resistance levels: ,600, ,000 ETH is consolidating and so far was unable to move higher towards the key resistance at ,600. The weekend is unlikely to help the cryptocurrency as volume is usually low. ETH has good support at ,000, and there are several signals that we could expect a higher price soon. Chart by TradingViewTechnical Indicators Trading Volume: Weak volume over the weekend as usual. The rally from ,000 was on sustained volume and this showed the bulls are able to return when the price is attractive. RSI: The daily RSI completed a bullish divergence
Topics:
Duo Nine considers the following as important: ETH Analysis, ETHBTC, Ethereum (ETH) Price, ethusd
This could be interesting, too:
W. E. Messamore writes Ethereum Killers Are Rallying: Is Ether (ETH) K Still in the Cards?
Mandy Williams writes Retail Investors Persist in Holding ETH Despite Asset’s Recent Surge: CryptoQuant
Martin Young writes Ethereum’s Modular Strategy: Short-Term Pain, Long-Term Gain, Says Research
Chayanika Deka writes Ethereum Foundation Resumes ETH Selling Amid Price Rally
ETH has been hovering around $3,300 for a few days, unable to move beyond this key level. However, there are several bullish signals that can break this impasse.
Key Support levels: $3,000, $2,750
Key Resistance levels: $3,600, $4,000
ETH is consolidating and so far was unable to move higher towards the key resistance at $3,600. The weekend is unlikely to help the cryptocurrency as volume is usually low. ETH has good support at $3,000, and there are several signals that we could expect a higher price soon.
Technical Indicators
Trading Volume: Weak volume over the weekend as usual. The rally from $3,000 was on sustained volume and this showed the bulls are able to return when the price is attractive.
RSI: The daily RSI completed a bullish divergence during the downtrend, and the price rallied from $3,000 to $3,300. However, buyers lost some of the momentum which may return next week.
MACD: The daily MACD did a bullish crossover today. This brings optimism and hope that the bulls may get interested in ETH again early next week and attempt a rally to the key resistance at $3,600. For now, this is a good sign that may push ETH higher soon.

Bias
The bias for ETH is neutral. There are some early bullish signals, but the momentum is not there yet for ETH to move higher.
Short-Term Price Prediction for ETH
Over the weekend, it’s much more likely that ETH will consolidate around the current levels as the volatility is unlikely to pick up. However, come the new week, and the things might change quickly.