Key Support level: 7 Key Resistance level: 0, 2 (ATH) Since March 2021, BNB has formed a huge ascending triangle (colored in blue). A break above would signal that a new all-time high is in the cards. At the time of this post, BNB appears on a clear path to test the key resistance at 0 after a successful test of the support at 7. If BNB is successful in breaking above the key resistance, the price can rally towards the current all-time high at 2. Chart by TradingViewTechnical Indicators Trading Volume: The good volume at the critical support pushed BNB quickly towards the current resistance. This shows that the demand for BNB remains high, and if the momentum can be maintained, the 0 resistance will be tested soon. RSI: The daily RSI is close to making
Topics:
Duo Nine considers the following as important: Binance Coin (BNB) Price, BNBBTC, bnbusd, Price Analysis
This could be interesting, too:
Chayanika Deka writes Osprey Funds Launches First US Publicly Quoted BNB Trust
Chayanika Deka writes BNB Overtakes Solana to Secure 5th Spot by Market Cap After Historic Rally
CryptoVizArt writes ETH’s Path to K Involves Maintaining This Critical Support (Ethereum Price Analysis)
Dimitar Dzhondzhorov writes Binance to Temporarily Suspend Deposits and Withdrawals on BNB Smart Chain Soon: Here’s Why
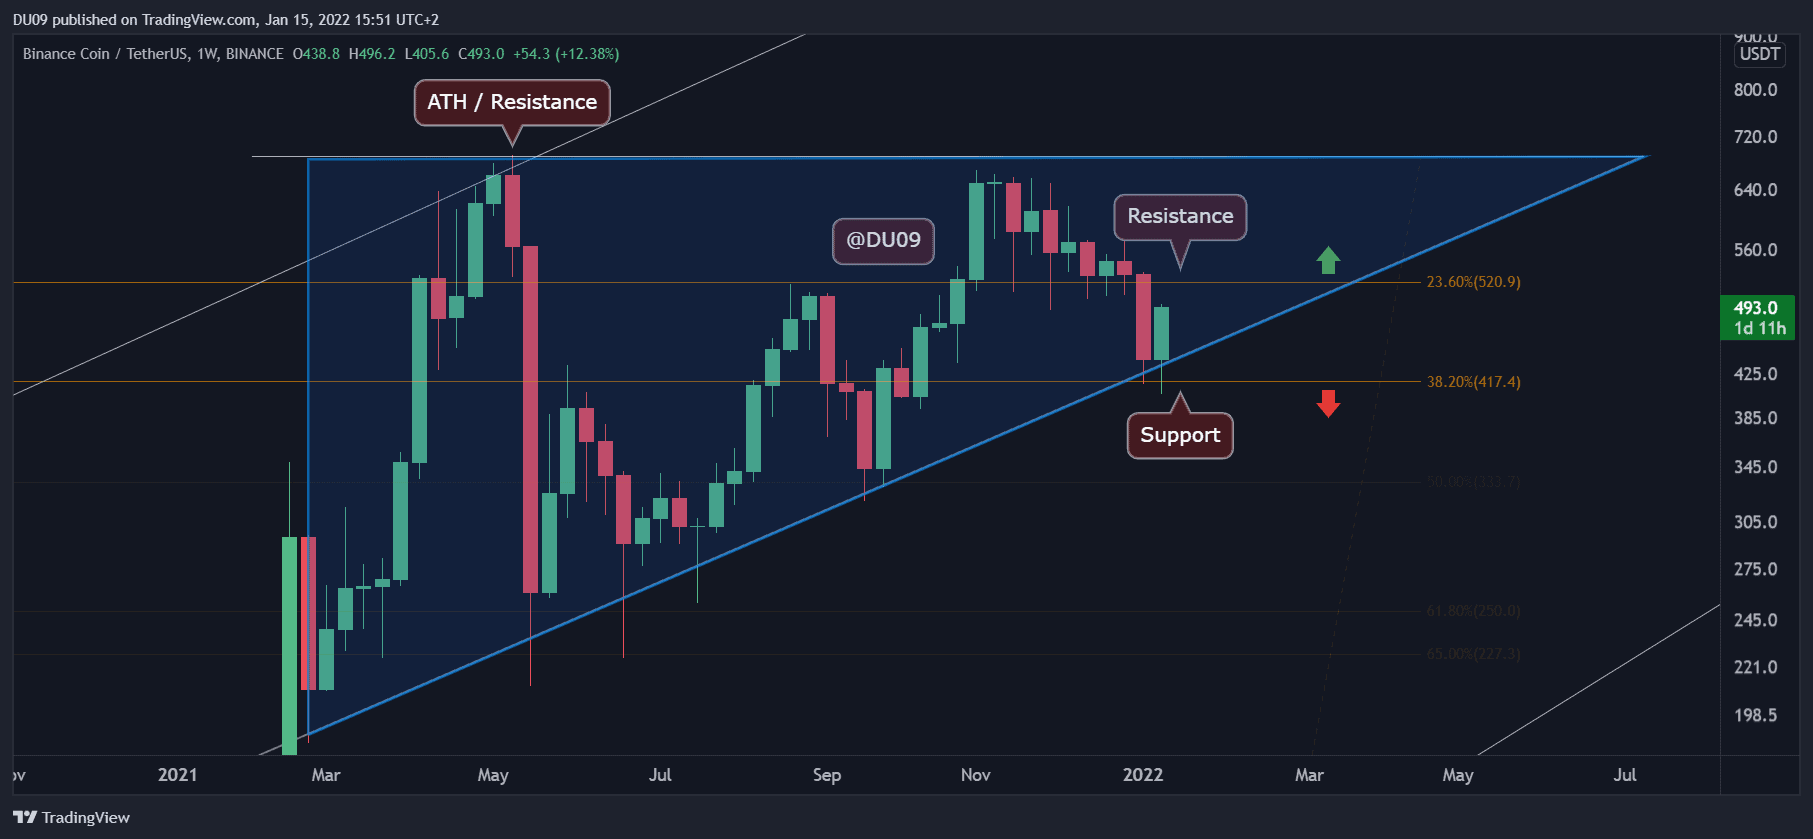
Key Support level: $417
Key Resistance level: $520, $692 (ATH)
Since March 2021, BNB has formed a huge ascending triangle (colored in blue). A break above would signal that a new all-time high is in the cards. At the time of this post, BNB appears on a clear path to test the key resistance at $520 after a successful test of the support at $417.
If BNB is successful in breaking above the key resistance, the price can rally towards the current all-time high at $692.
Technical Indicators
Trading Volume: The good volume at the critical support pushed BNB quickly towards the current resistance. This shows that the demand for BNB remains high, and if the momentum can be maintained, the $520 resistance will be tested soon.
RSI: The daily RSI is close to making a higher high which would further consolidate the bullish bias.
MACD: The daily MACD did a bullish cross last Thursday, and momentum has increased since. The true test of this rally will be the key resistance.

Bias
The current bias is bullish. However, the key resistance at $520 may put the bulls in trouble if the price is rejected there.
Short-Term Prediction for BNB Price
BNB has shown tremendous strength during this most recent correction, managing to hold at the key support. Moreover, now, the price is erasing most of the losses. The first key challenge is for BNB to move above $520.