Ethereum’s price has recently broken below the 100-day moving average, resulting in a decline toward the significant support region of around .7K. It is crucial to closely monitor the price action in this important area as it may provide a clear indication of the next movement of ETH’s price. Ethereum Price Technical Analysis By Shayan The Daily Chart Ethereum had been struggling to breach the 100-day moving average for a prolonged period but has finally broken below it on June 10th, indicating a bearish outlook for the mid term. However, the ETH price has reached the substantial support region at .7K, where the bearish momentum has halted, leading to a stable price action at this level. If selling pressure persists and causes a further decline below this support
Topics:
CryptoVizArt considers the following as important: ETH Analysis, ETHBTC, Ethereum (ETH) Price, ethusd
This could be interesting, too:
Mandy Williams writes Ethereum Derivatives Metrics Signal Modest Downside Tail Risk Ahead: Nansen
Jordan Lyanchev writes Weekly Bitcoin, Ethereum ETF Recap: Light at the End of the Tunnel for BTC
CryptoVizArt writes Will Weak Momentum Drive ETH to .5K? (Ethereum Price Analysis)
Jordan Lyanchev writes Bybit Hack Fallout: Arthur Hayes, Samson Mow Push for Ethereum Rollback
Ethereum’s price has recently broken below the 100-day moving average, resulting in a decline toward the significant support region of around $1.7K.
It is crucial to closely monitor the price action in this important area as it may provide a clear indication of the next movement of ETH’s price.
Ethereum Price Technical Analysis
By Shayan
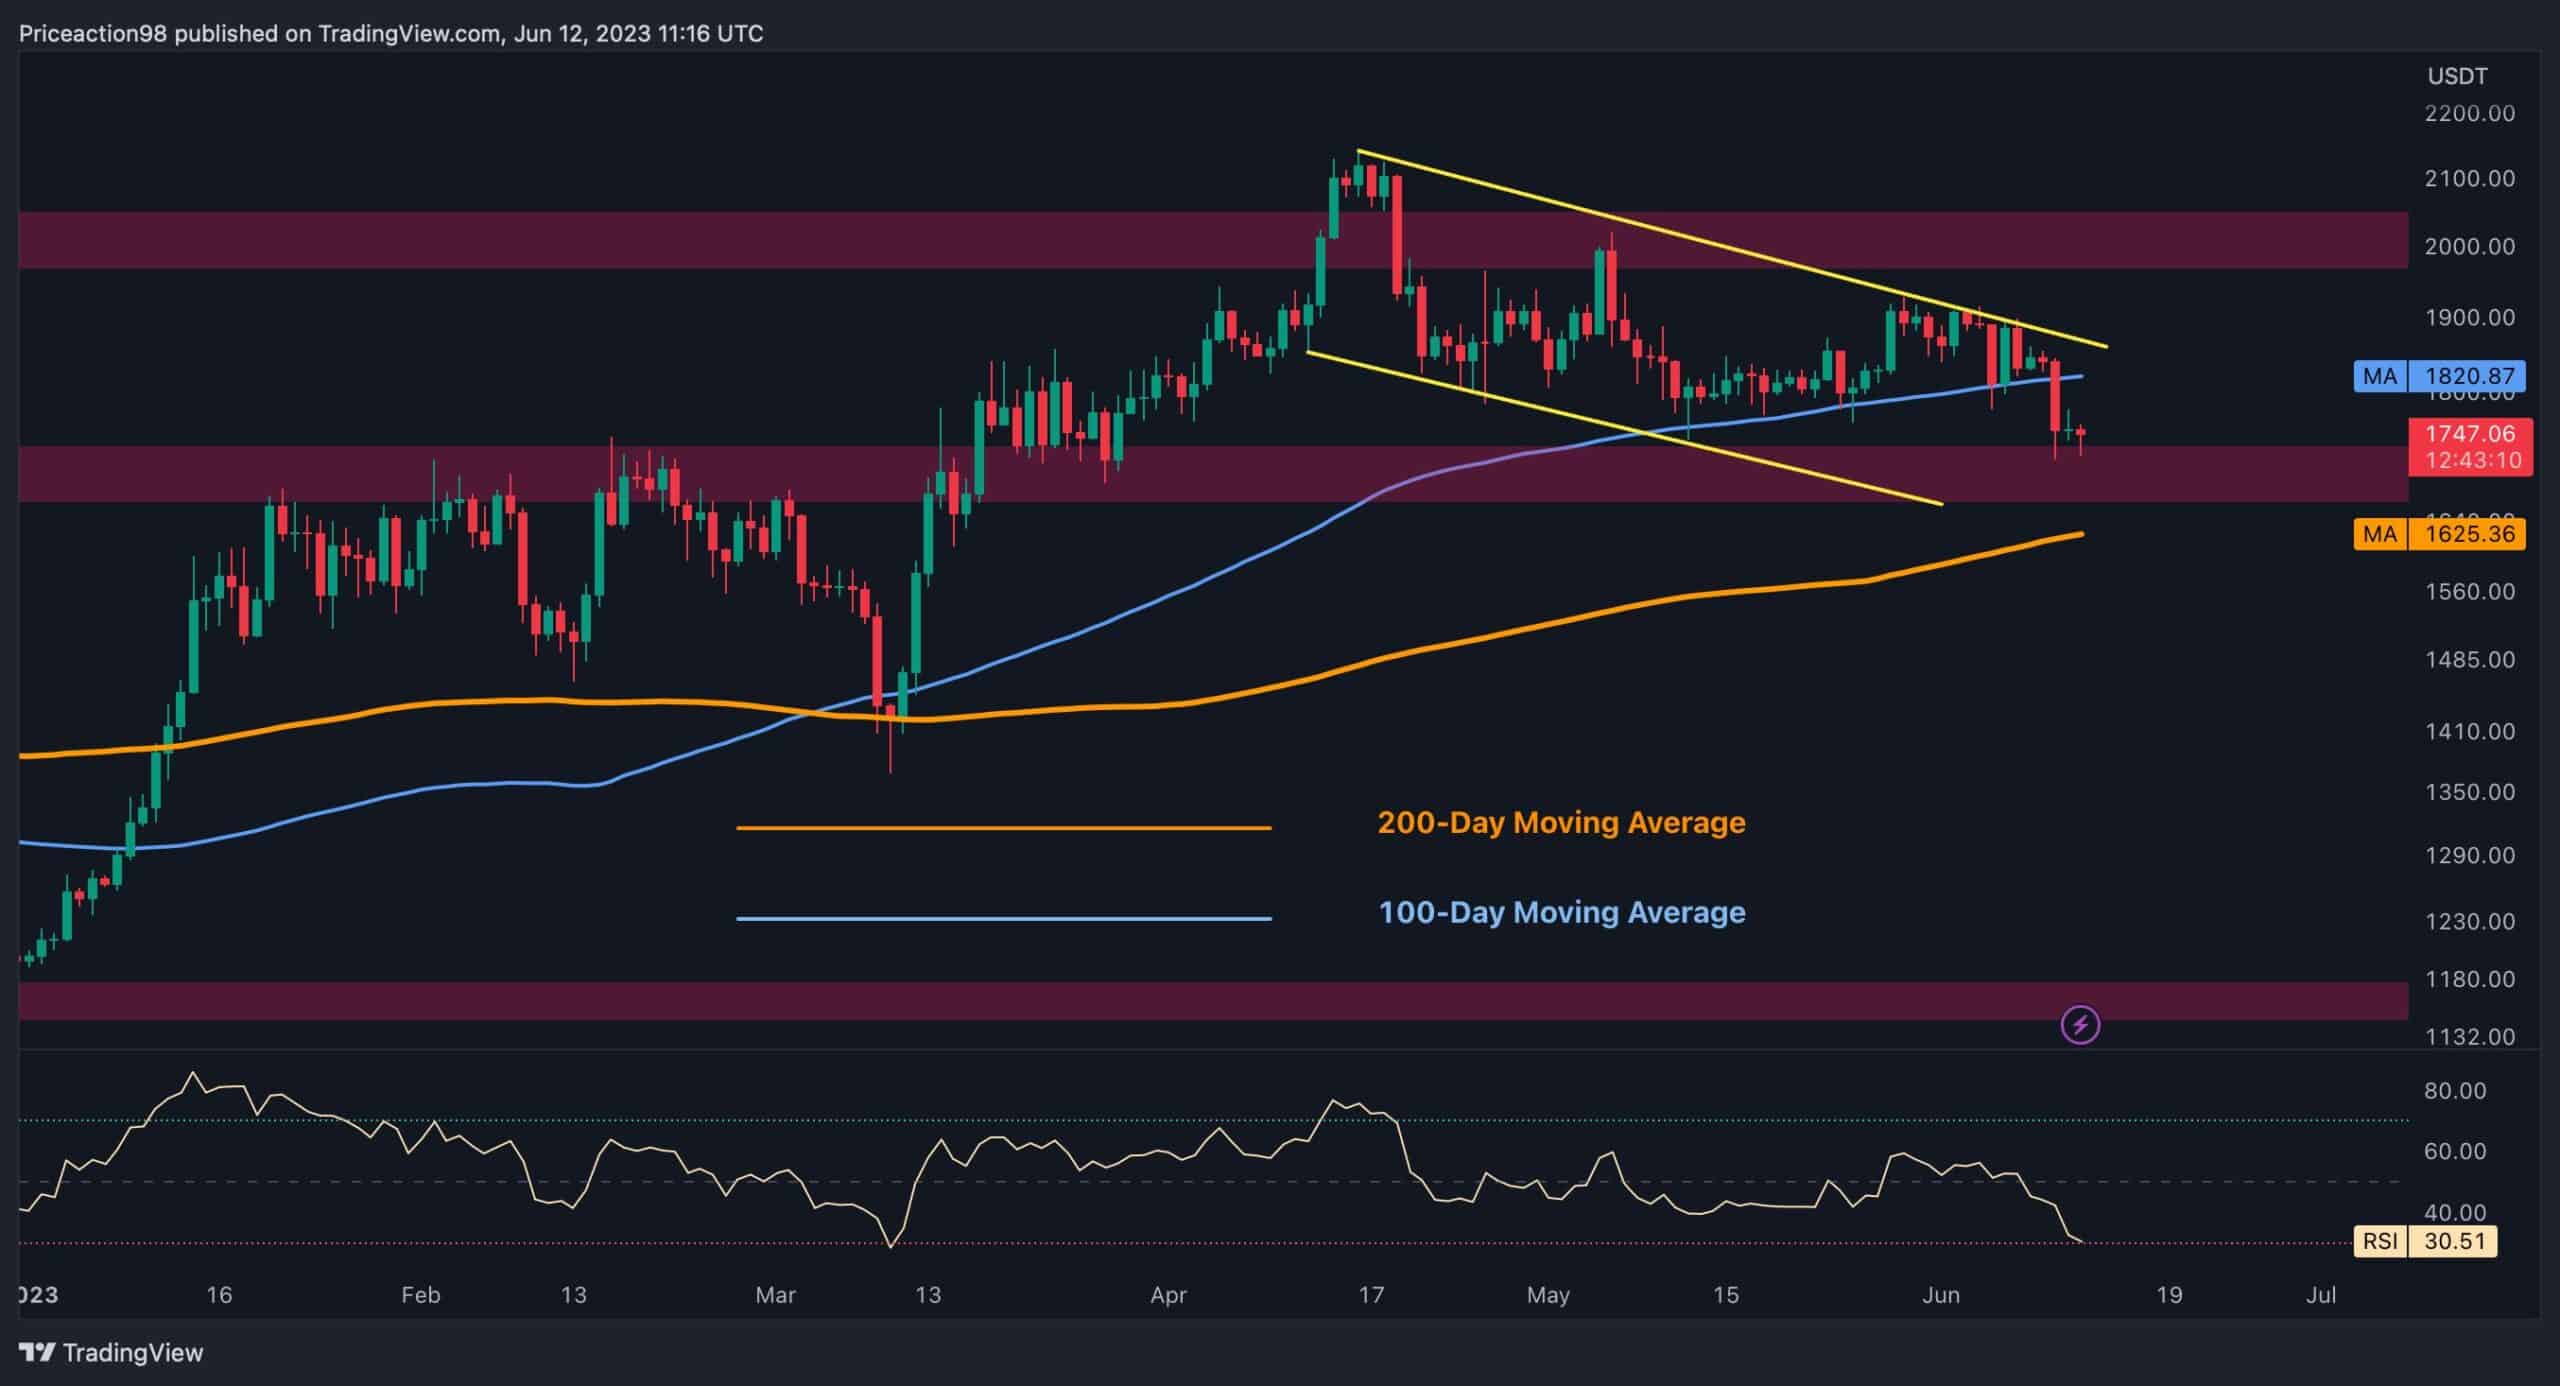
The Daily Chart
Ethereum had been struggling to breach the 100-day moving average for a prolonged period but has finally broken below it on June 10th, indicating a bearish outlook for the mid term.
However, the ETH price has reached the substantial support region at $1.7K, where the bearish momentum has halted, leading to a stable price action at this level. If selling pressure persists and causes a further decline below this support region, the bears’ next target would be the 200-day moving average at $1625.
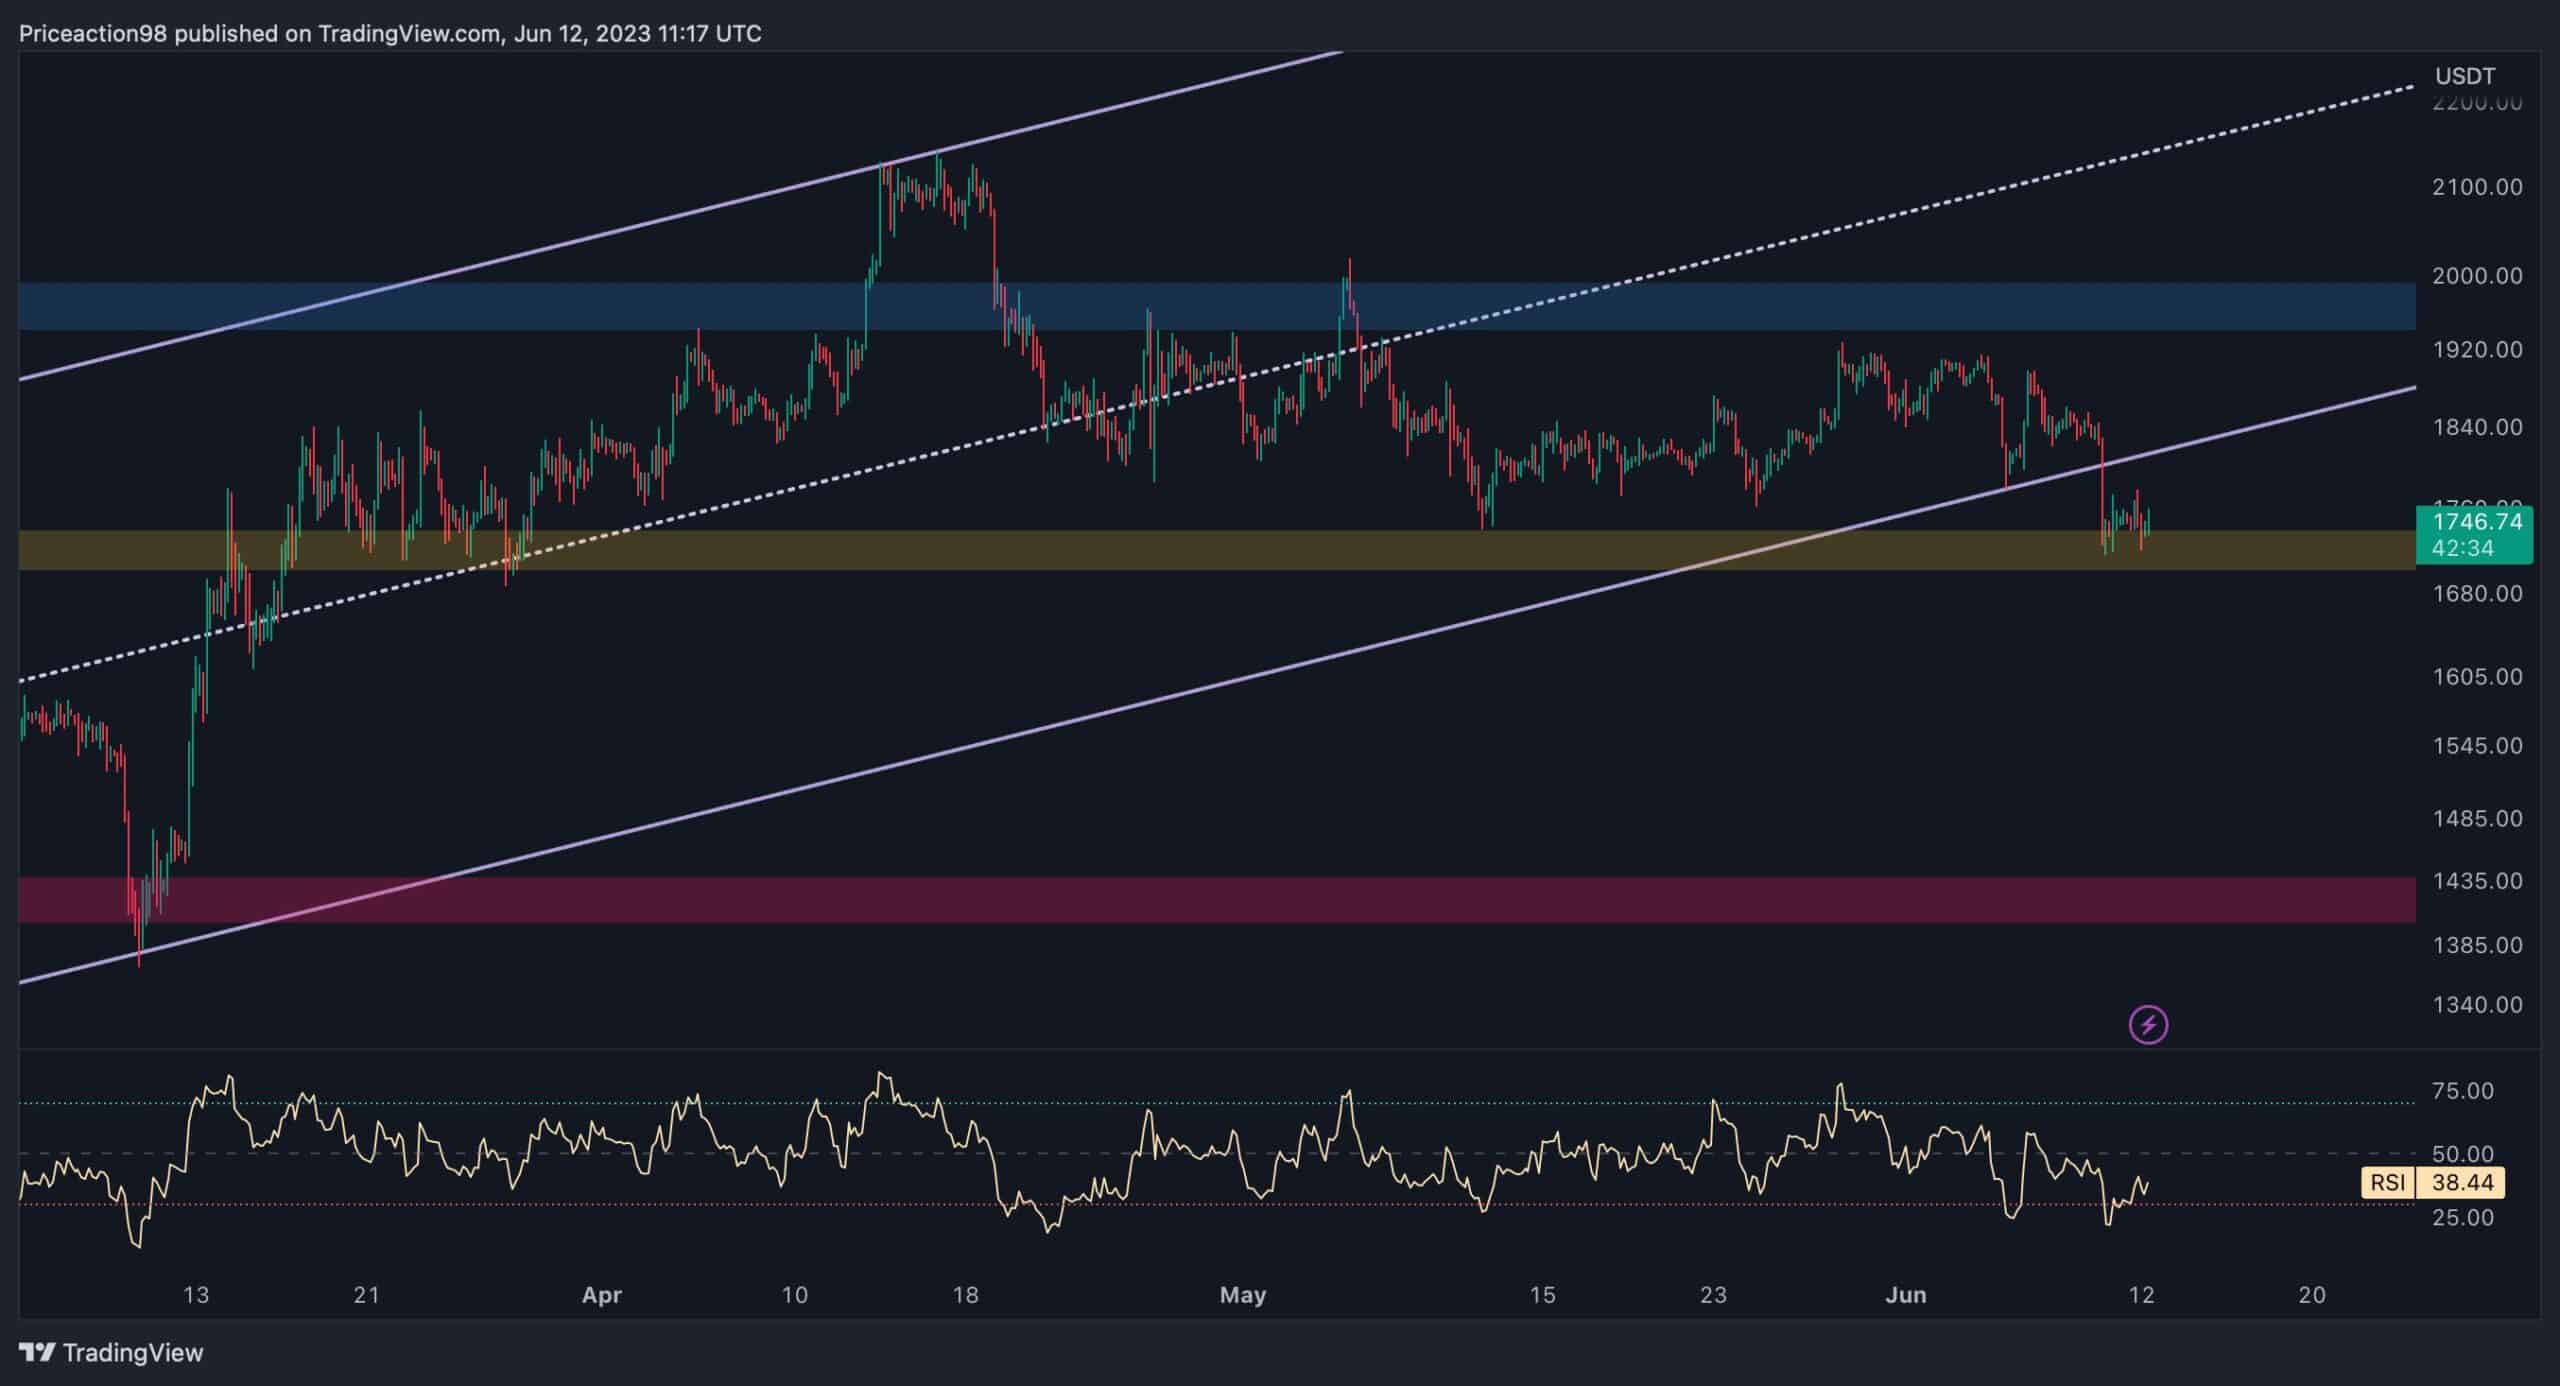
The 4-Hour Chart
On the 4-hour chart, the price has finally dropped below the lower trendline of the channel and reached the major support zone at $1.7K. It holds significant psychological value as it has been supporting the price since March 2023.
Considering that the RSI indicator is currently around the oversold section, there is a possibility of a price retracement towards the lower trendline of the channel before initiating the next move. However, if the $1.7K level successfully prevents further decline and triggers a bullish rally, the next target for Ethereum would be the $2K resistance region.
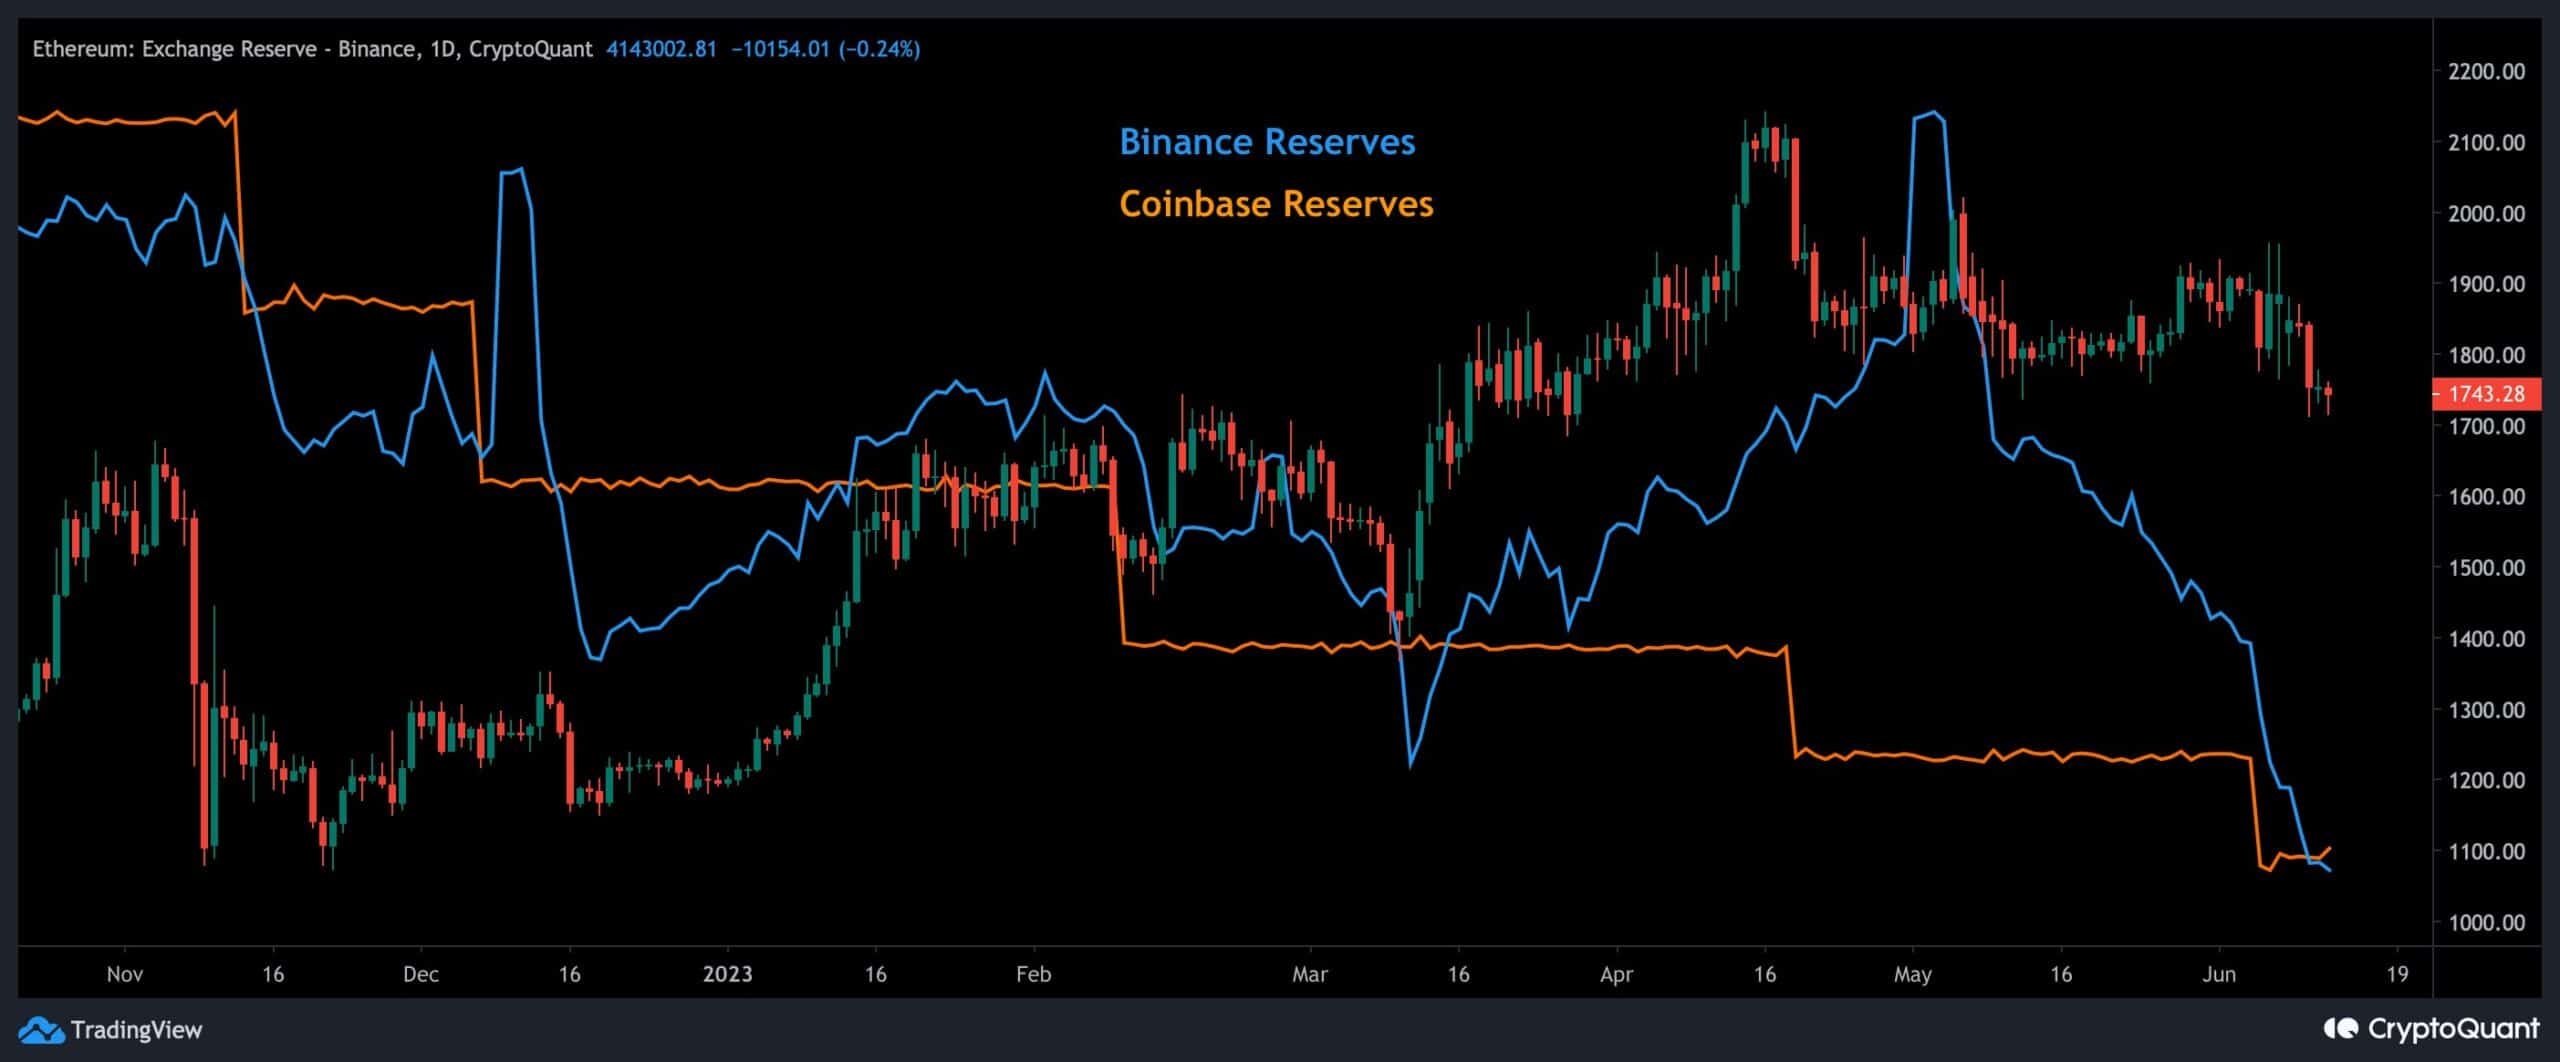
On-chain Analysis
By Shayan
This graph illustrates the Ethereum Exchange Reserves metric for Binance and Coinbase exchanges in relation to Ethereum’s price. Recently, the Securities and Exchange Commission (SEC) filed a lawsuit against both Binance and Coinbase, which has generated significant fear within the market.
In response to this development, investors have withdrawn approximately $1.43 billion from the Binance crypto exchange and its U.S. affiliate following the regulatory actions. Binance experienced net outflows of $1.34 billion worth of crypto tokens on the Ethereum blockchain, while its U.S. affiliate, Binance.US, recorded net outflows of $70.8 million. Coinbase has also witnessed substantial outflows due to the prevailing uncertainty among market participants.
Consequently, the ETH Exchange Reserve metric has undergone a notable decrease for both exchanges, underscoring the fear and uncertainty triggered by the conflict involving the SEC, Binance, and Coinbase.