Ethereum’s price has been making lower highs and lows recently, following a decisive reversal from the key ,000 area. Considering the current market structure, more downside can be expected. Technical Analysis By Edris The Daily Chart On the daily chart, the price has recently broken below the ,650 support. However, this level is currently being retested. A further bearish continuation is likely if the price fails to climb above the broken level soon. The recent bearish crossover between the 50-day and 200-day moving averages is also a negative signal, indicating the potential beginning of a downtrend in the coming weeks. Source: TradingViewThe 4-Hour Chart Looking at the 4-hour timeframe, it is evident that after weeks of testing the ,650 support zone, the price has
Topics:
CryptoVizArt considers the following as important: ETH Analysis, ETHBTC, Ethereum (ETH) Price, ethusd
This could be interesting, too:
Mandy Williams writes Ethereum Derivatives Metrics Signal Modest Downside Tail Risk Ahead: Nansen
Jordan Lyanchev writes Weekly Bitcoin, Ethereum ETF Recap: Light at the End of the Tunnel for BTC
CryptoVizArt writes Will Weak Momentum Drive ETH to .5K? (Ethereum Price Analysis)
Jordan Lyanchev writes Bybit Hack Fallout: Arthur Hayes, Samson Mow Push for Ethereum Rollback
Ethereum’s price has been making lower highs and lows recently, following a decisive reversal from the key $2,000 area. Considering the current market structure, more downside can be expected.
Technical Analysis
By Edris
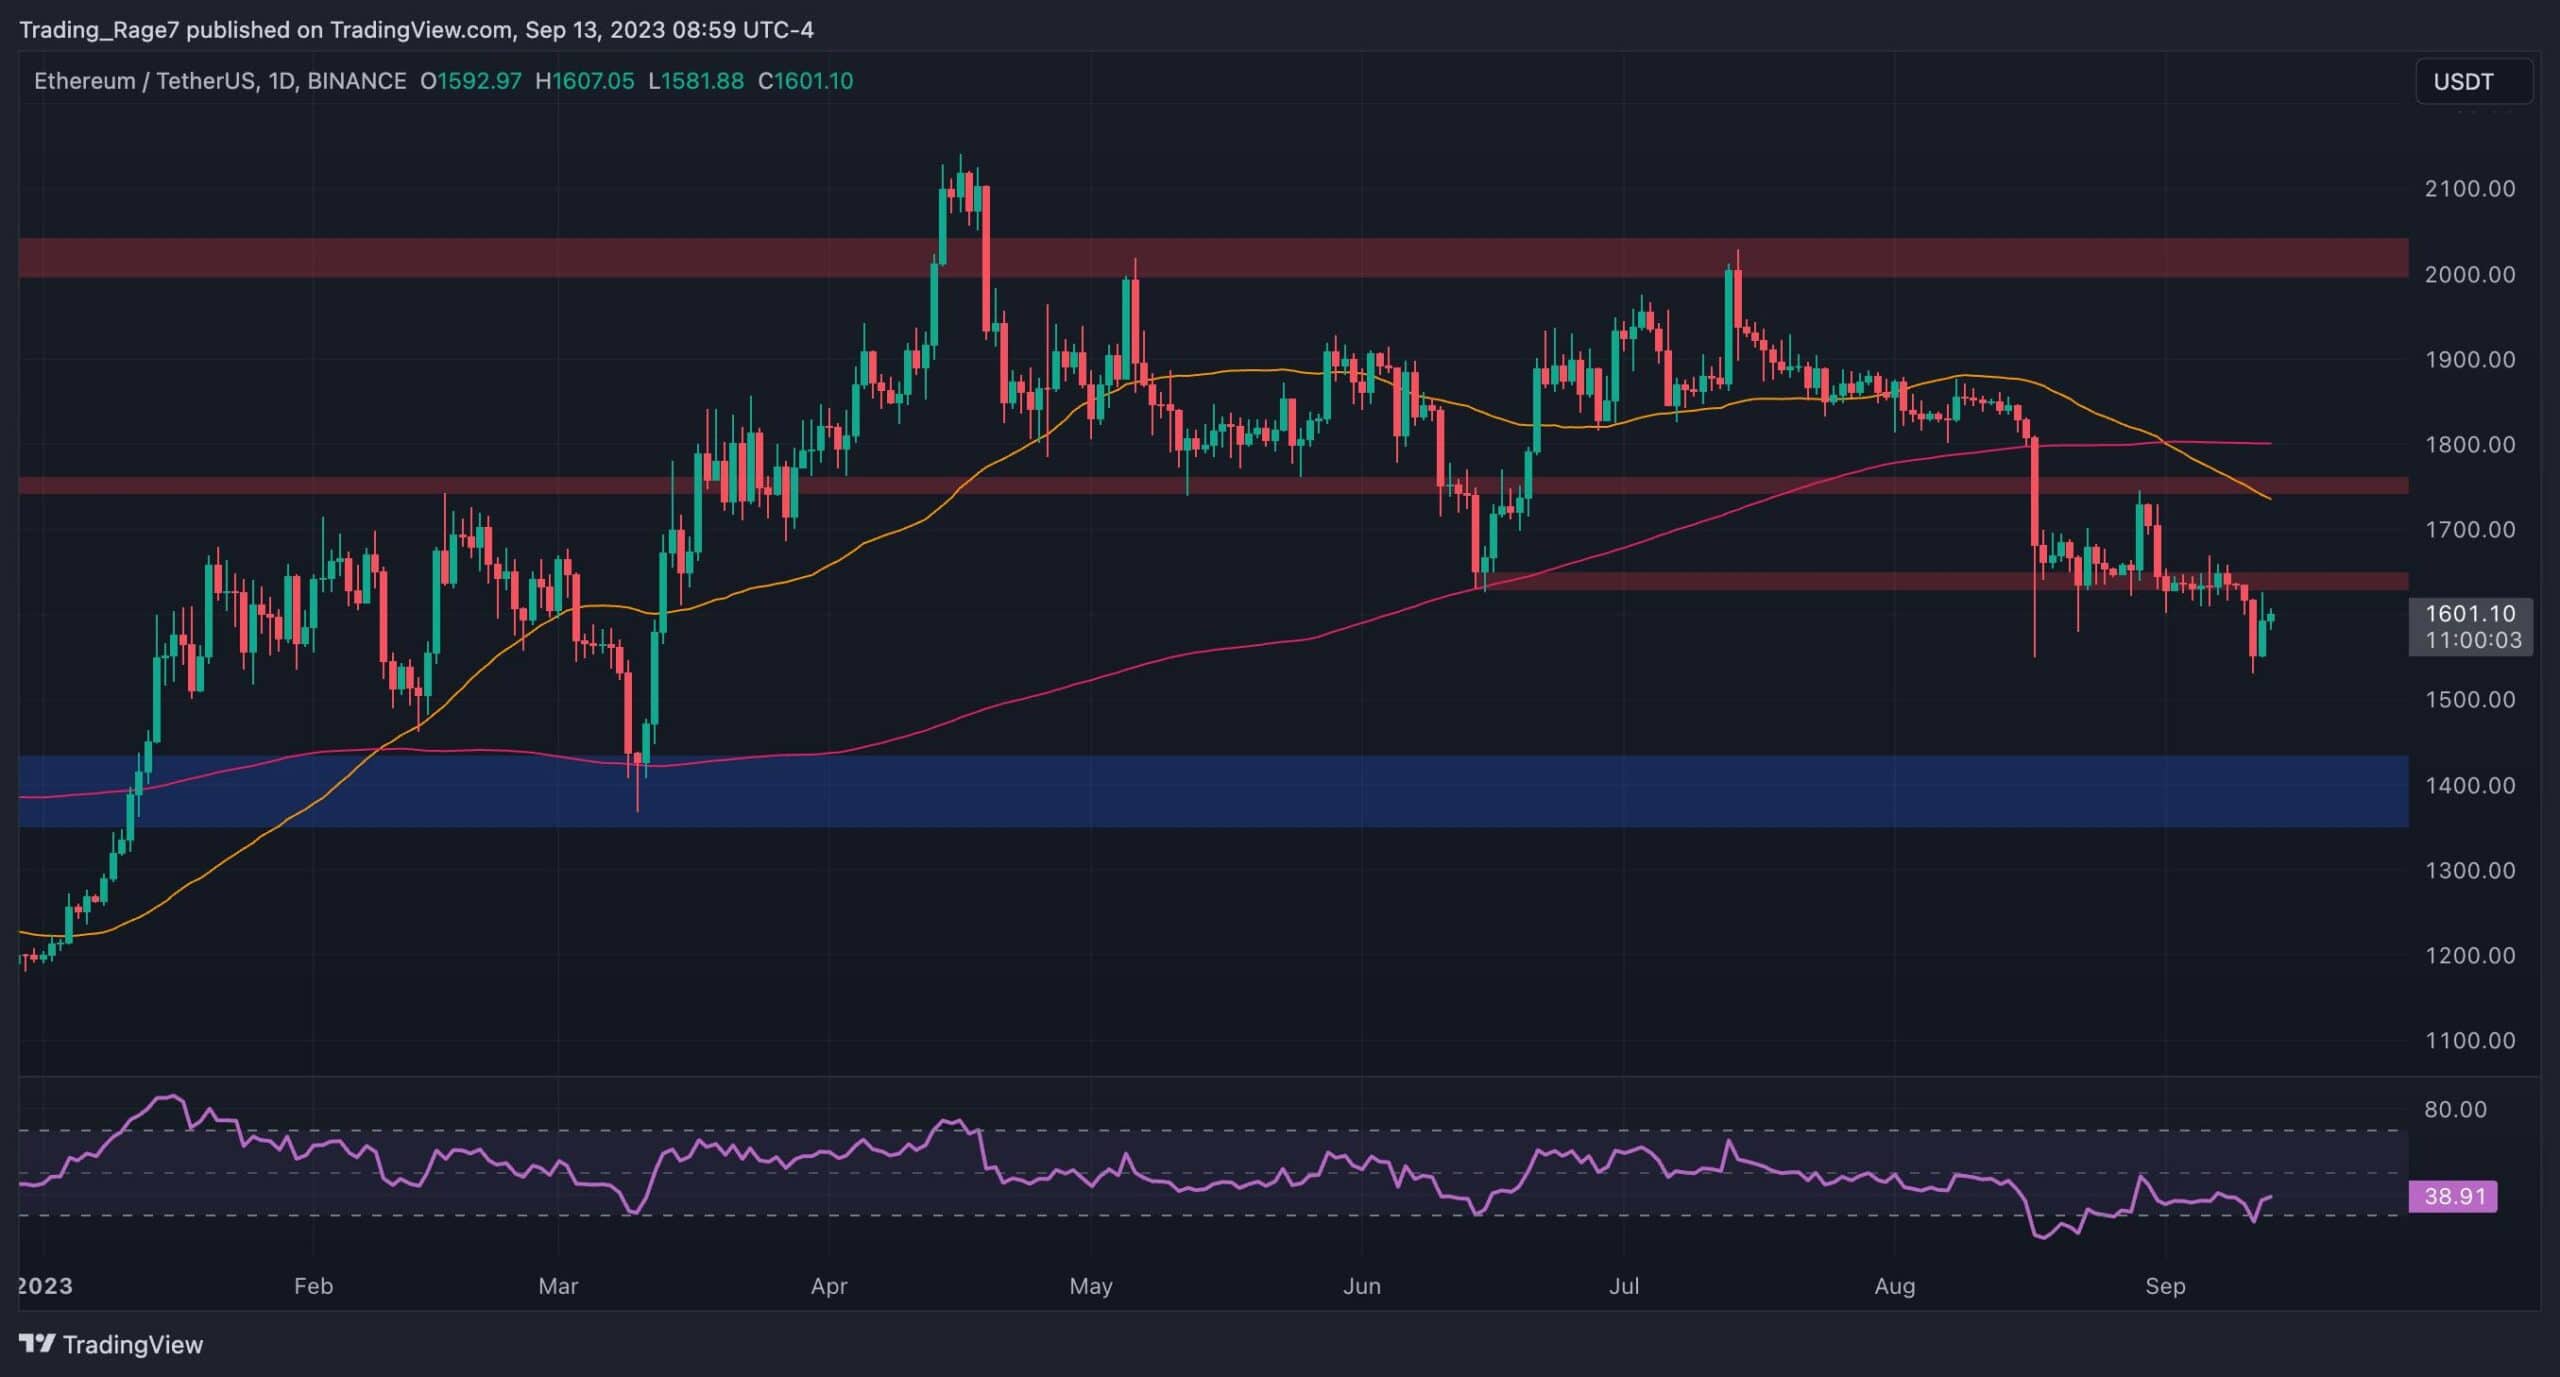
The Daily Chart
On the daily chart, the price has recently broken below the $1,650 support. However, this level is currently being retested. A further bearish continuation is likely if the price fails to climb above the broken level soon.
The recent bearish crossover between the 50-day and 200-day moving averages is also a negative signal, indicating the potential beginning of a downtrend in the coming weeks.
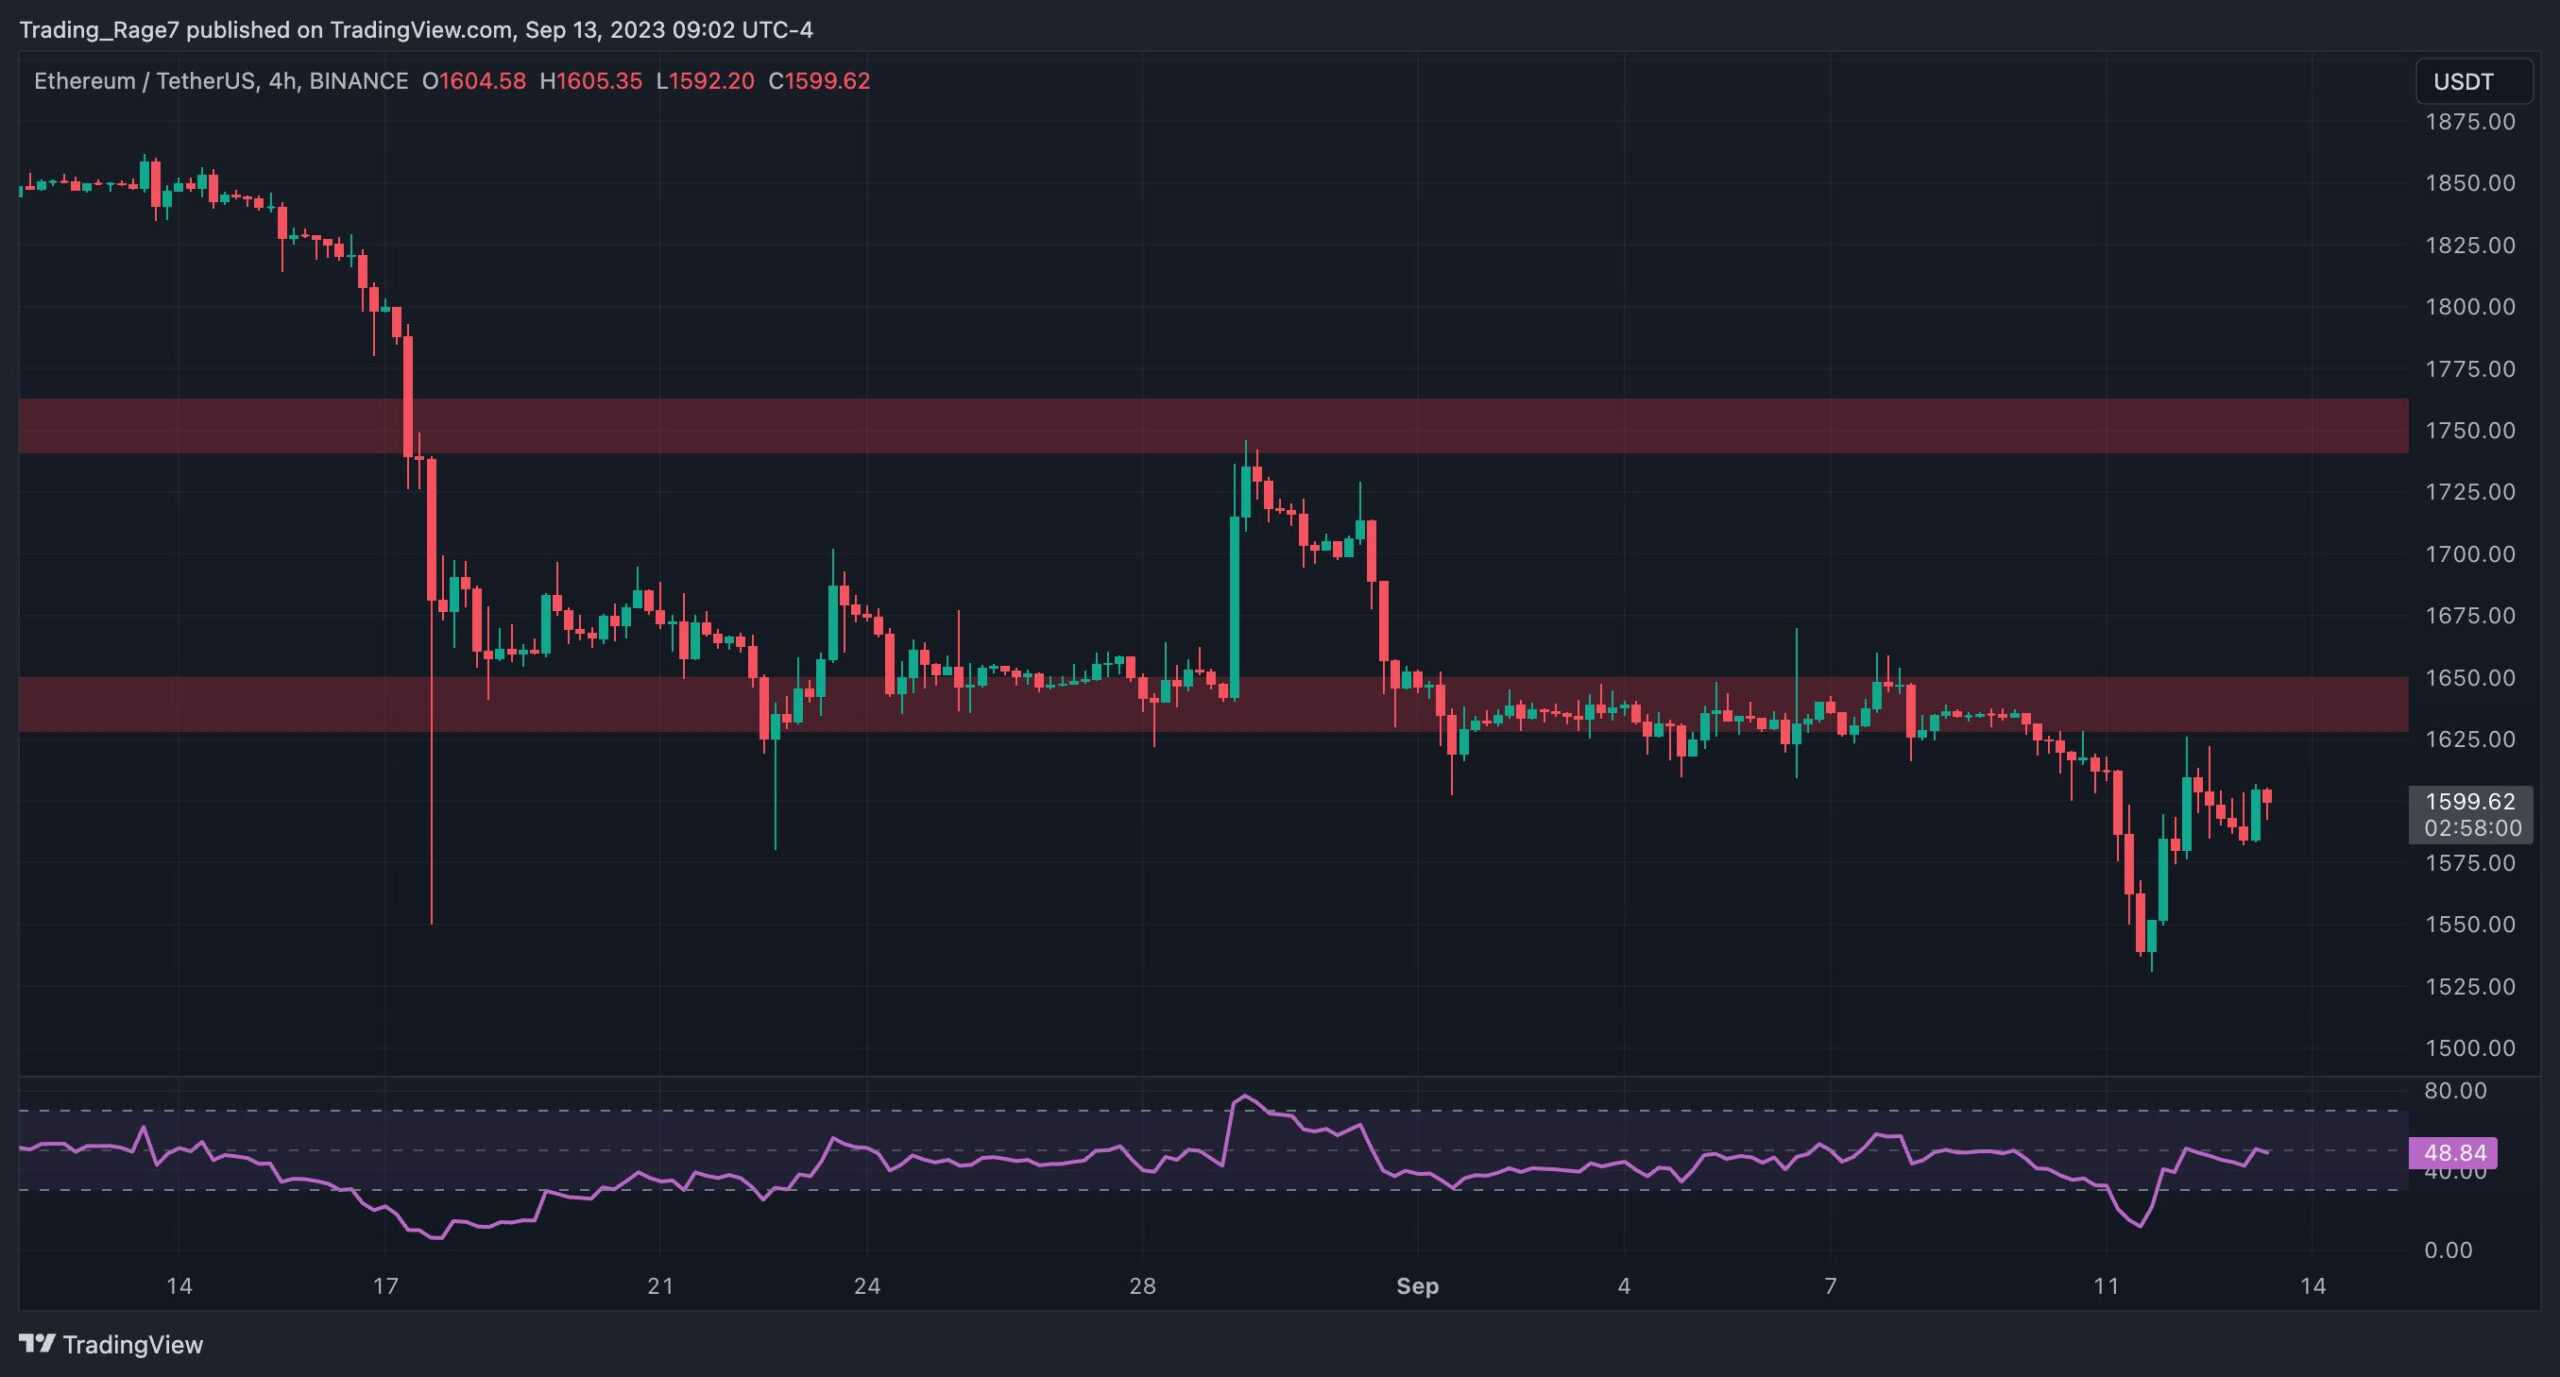
The 4-Hour Chart
Looking at the 4-hour timeframe, it is evident that after weeks of testing the $1,650 support zone, the price has finally broken through and is currently pulling back towards it.
If the market rises above the $1,650 level in the coming days, a rally toward $1,750 is imminent. Otherwise, a deeper decline would materialize, spreading fear among investors and making them wonder if the bear market may not be over yet.
On-Chain Analysis
By: Edris
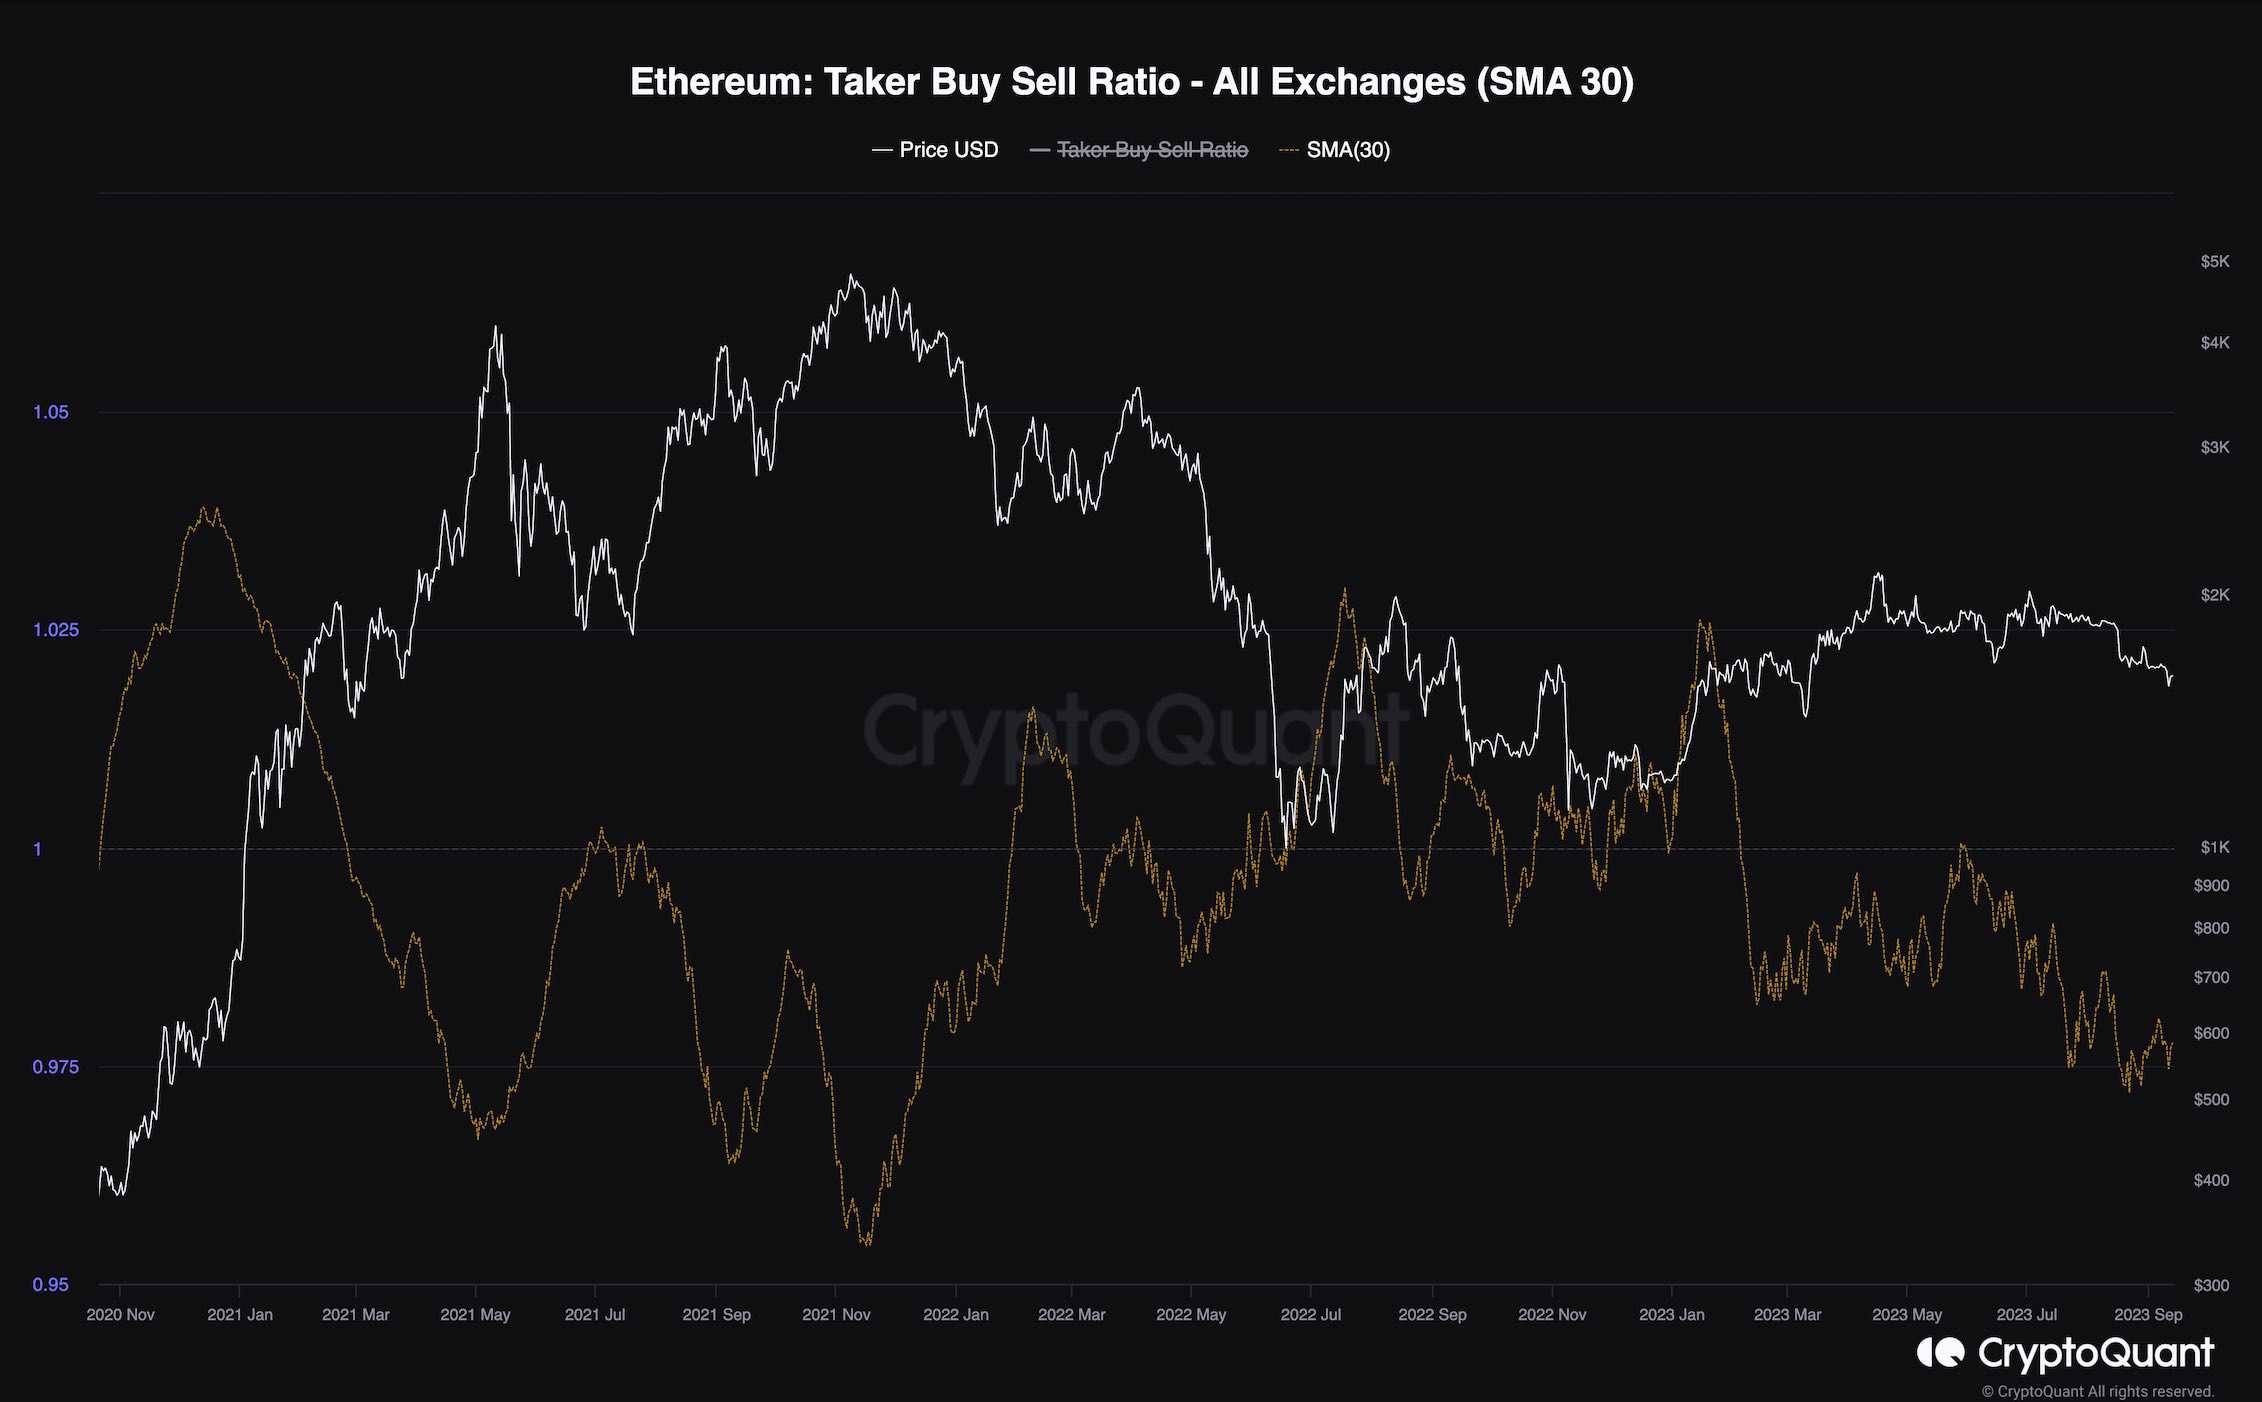
Ethereum Taker Buy Sell Ratio
Over the past few weeks, Ethereum’s price has been trending down after being rejected from the $2,000 resistance level multiple times. Analyzing the futures market sentiment can provide insights into the current situation.
This chart shows the taker buy-sell ratio with a 30-day moving average applied to enhance visualization. The metric indicates whether buyers or sellers are executing their orders more aggressively. Positive values are associated with bullish sentiment, and negative values are considered bearish.
This metric has been trending in the negative region over the past few months, indicating that futures market traders are bearish on ETH. As long as this is the case, there is a low probability of a bullish reversal in the short term.