Ethereum’s price has reached the crucial level of the 100-day moving average at 60. The PA at this significant support region should be closely monitored, as a breakdown will potentially lead to a massive cascade. Technical Analysis By Shayan The Daily Chart After a short-term consolidation phase, the price experienced a decline and reached the 100-day moving average of .7K. Although Ethereum’s recent PA has not shown a clear direction, it initiated a slight uptrend after touching the 100-day moving average, leaving the market uncertain. However, the price currently faces two crucial levels, the 100-day moving average at 48 and the .6K support region. Therefore, it has the potential to start a rally aiming for the .1K resistance area, but only if the moving
Topics:
CryptoVizArt considers the following as important: ETH Analysis, ETHBTC, Ethereum (ETH) Price, ethusd
This could be interesting, too:
Mandy Williams writes Ethereum Derivatives Metrics Signal Modest Downside Tail Risk Ahead: Nansen
Jordan Lyanchev writes Weekly Bitcoin, Ethereum ETF Recap: Light at the End of the Tunnel for BTC
CryptoVizArt writes Will Weak Momentum Drive ETH to .5K? (Ethereum Price Analysis)
Jordan Lyanchev writes Bybit Hack Fallout: Arthur Hayes, Samson Mow Push for Ethereum Rollback
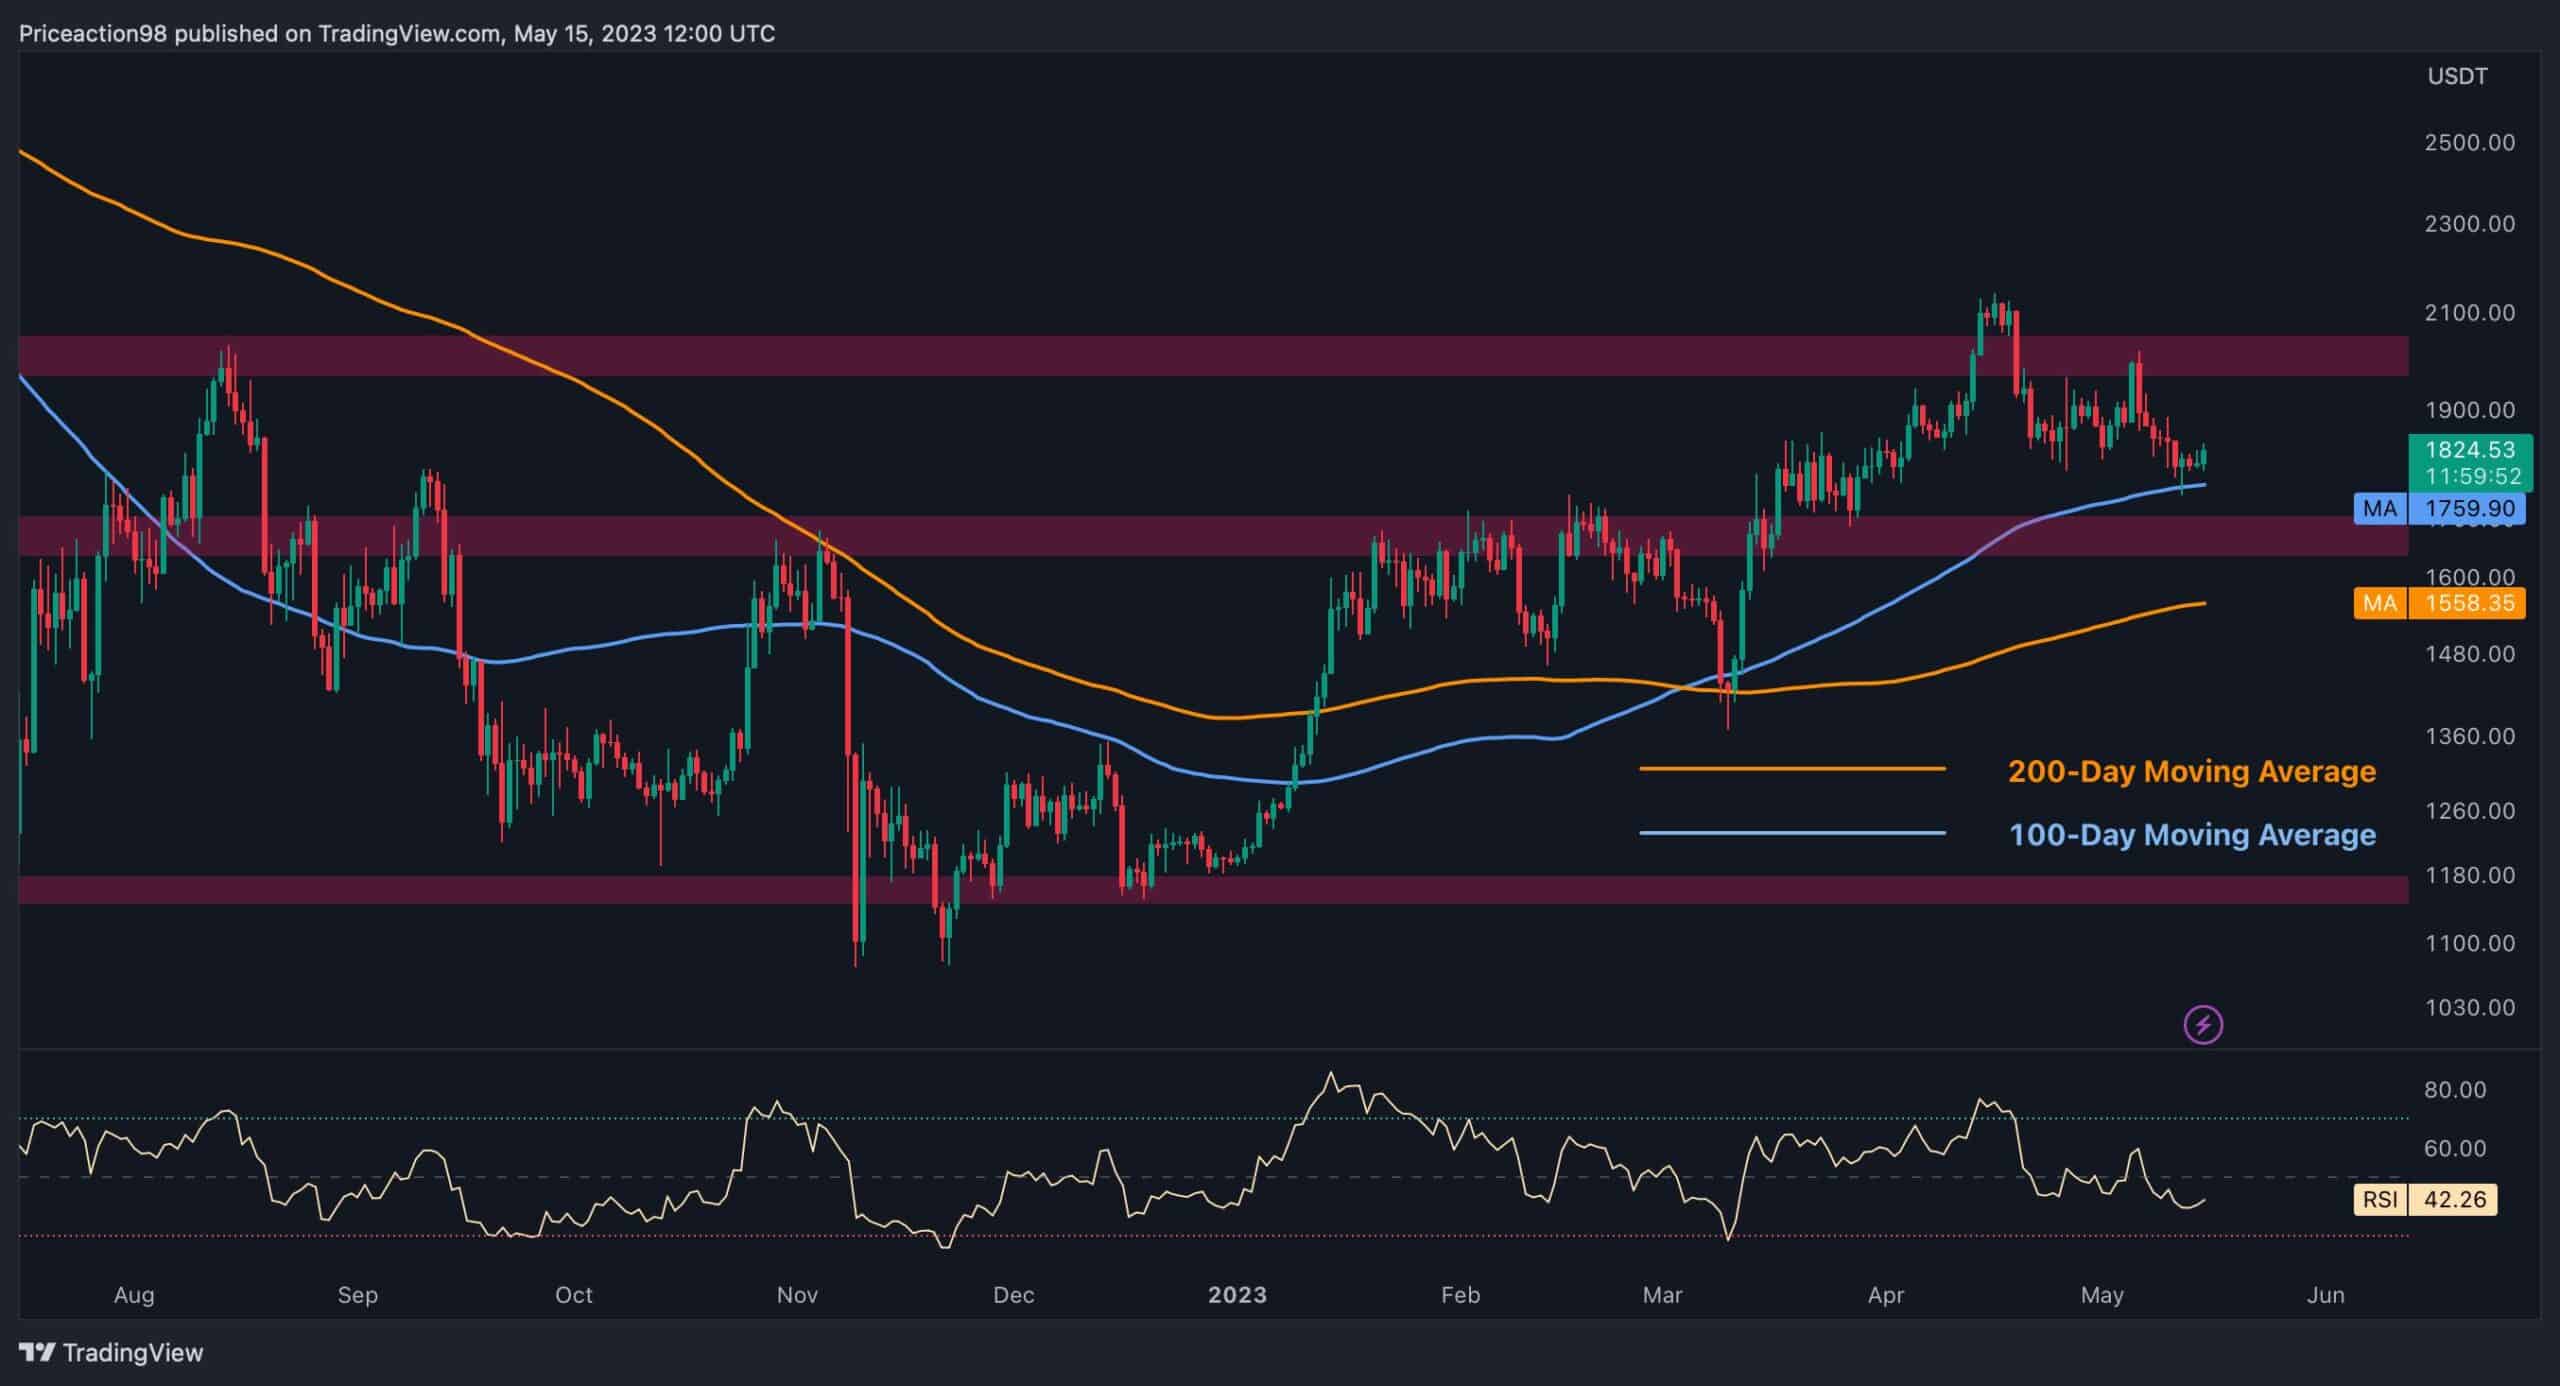
Ethereum’s price has reached the crucial level of the 100-day moving average at $1760. The PA at this significant support region should be closely monitored, as a breakdown will potentially lead to a massive cascade.
Technical Analysis
By Shayan
The Daily Chart
After a short-term consolidation phase, the price experienced a decline and reached the 100-day moving average of $1.7K. Although Ethereum’s recent PA has not shown a clear direction, it initiated a slight uptrend after touching the 100-day moving average, leaving the market uncertain.
However, the price currently faces two crucial levels, the 100-day moving average at $1748 and the $1.6K support region.
Therefore, it has the potential to start a rally aiming for the $2.1K resistance area, but only if the moving average successfully holds Ethereum from further decline.
The 4-Hour Chart
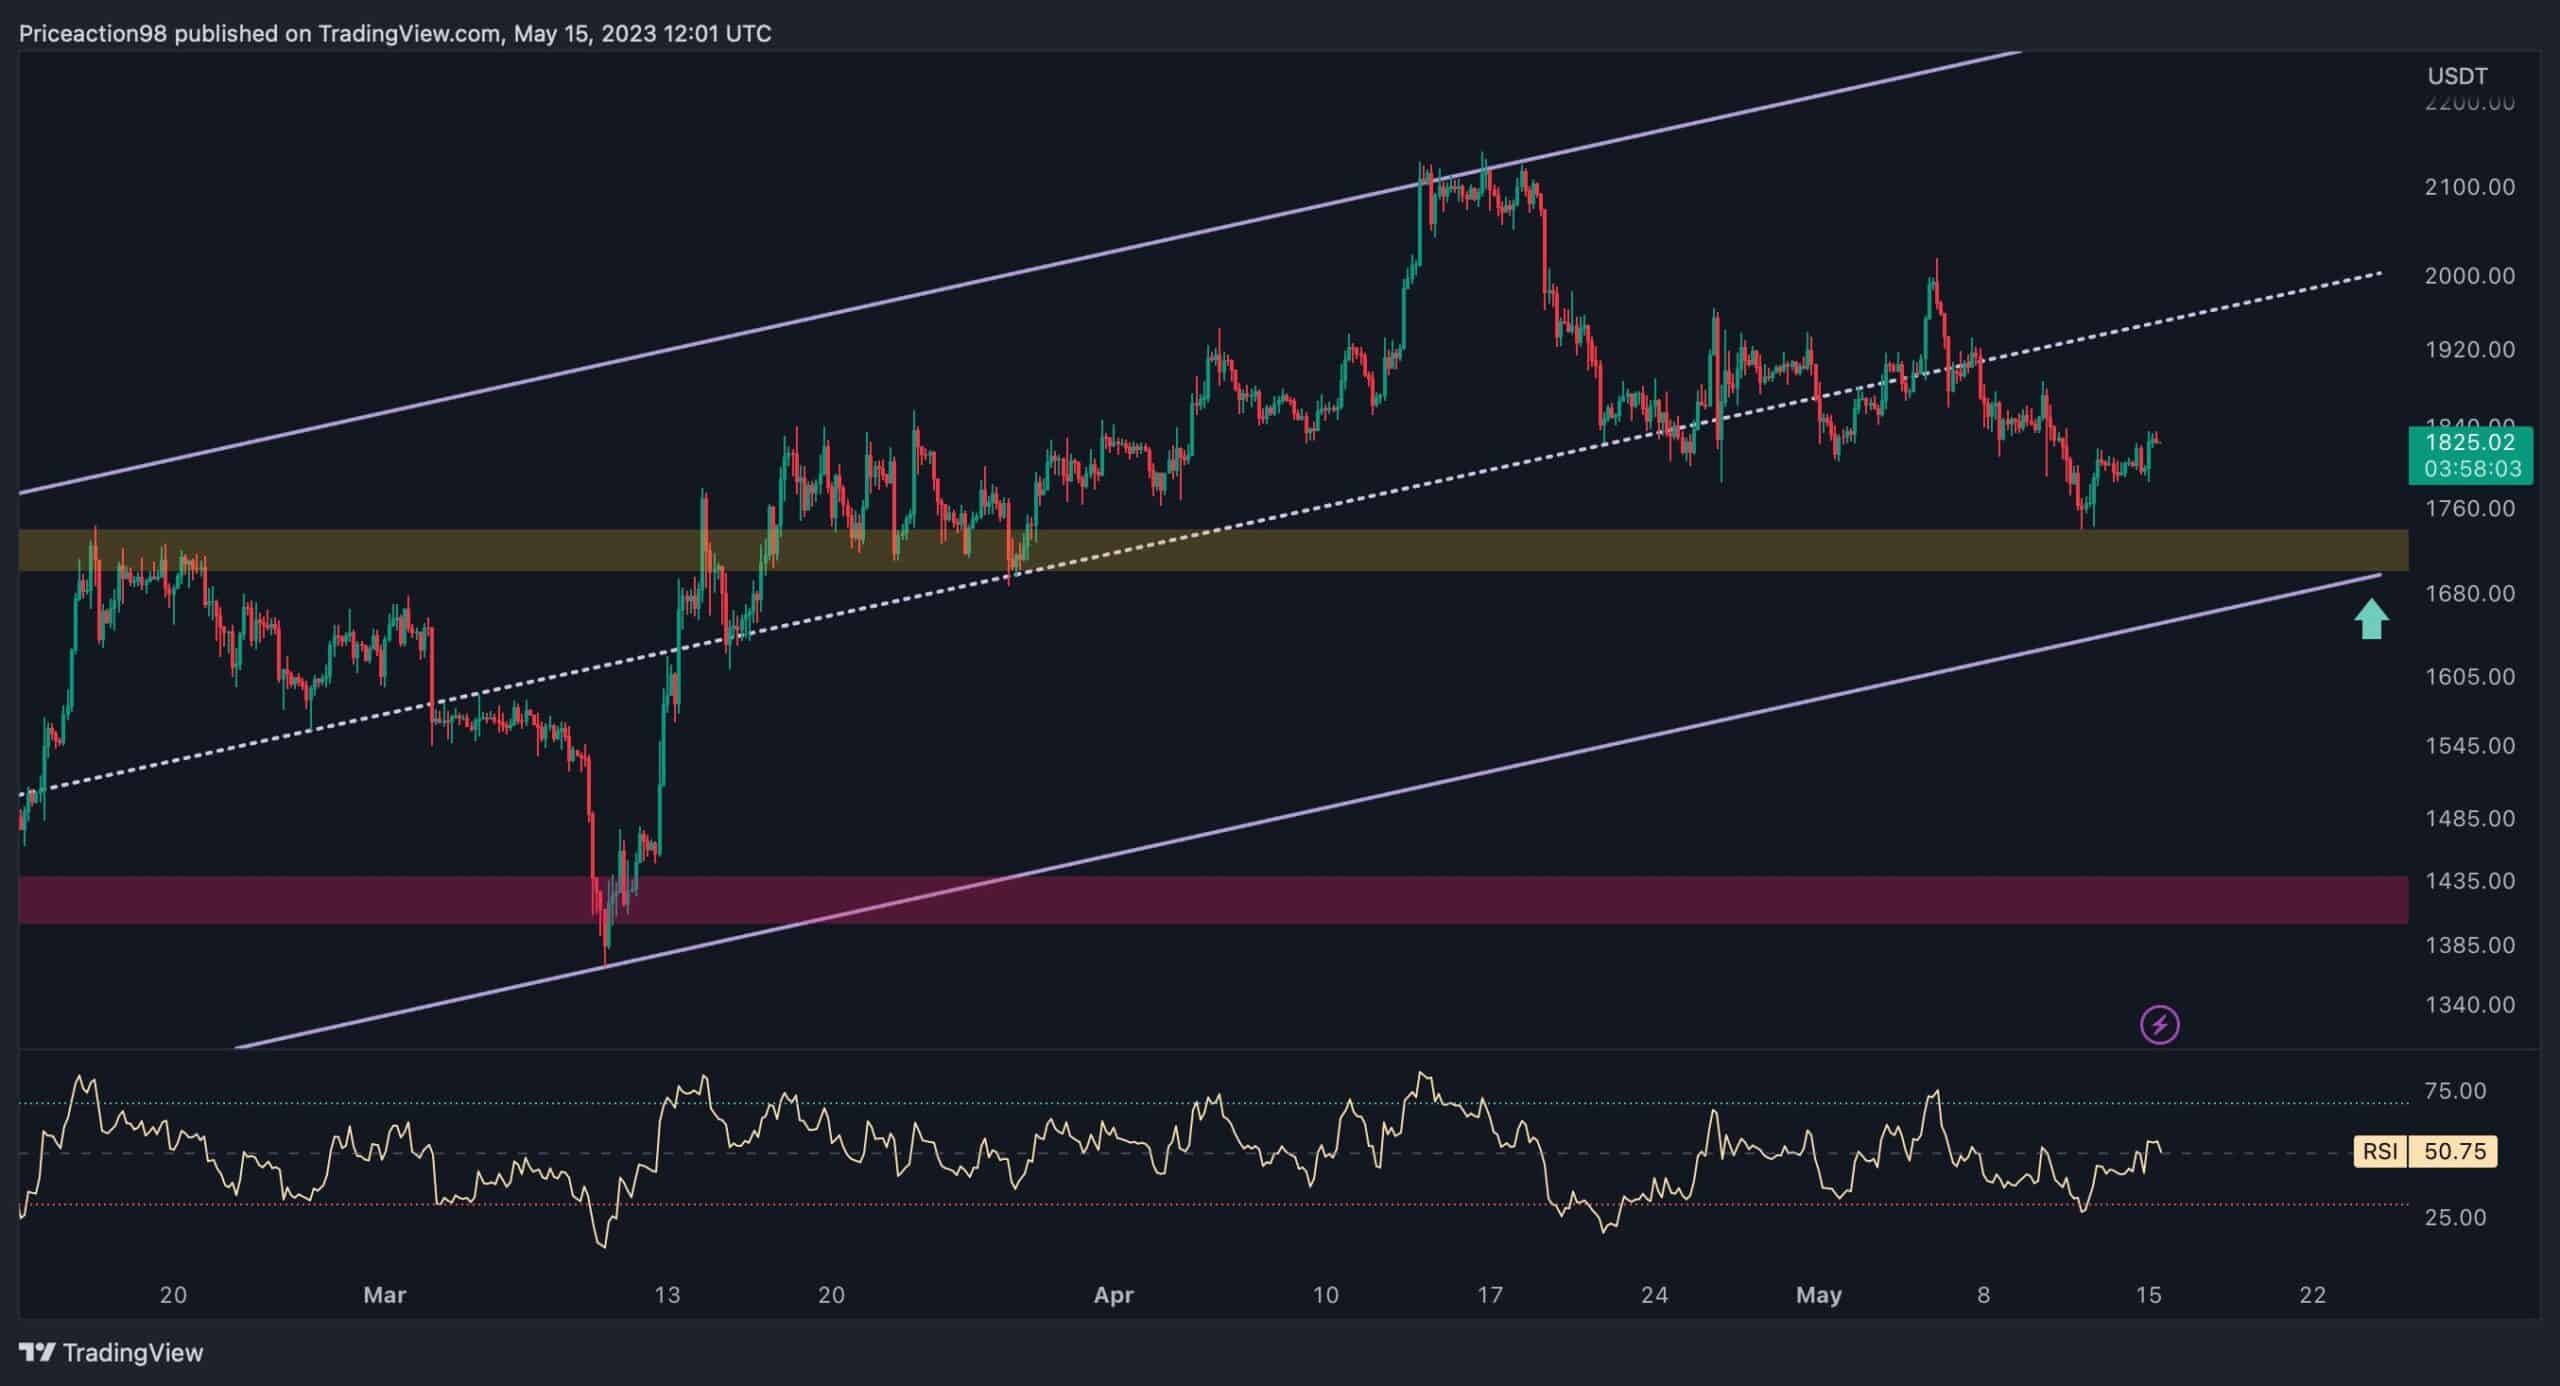
On the 4-hour timeframe, after a short-term consolidation correction stage around the channel’s middle boundary, the price continued plummeting toward the $1.7K support region. However, after reaching it, the cryptocurrency experienced a slight rebound, initiating a slow uptrend rally.
Ultimately, a downward break of the $1.7K support zone and the ascending channel’s lower boundary would lead to a cascade resulting from long positions getting liquidated. Conversely, if supported, the price could potentially aim for the channel’s mid-boundary and even the $2.1K resistance region.
On-chain Analysis
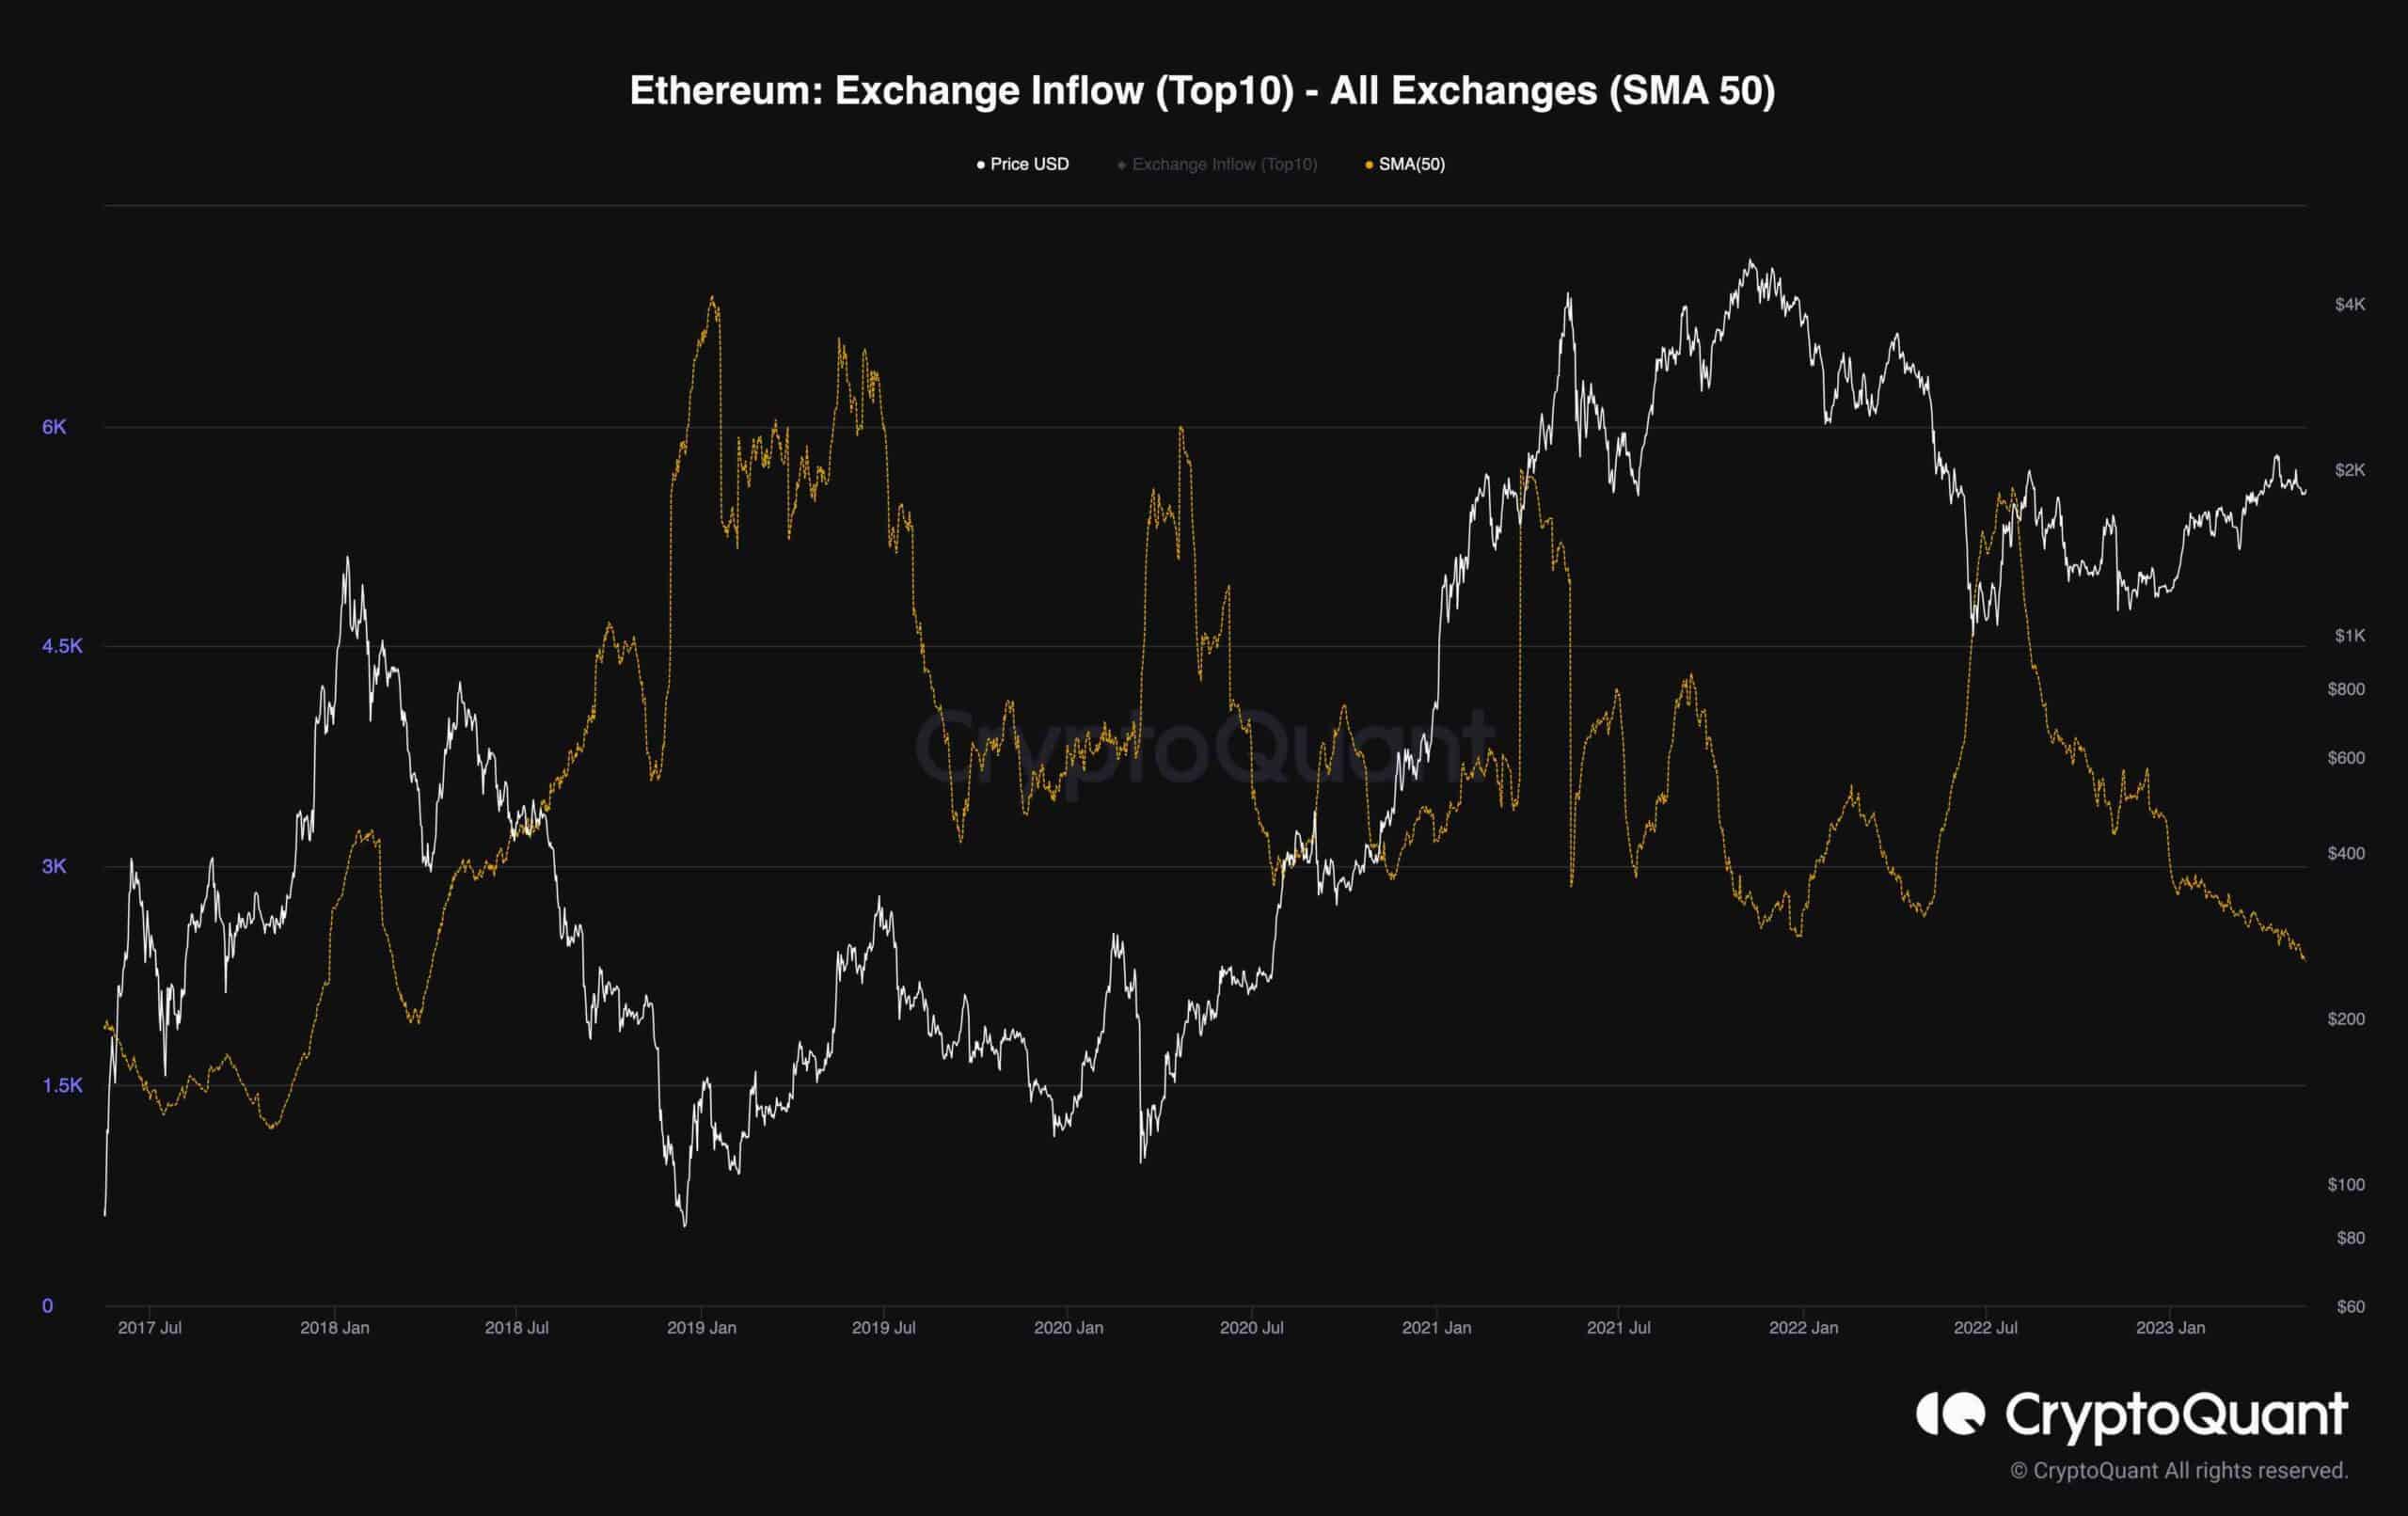
The following chart demonstrates the Exchange Inflow (Top 10) metric alongside Ethereum’s price. The metric respectfully measures the total amount of coins from the top ten transactions that flow into the exchanges.
High values indicate an increase in investors depositing a large amount at once. This could mean higher selling pressure and a potential future price drop.
Considering the chart, the Exchange Inflow (Top 10) metric’s 50-day moving average has been in a significant downtrend since July 2022, when the market was experiencing a consolidation stage without a clear direction.
However, despite Ethereum’s recent uptrend, the metric has continued to decline, suggesting that the selling pressure is not at concerning levels yet. Hence, its overall outlook remains bullish for the mid-term.