Ethereum’s price has been making corrections following the rally over the last few months. However, there are plenty of support levels that could hold the price in the short term. Technical Analysis By: Edris The Daily Chart Looking at the daily timeframe, the price has been on the decline over a period of several weeks after failing to reach the 00 resistance level. The 50-day moving average is currently holding the market around the 00 level, with 00 also providing support. In case the price rebounds from this area, a rapid rise toward the 00 level could be expected. On the other hand, a breakdown would result in a further correction towards the 200-day moving average, trending around the 00 mark. The RSI continues to oscillate around the 50% threshold
Topics:
CryptoVizArt considers the following as important: ETH Analysis, ETHBTC, Ethereum (ETH) Price, ethusd
This could be interesting, too:
Mandy Williams writes Ethereum Derivatives Metrics Signal Modest Downside Tail Risk Ahead: Nansen
Jordan Lyanchev writes Weekly Bitcoin, Ethereum ETF Recap: Light at the End of the Tunnel for BTC
CryptoVizArt writes Will Weak Momentum Drive ETH to .5K? (Ethereum Price Analysis)
Jordan Lyanchev writes Bybit Hack Fallout: Arthur Hayes, Samson Mow Push for Ethereum Rollback
Ethereum’s price has been making corrections following the rally over the last few months. However, there are plenty of support levels that could hold the price in the short term.
Technical Analysis
By: Edris
The Daily Chart
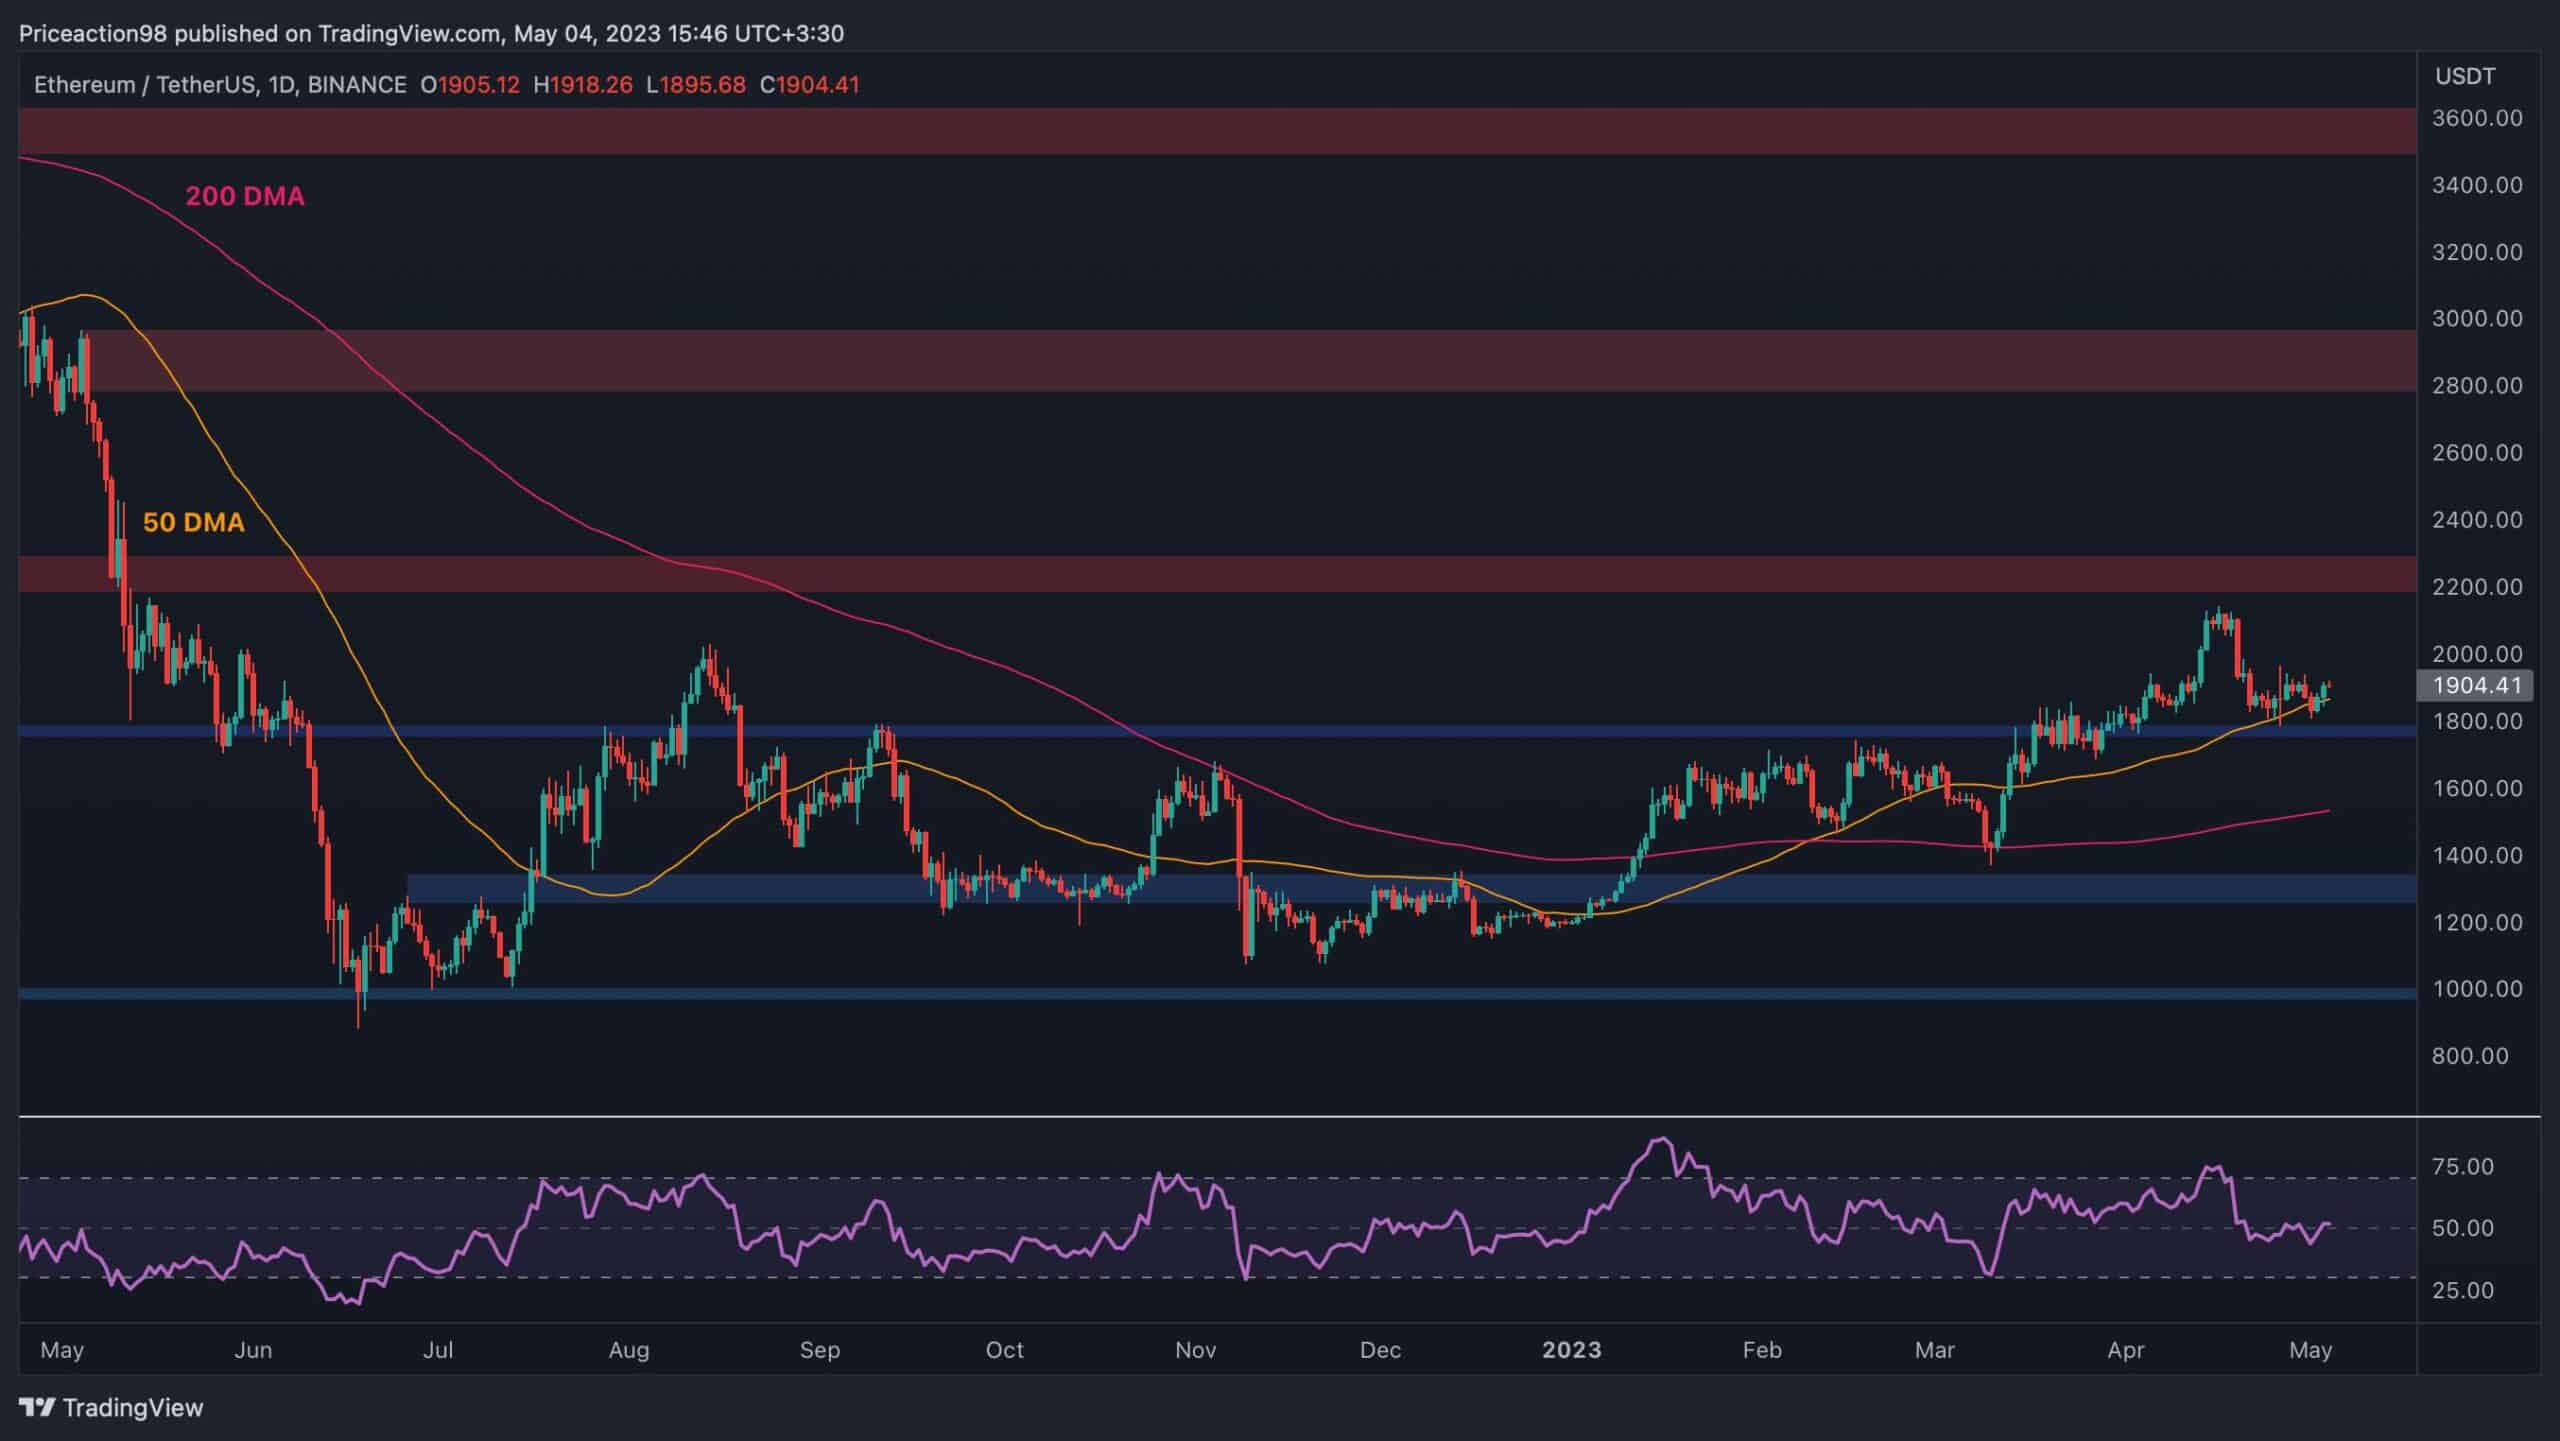
Looking at the daily timeframe, the price has been on the decline over a period of several weeks after failing to reach the $2200 resistance level. The 50-day moving average is currently holding the market around the $1900 level, with $1800 also providing support.
In case the price rebounds from this area, a rapid rise toward the $2200 level could be expected. On the other hand, a breakdown would result in a further correction towards the 200-day moving average, trending around the $1600 mark. The RSI continues to oscillate around the 50% threshold recently.
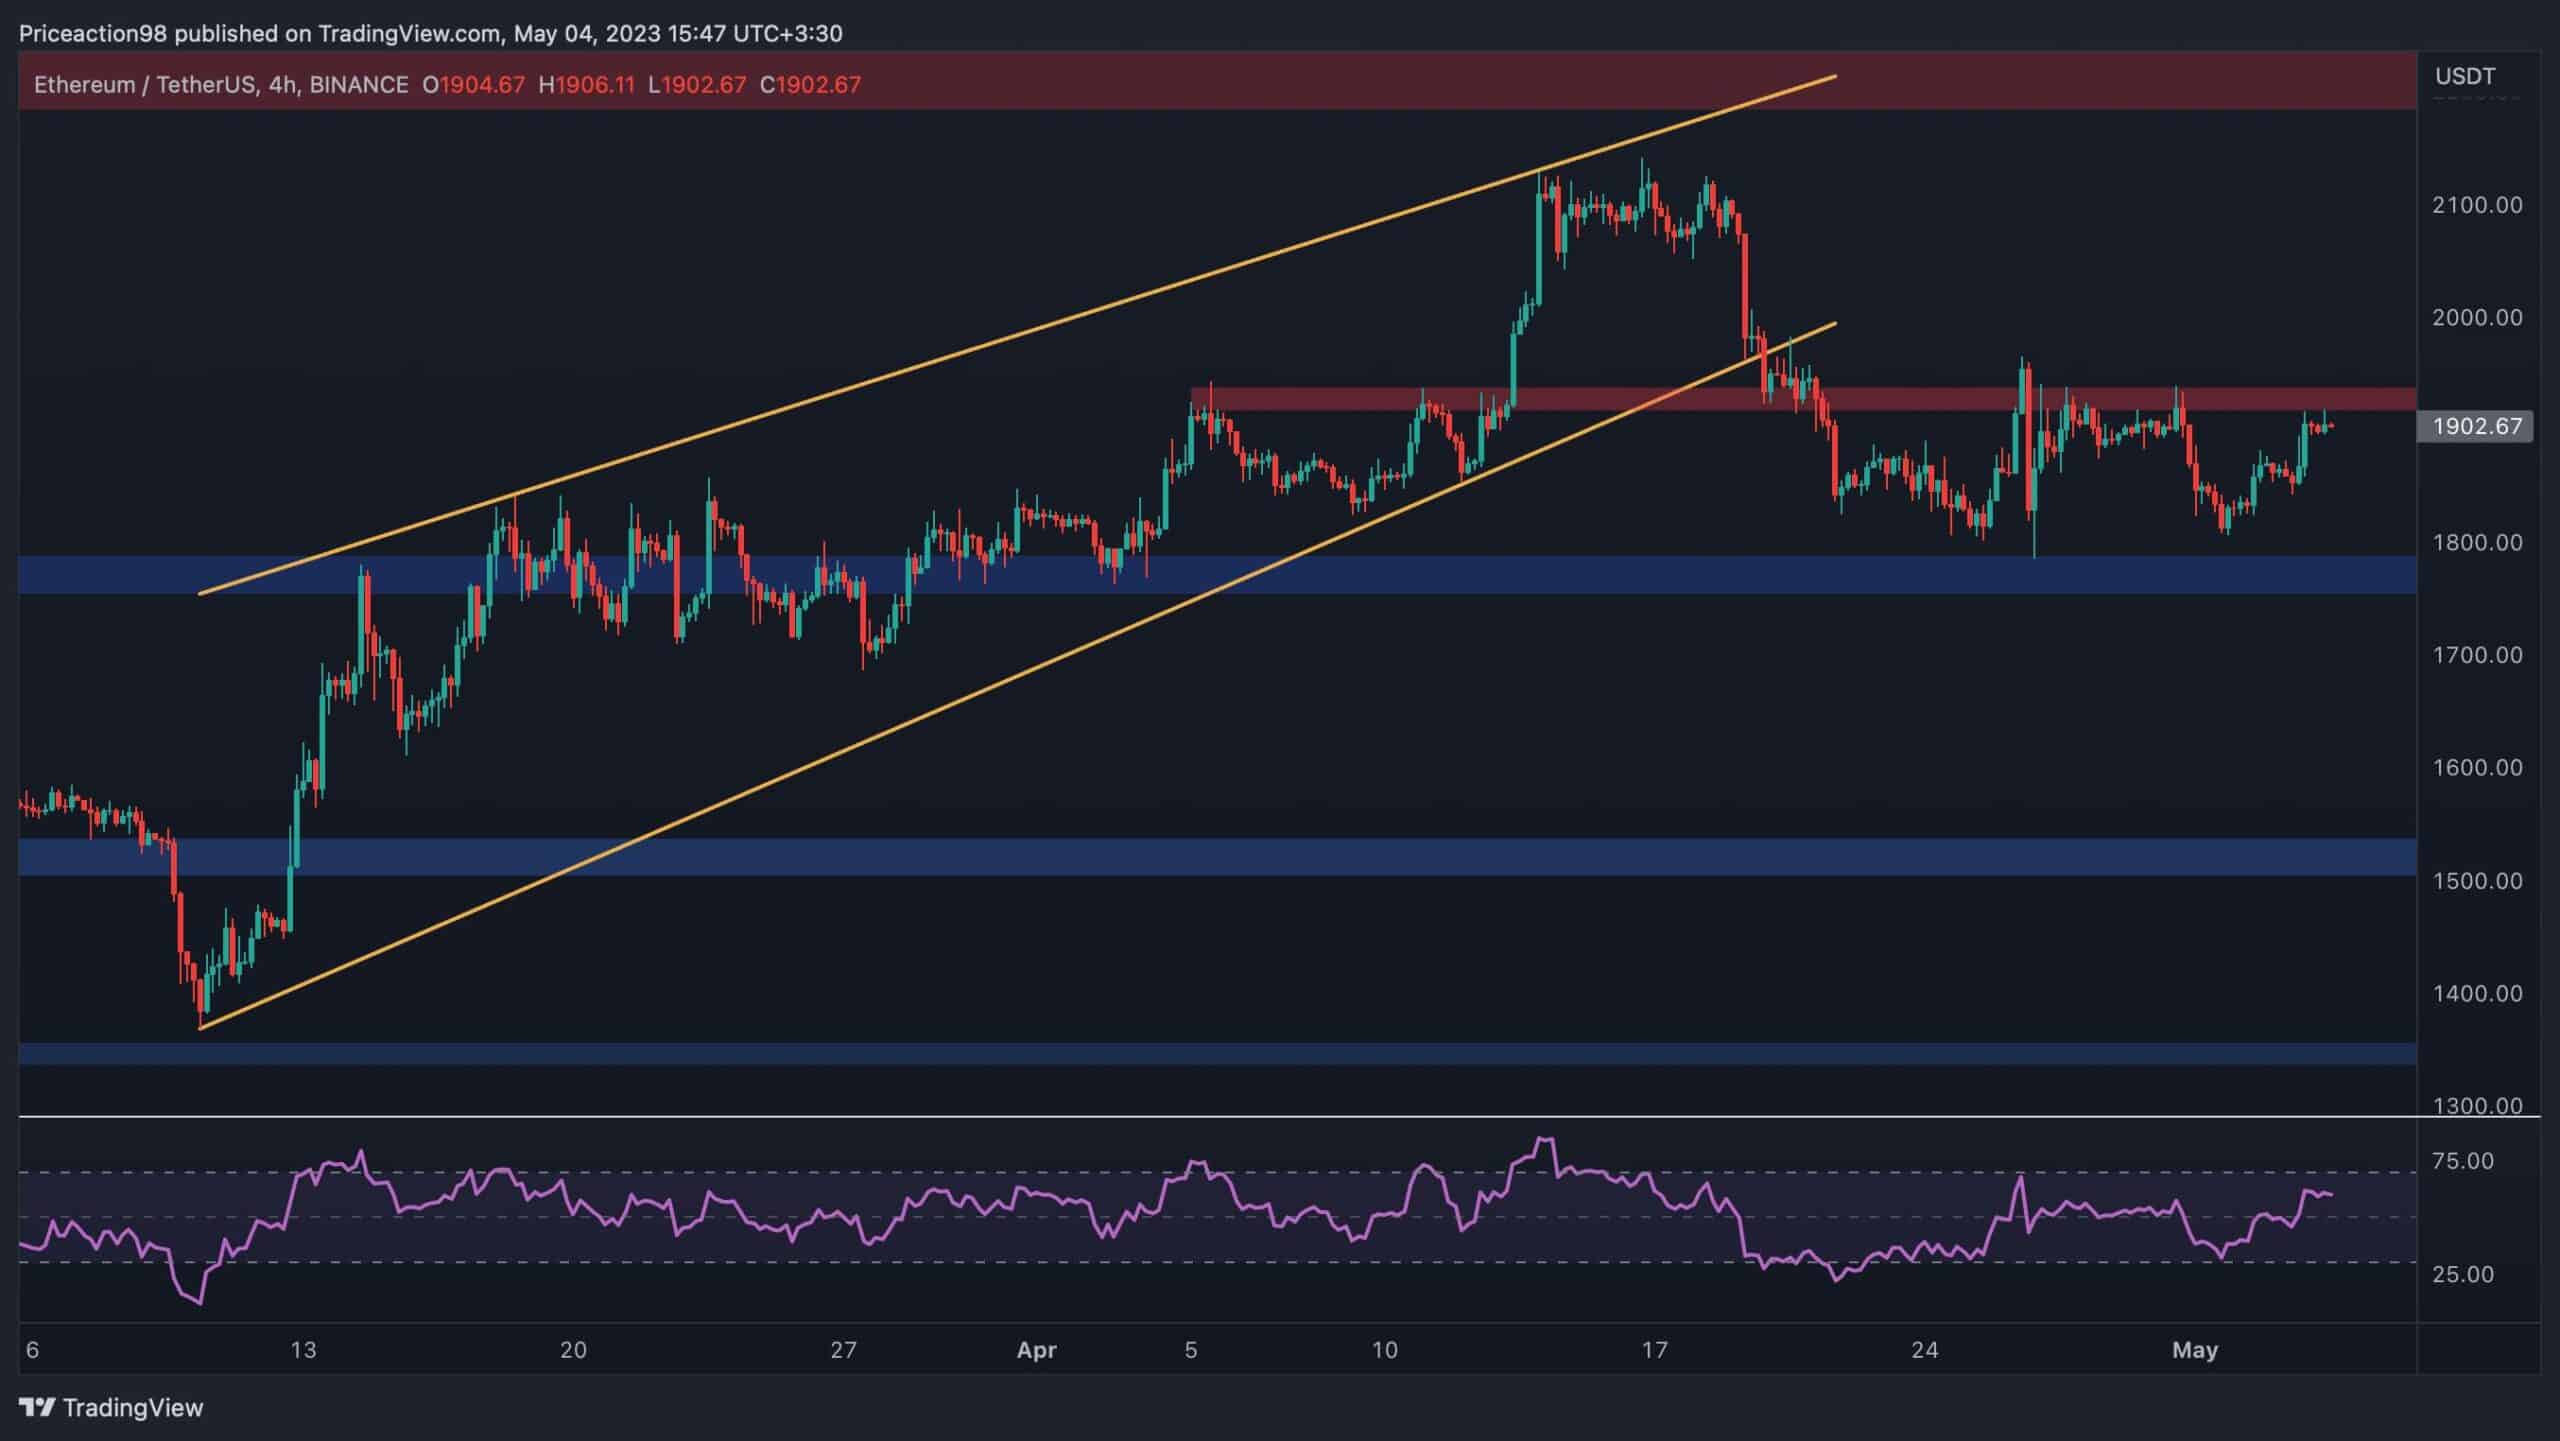
The 4-Hour Chart
On the 4-hour chart, the price seems to be attempting to escape the range between the $1800 and $1900 levels. The $1900 resistance is currently being tested once more, and a bullish breakout would pave the way for a surge toward values above $2000.
However, another rejection could initiate a bearish move toward the $1800 support level and potentially even lower. The RSI indicator is trending above the 50% mark in this timeframe, indicating that the bulls are in control and a bullish breakout is more probable.