Ethereum’s price action has been relatively bearish in recent months, breaking below multiple support levels. However, investors can still be hopeful that an upward movement may be on the horizon. Technical Analysis By Edris The Daily Chart As depicted on the daily timeframe, the price recently tested the ,750 resistance level but failed to break above it and was rejected to the downside. The 50-day moving average, located around the ,650 mark, is currently providing support and preventing a further decline to the ,550 support level. However, if both the moving average and the mentioned support level are breached, the situation could deteriorate rapidly, with the price potentially dropping to ,400 or even lower. Nevertheless, as long as these levels hold, there is
Topics:
CryptoVizArt considers the following as important: ETH Analysis, ETHBTC, Ethereum (ETH) Price, ethusd
This could be interesting, too:
Mandy Williams writes Ethereum Derivatives Metrics Signal Modest Downside Tail Risk Ahead: Nansen
Jordan Lyanchev writes Weekly Bitcoin, Ethereum ETF Recap: Light at the End of the Tunnel for BTC
CryptoVizArt writes Will Weak Momentum Drive ETH to .5K? (Ethereum Price Analysis)
Jordan Lyanchev writes Bybit Hack Fallout: Arthur Hayes, Samson Mow Push for Ethereum Rollback
Ethereum’s price action has been relatively bearish in recent months, breaking below multiple support levels. However, investors can still be hopeful that an upward movement may be on the horizon.
Technical Analysis
By Edris
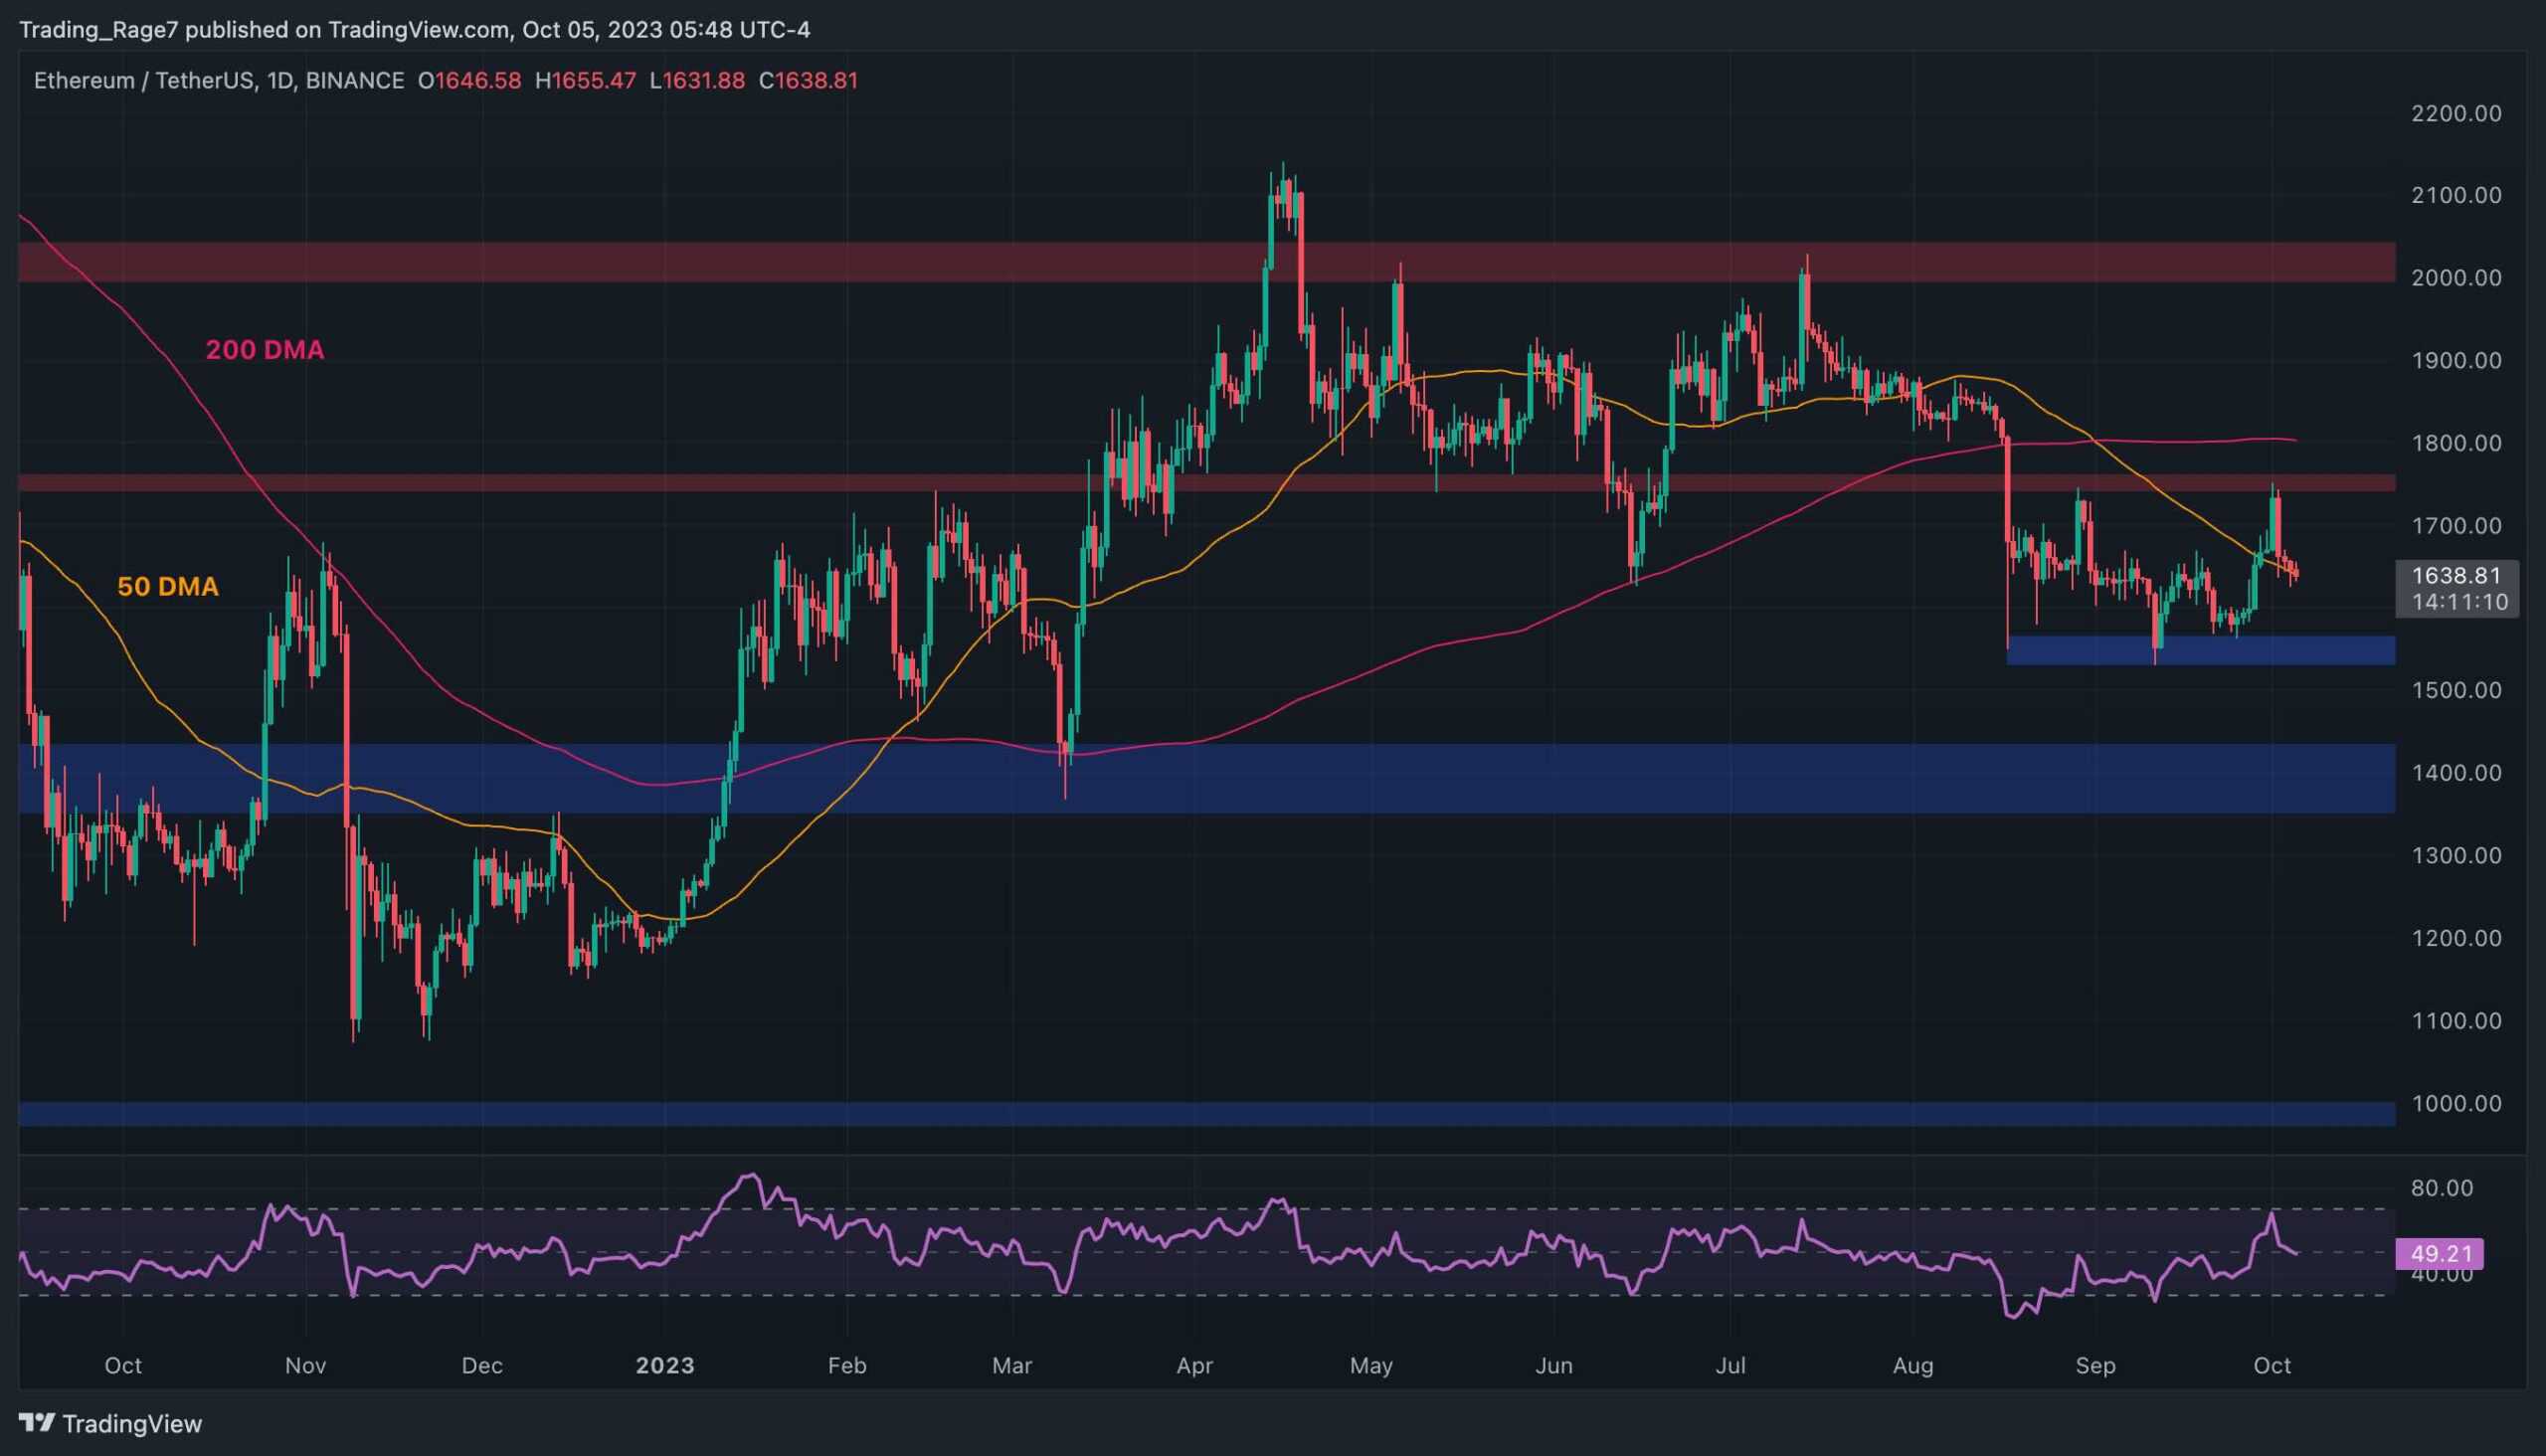
The Daily Chart
As depicted on the daily timeframe, the price recently tested the $1,750 resistance level but failed to break above it and was rejected to the downside.
The 50-day moving average, located around the $1,650 mark, is currently providing support and preventing a further decline to the $1,550 support level. However, if both the moving average and the mentioned support level are breached, the situation could deteriorate rapidly, with the price potentially dropping to $1,400 or even lower.
Nevertheless, as long as these levels hold, there is a possibility of a rally toward the 200-day moving average, which is near the $1,800 level. A breakout above the 200-day MA would signal a bullish market shift in the mid-term.
The 4-Hour Chart
On the 4-hour chart, the price is in a critical area. After a recent bullish breakout from a large falling wedge pattern, the price tested and was rejected at the $1,750 resistance level.
It is currently hovering around the $1,650 short-term support zone. If this level holds, the price is likely to initiate a new rally and potentially break above $1,750, aiming for the $2,000 level in the coming months.

On-Chain Analysis
By Edris
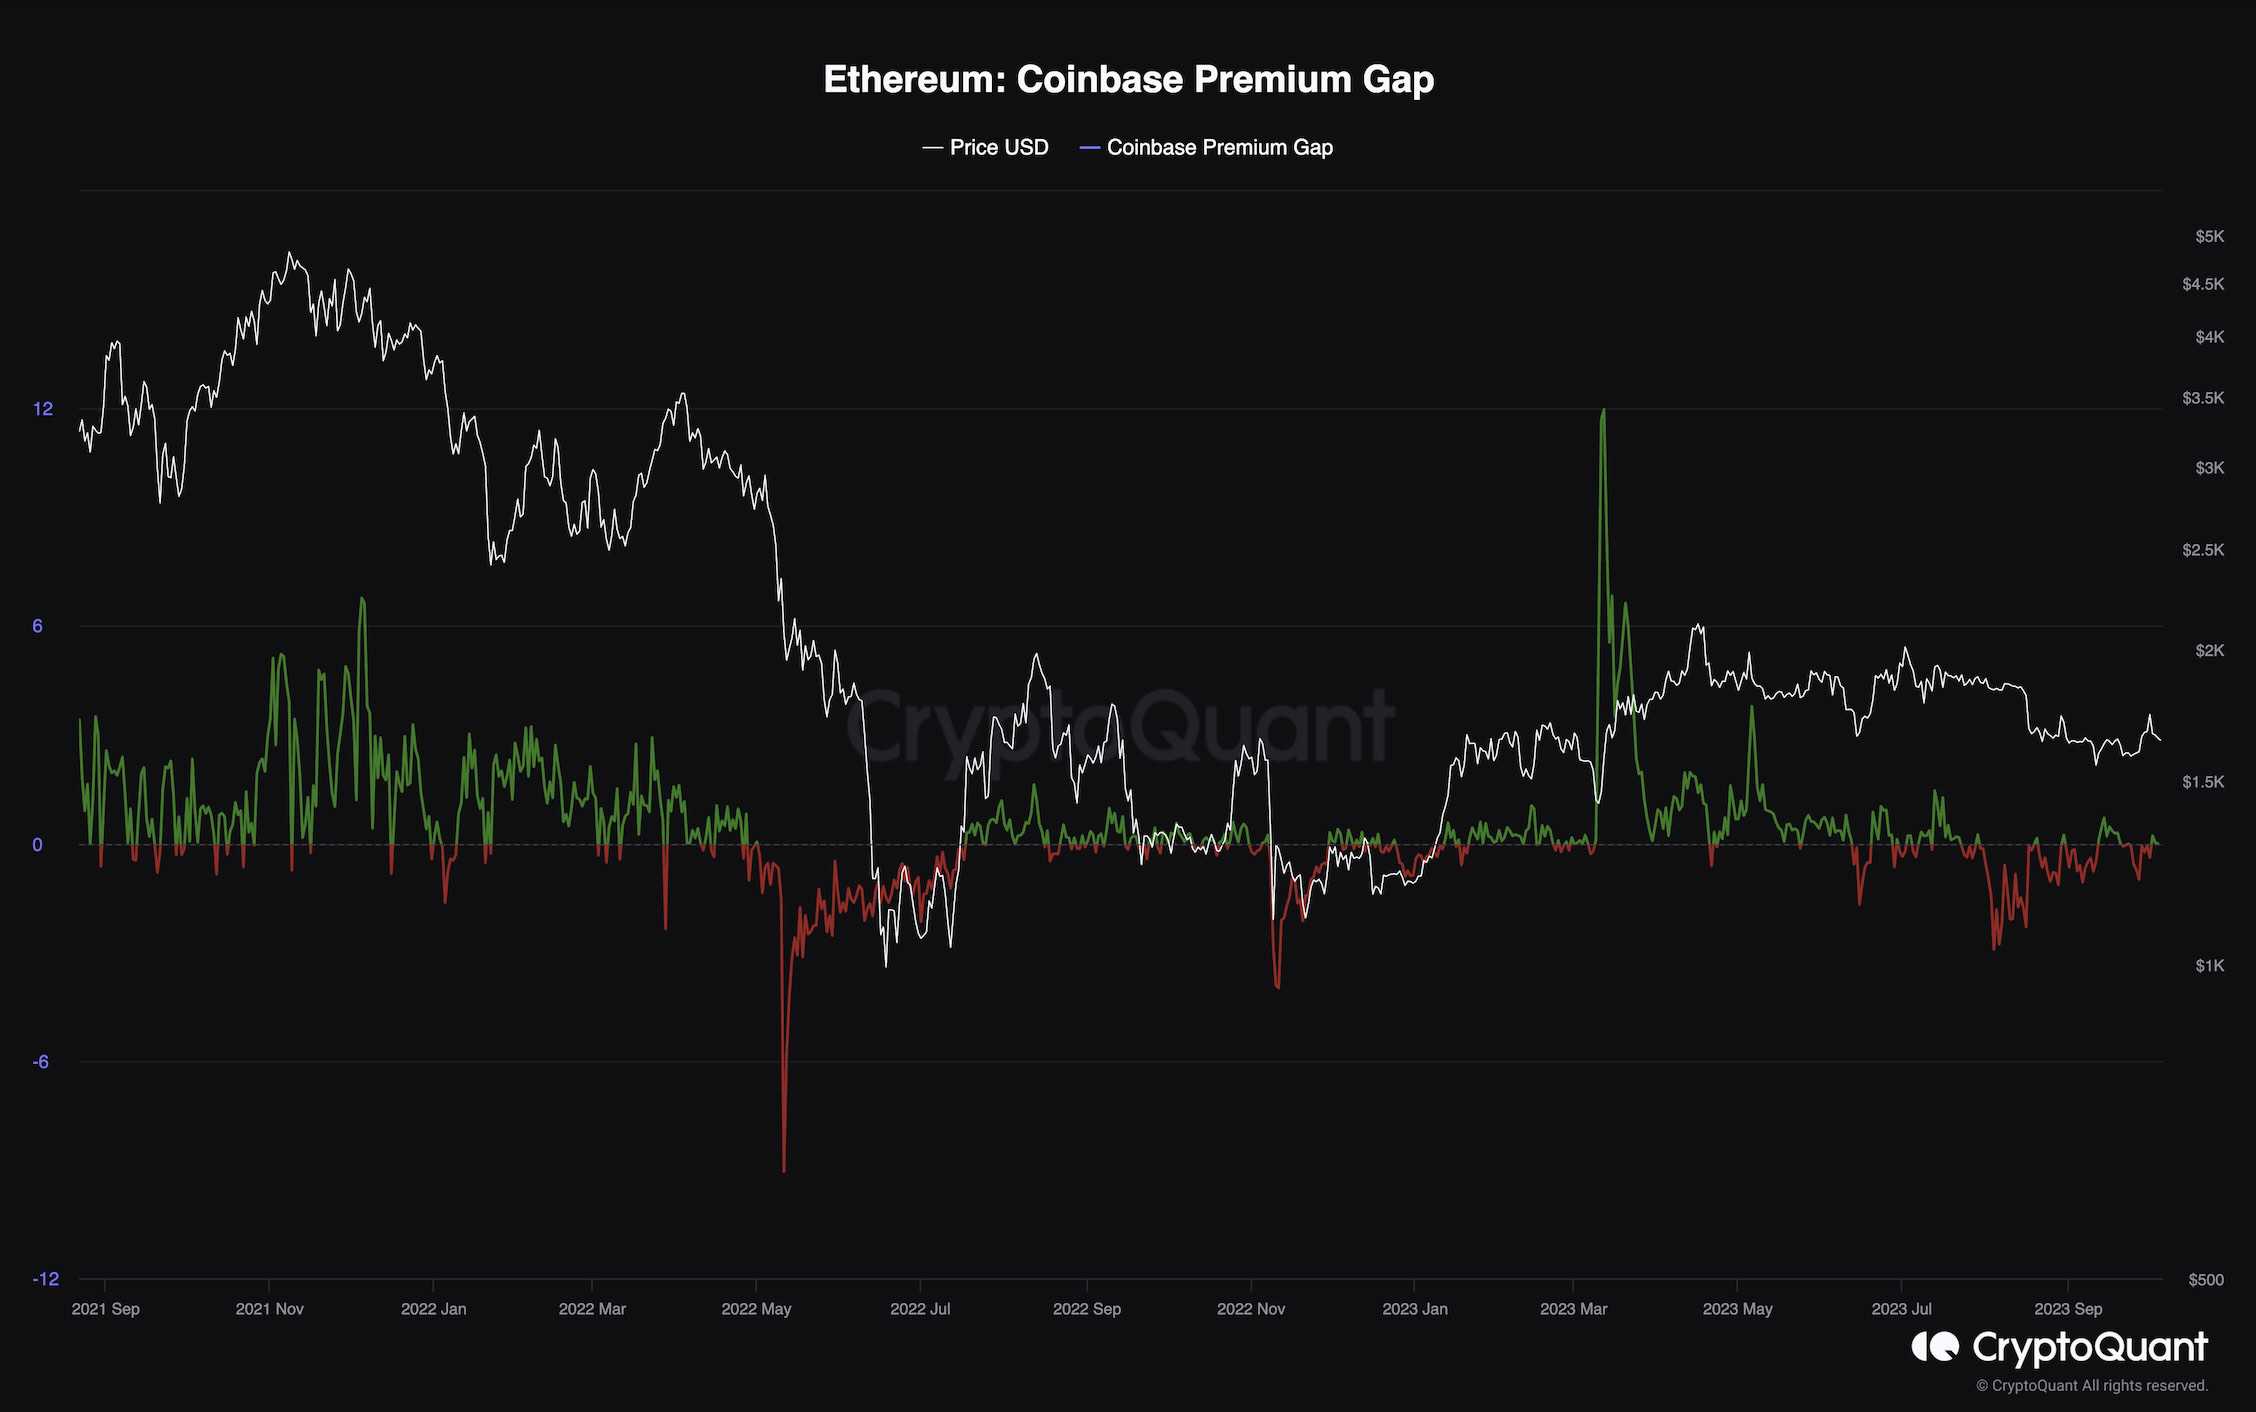
Ethereum’s price has been moving sideways, providing little indication of its future direction from a technical analysis perspective. Therefore, it would be beneficial to examine market sentiment.
This chart shows the Coinbase premium gap, which is the price difference between Coinbase’s BTC/USD pair and Binance’s BTC/USDT pair. It is used to measure buying or selling pressure from American investors. Positive values indicate buying pressure, while negative values indicate selling pressure.
It is evident that after several months of positive values, this metric has shown negative values in the past few months. This suggests that American investors are currently bearish on Ethereum and selling aggressively. Given their substantial financial resources, this behavior could lead to a market crash if conditions persist.