Technical Analysis By TradingRage Ethereum’s price has been on the rise for the past few months, breaking above several resistance levels. Yet, the market is currently consolidating around the ,000 mark, failing to continue its bullish momentum. The Daily Chart On the daily timeframe, the price has been consolidating around the ,000 level after getting rejected from the ,150 area once earlier. Yet, the ,150 level has rejected the price once again, and the market is currently testing the ,000 level, which has turned into a support now. If it is broken down, it would be likely that a double-top pattern forms and a deeper decline occurs. Considering the fact that the relative strength index is still showing values above 50%, which means that the momentum is in
Topics:
CryptoVizArt considers the following as important: ETH Analysis, ETHBTC, Ethereum (ETH) Price, ethusd
This could be interesting, too:
Mandy Williams writes Ethereum Derivatives Metrics Signal Modest Downside Tail Risk Ahead: Nansen
Jordan Lyanchev writes Weekly Bitcoin, Ethereum ETF Recap: Light at the End of the Tunnel for BTC
CryptoVizArt writes Will Weak Momentum Drive ETH to .5K? (Ethereum Price Analysis)
Jordan Lyanchev writes Bybit Hack Fallout: Arthur Hayes, Samson Mow Push for Ethereum Rollback
Technical Analysis
By TradingRage
Ethereum’s price has been on the rise for the past few months, breaking above several resistance levels. Yet, the market is currently consolidating around the $2,000 mark, failing to continue its bullish momentum.
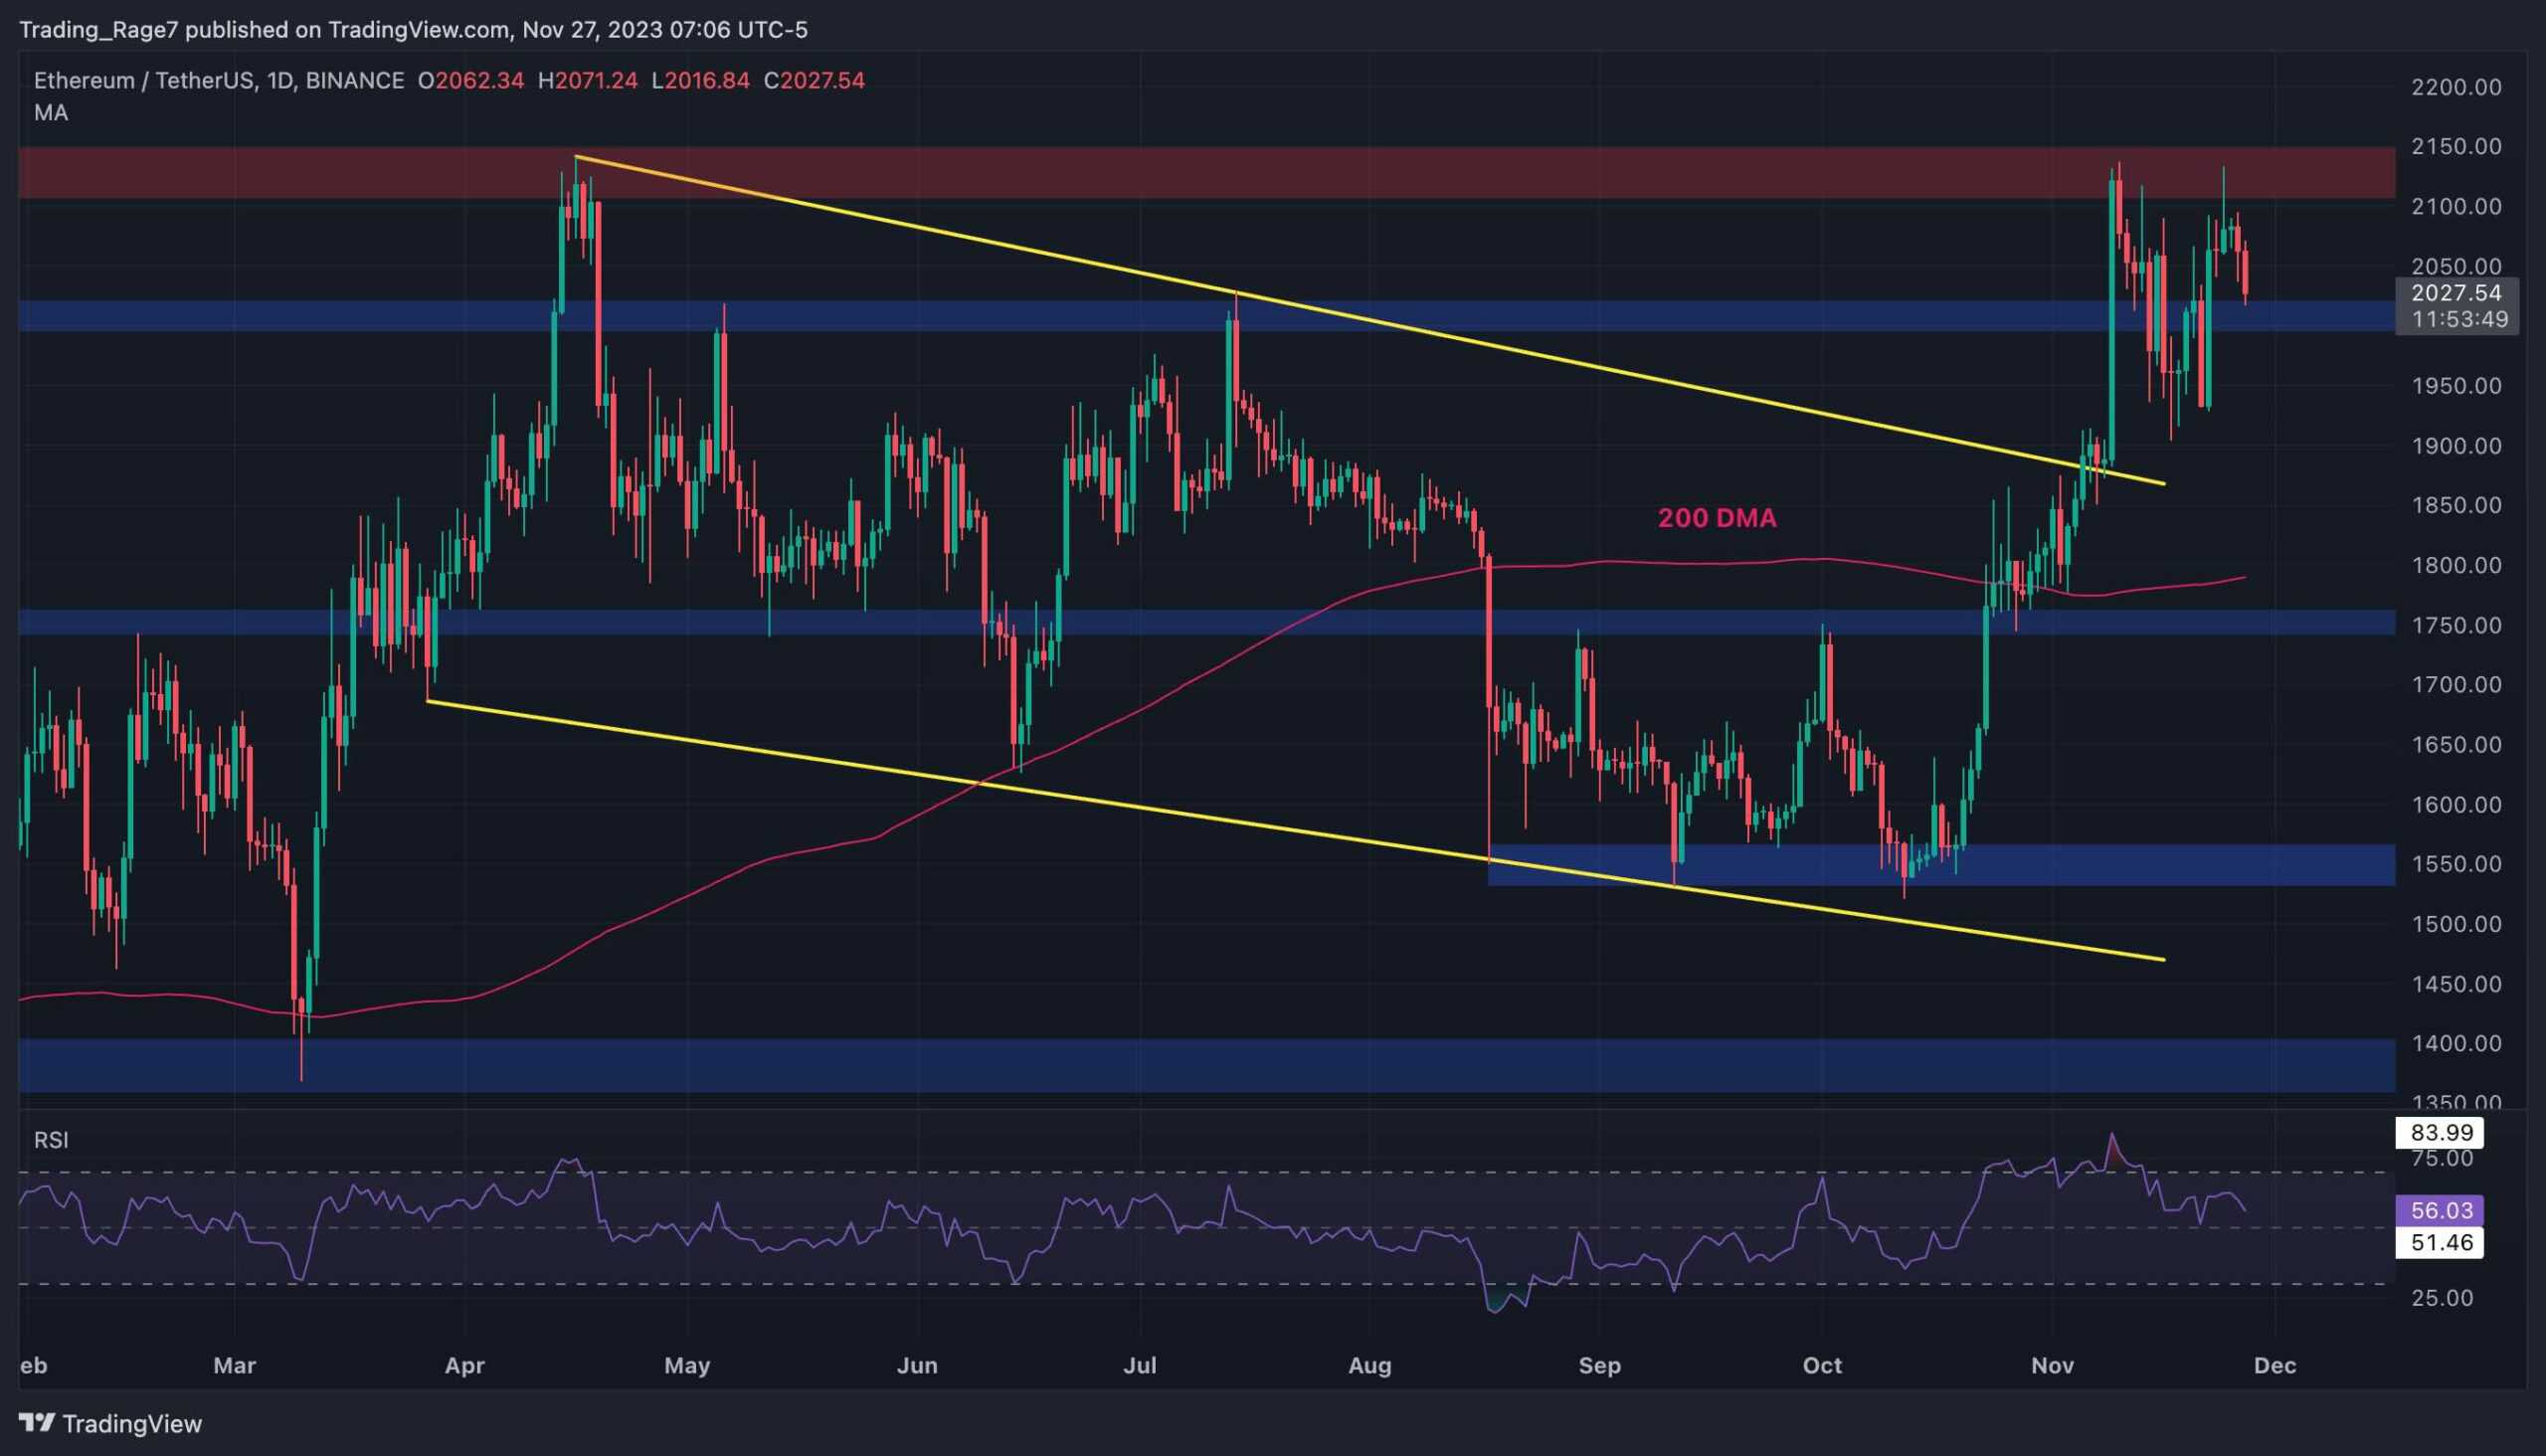
The Daily Chart
On the daily timeframe, the price has been consolidating around the $2,000 level after getting rejected from the $2,150 area once earlier.
Yet, the $2,150 level has rejected the price once again, and the market is currently testing the $2,000 level, which has turned into a support now. If it is broken down, it would be likely that a double-top pattern forms and a deeper decline occurs.
Considering the fact that the relative strength index is still showing values above 50%, which means that the momentum is in favor of the buyers, a bearish reversal seems improbable.
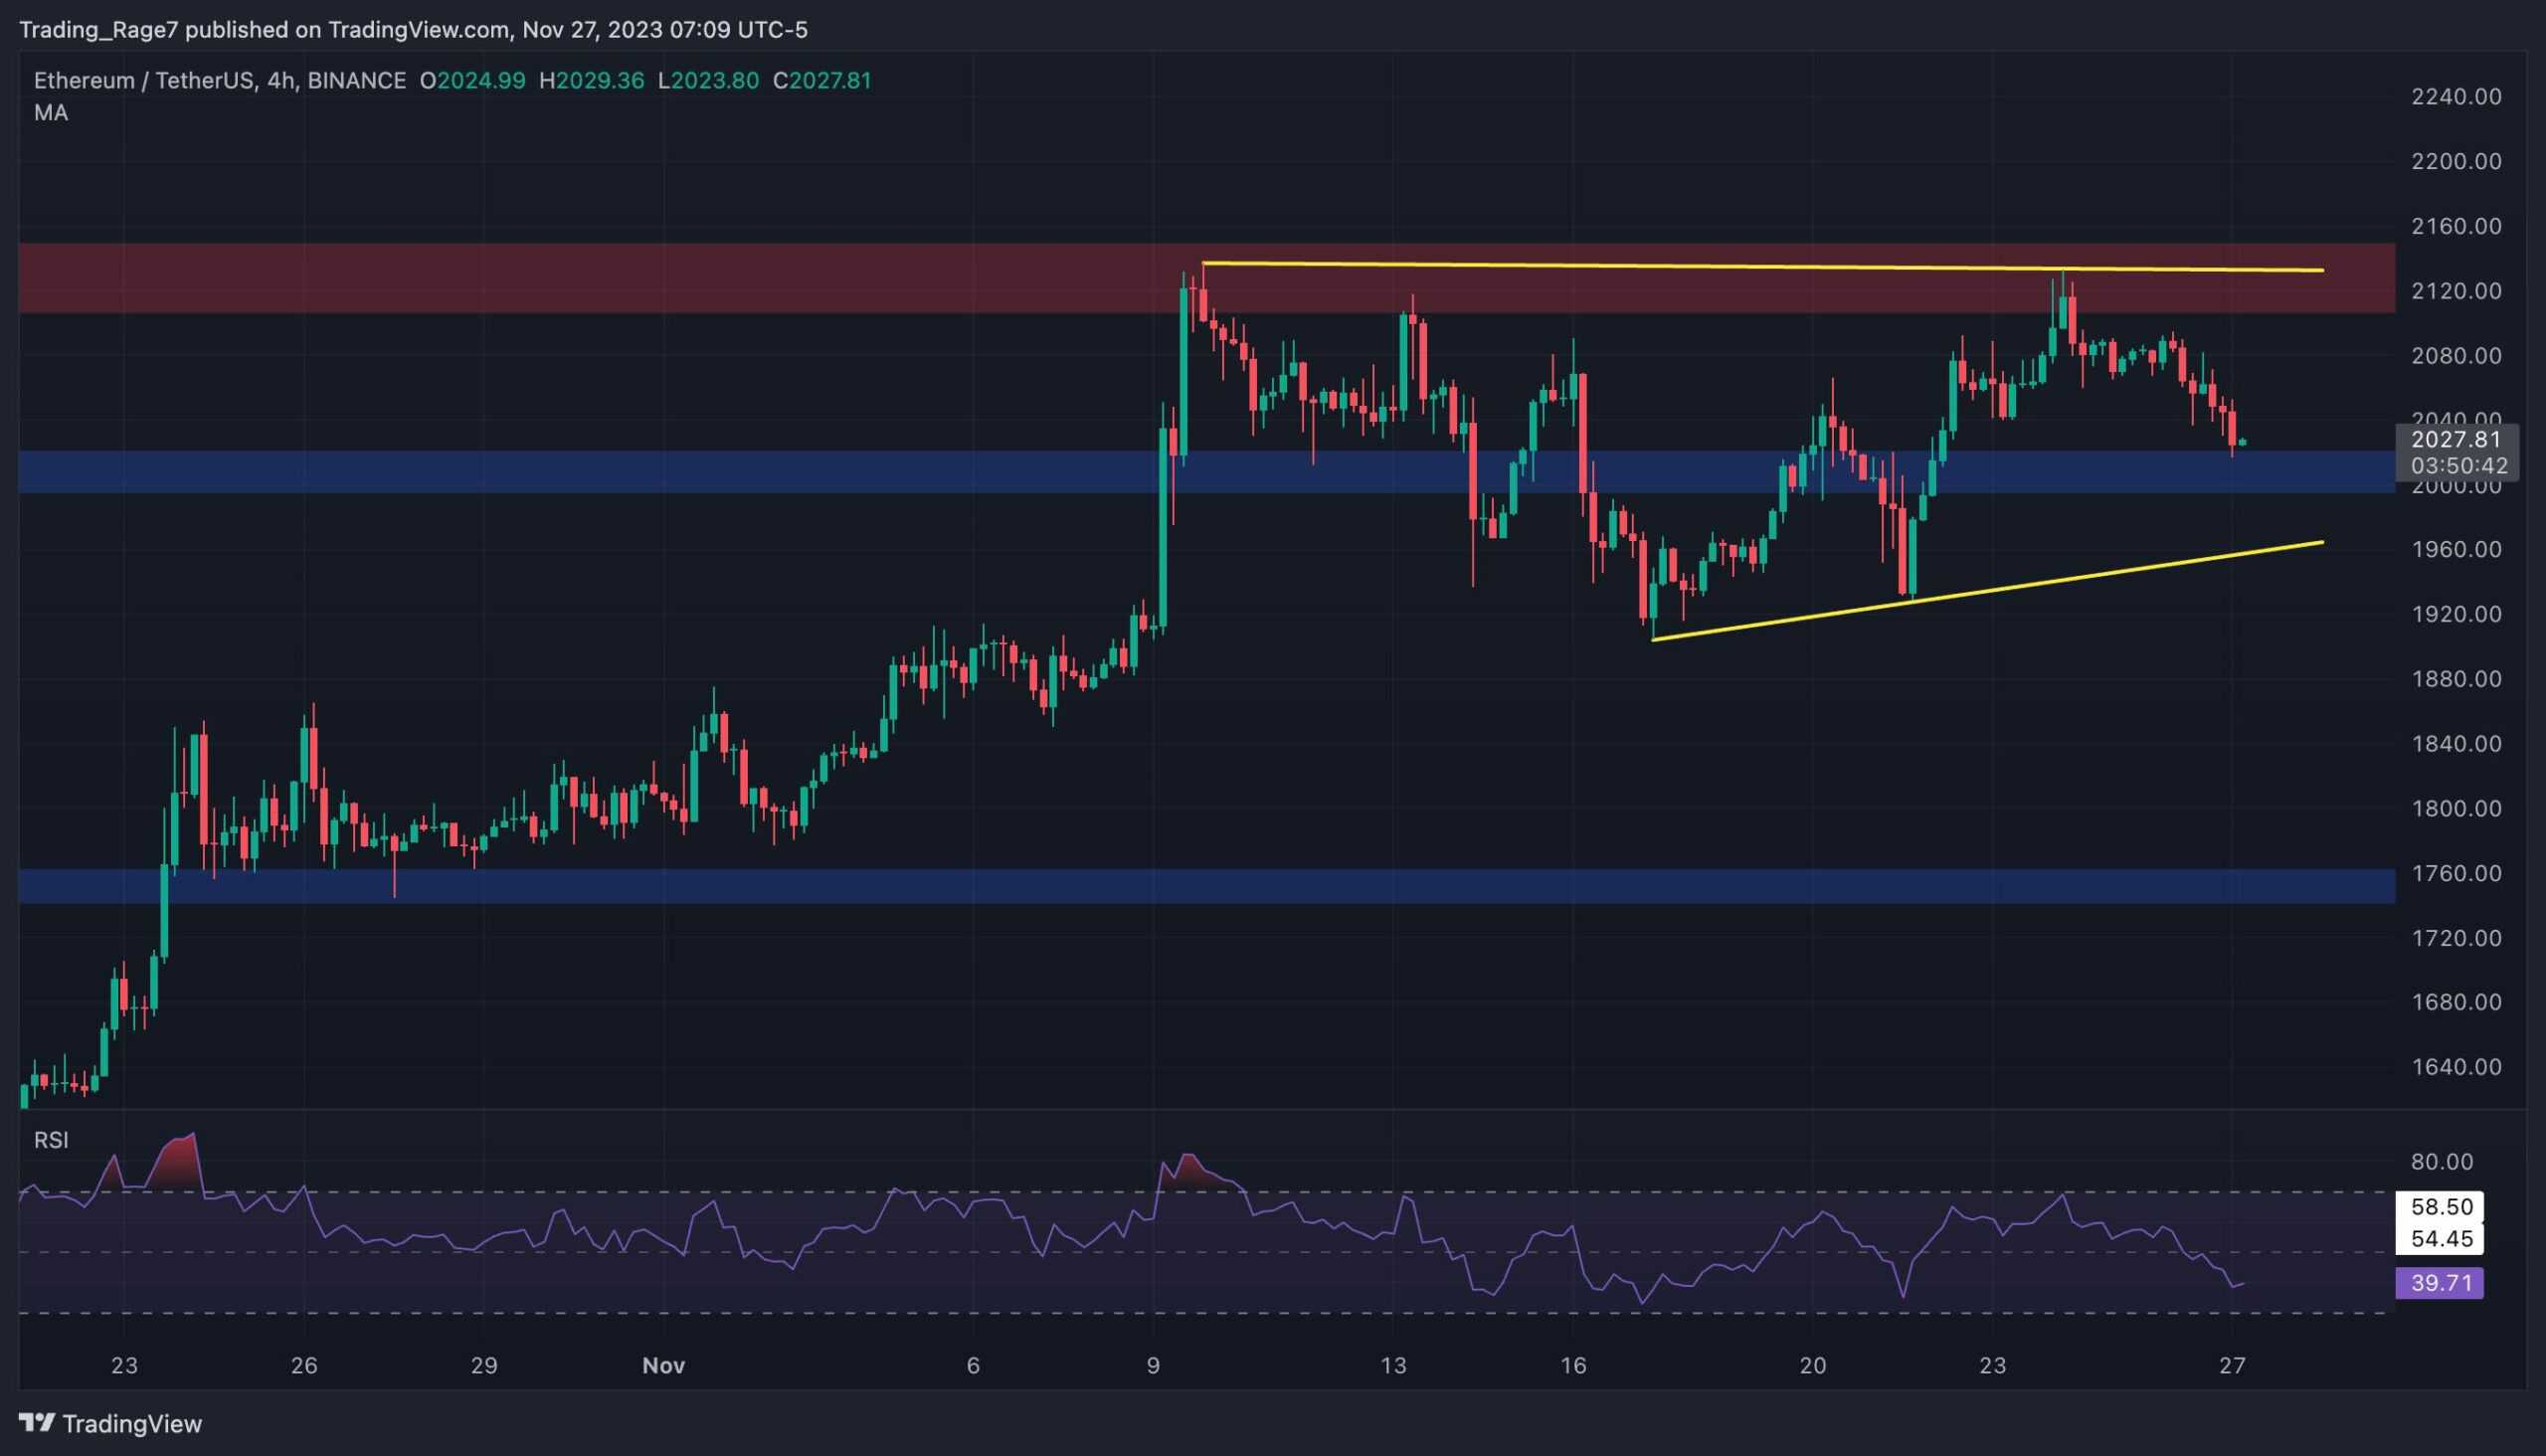
The 4-Hour Chart
Looking at the 4-hour chart, the recent price range becomes more clear. The price has been forming a triangle which is a classical continuation pattern.
Therefore, in case a breakout occurs to the upside, the market will likely begin another bullish wave. Yet, the relative strength index is demonstrating a bearish momentum at the moment, showing values below 50%. Therefore, a drop to the lower boundary of the pattern is expected first.
Sentiment Analysis
By TradingRage
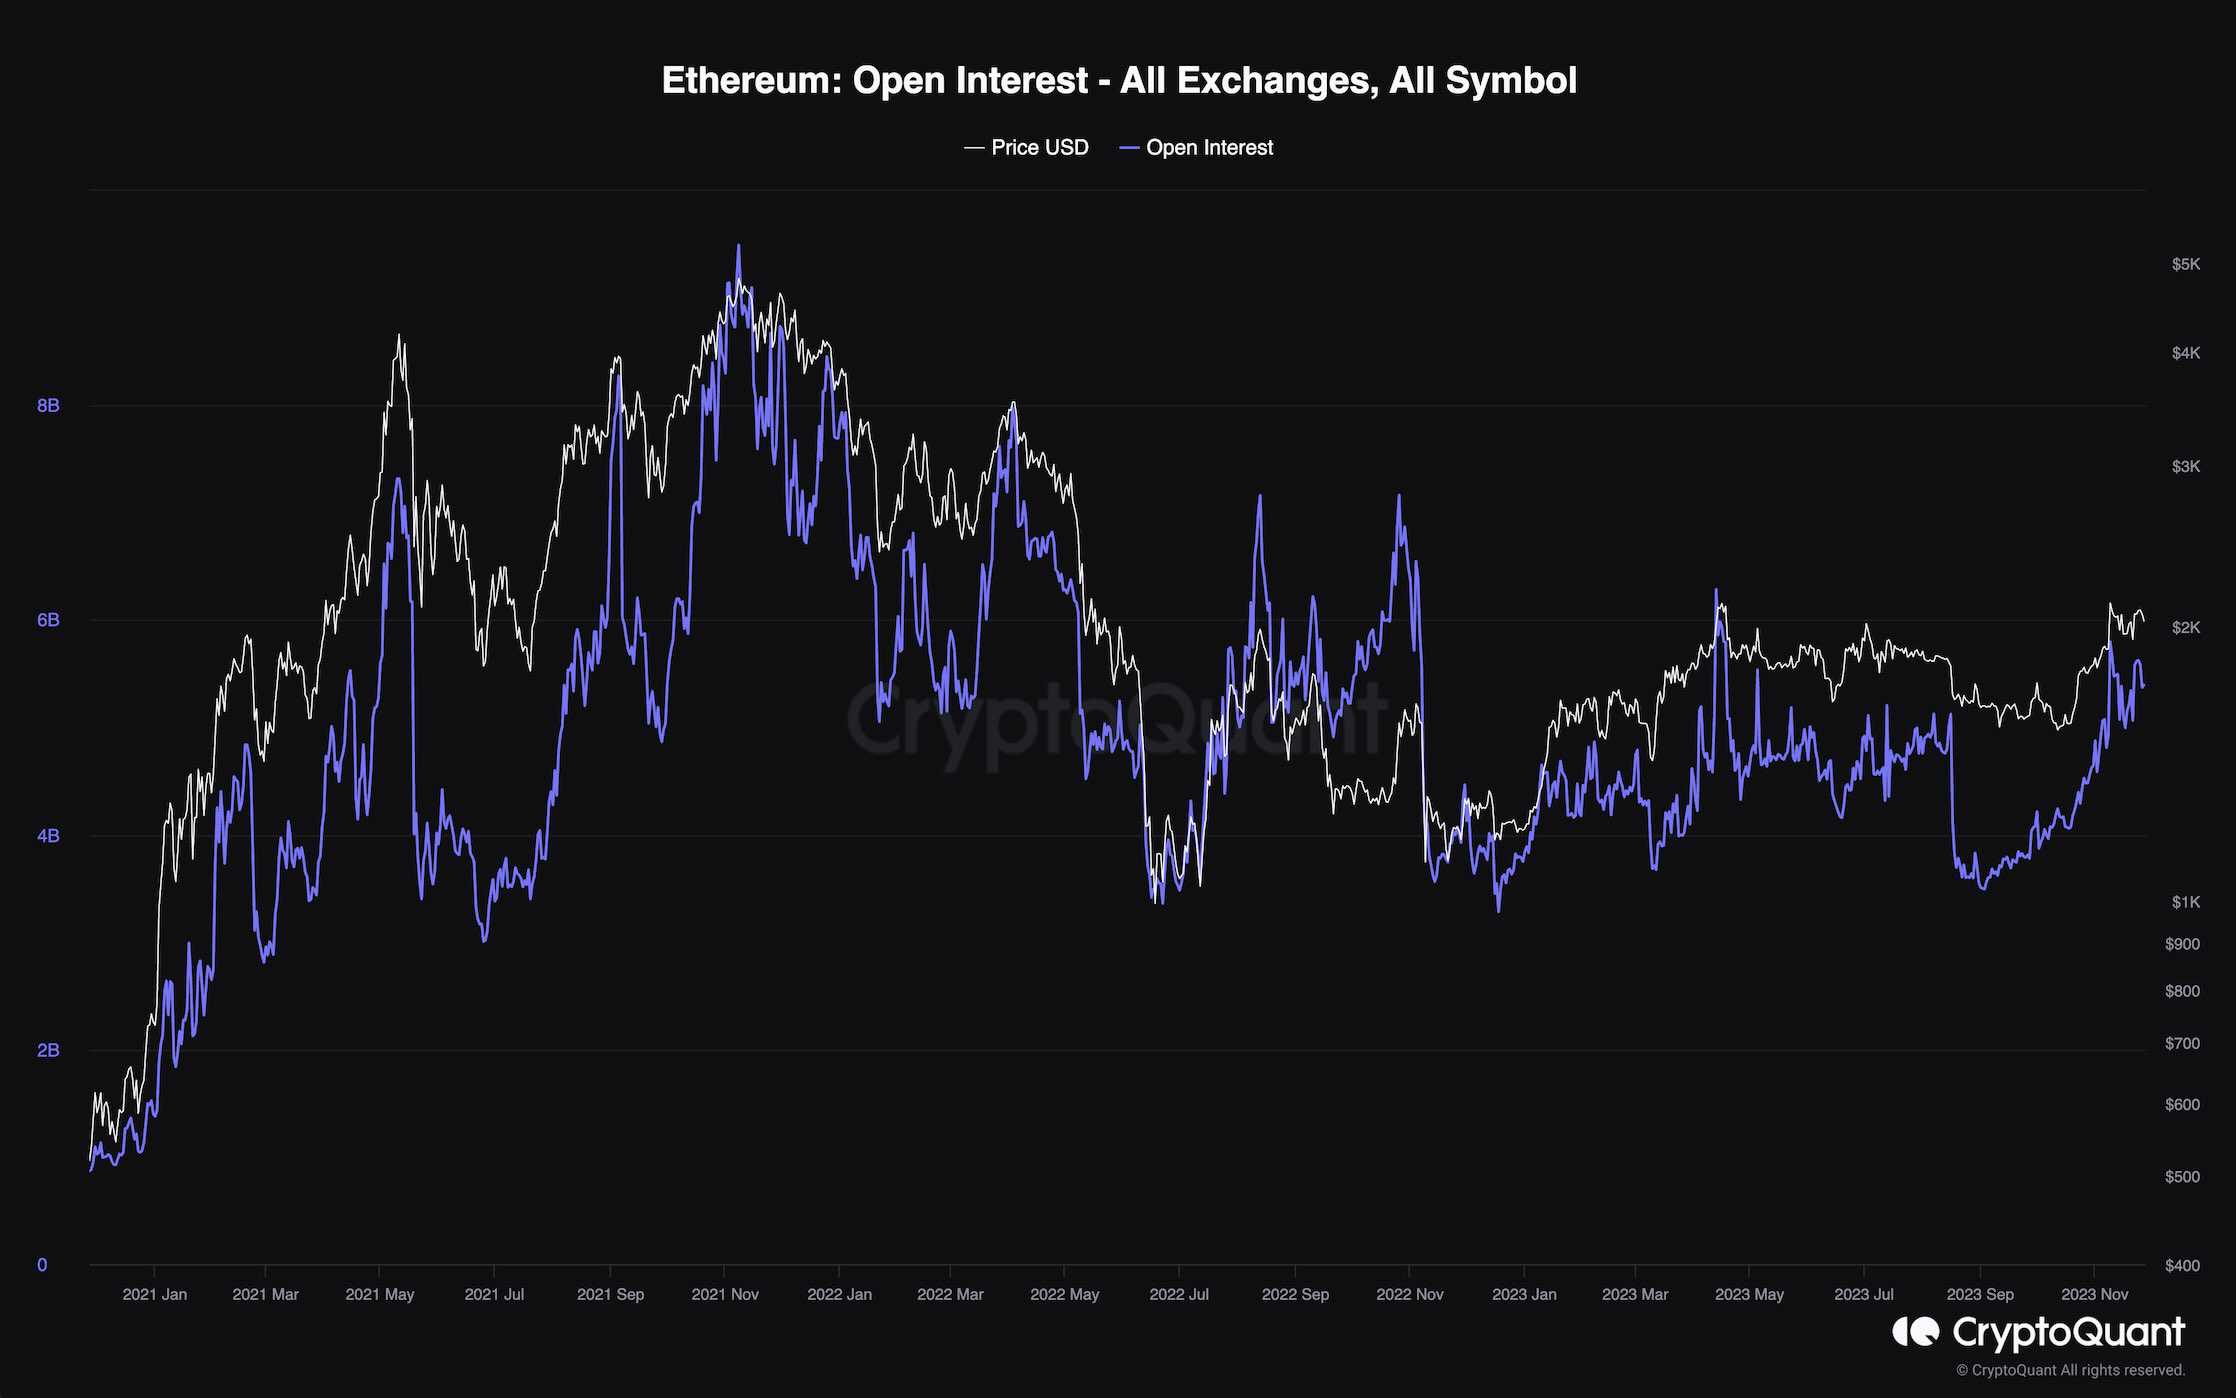
Open Interest
Analyzing the futures market sentiment could provide beneficial insight for the short term.
This chart represents the Ethereum open interest, which measures the number of open perpetual futures contracts on a daily basis. Higher values typically result in high volatility and probable bearish reversals, while lower values indicate a more sustainable trend.
Currently, it is evident that the open interest has been on the rise. But, it has yet to reach the values last seen during the all-time highs range. As a result, while corrections are always possible, the futures market is still far from overheating, and the current bullish trend is likely to continue in the coming weeks.