Ethereum’s price has been recovering from a crucial support zone. However, there exists a notable resistance level that must be surpassed in order for the market to potentially transition into a bullish phase in the long term. Technical Analysis By: Edris The Daily Chart: The daily chart demonstrates a notable rebound around the 00 level, where the 200-day moving average provided significant assistance last week. Subsequently, the price has experienced a rally and successfully surpassed both the 00 resistance level and the 50-day moving average, both of which are expected to function as support going forward. The current focus appears to be on surpassing the psychological resistance level of 00, followed by the important technical area around 00. Source:
Topics:
CryptoVizArt considers the following as important: ETH Analysis, ETHBTC, Ethereum (ETH) Price, ethusd
This could be interesting, too:
Mandy Williams writes Ethereum Derivatives Metrics Signal Modest Downside Tail Risk Ahead: Nansen
Jordan Lyanchev writes Weekly Bitcoin, Ethereum ETF Recap: Light at the End of the Tunnel for BTC
CryptoVizArt writes Will Weak Momentum Drive ETH to .5K? (Ethereum Price Analysis)
Jordan Lyanchev writes Bybit Hack Fallout: Arthur Hayes, Samson Mow Push for Ethereum Rollback
Ethereum’s price has been recovering from a crucial support zone. However, there exists a notable resistance level that must be surpassed in order for the market to potentially transition into a bullish phase in the long term.
Technical Analysis
By: Edris
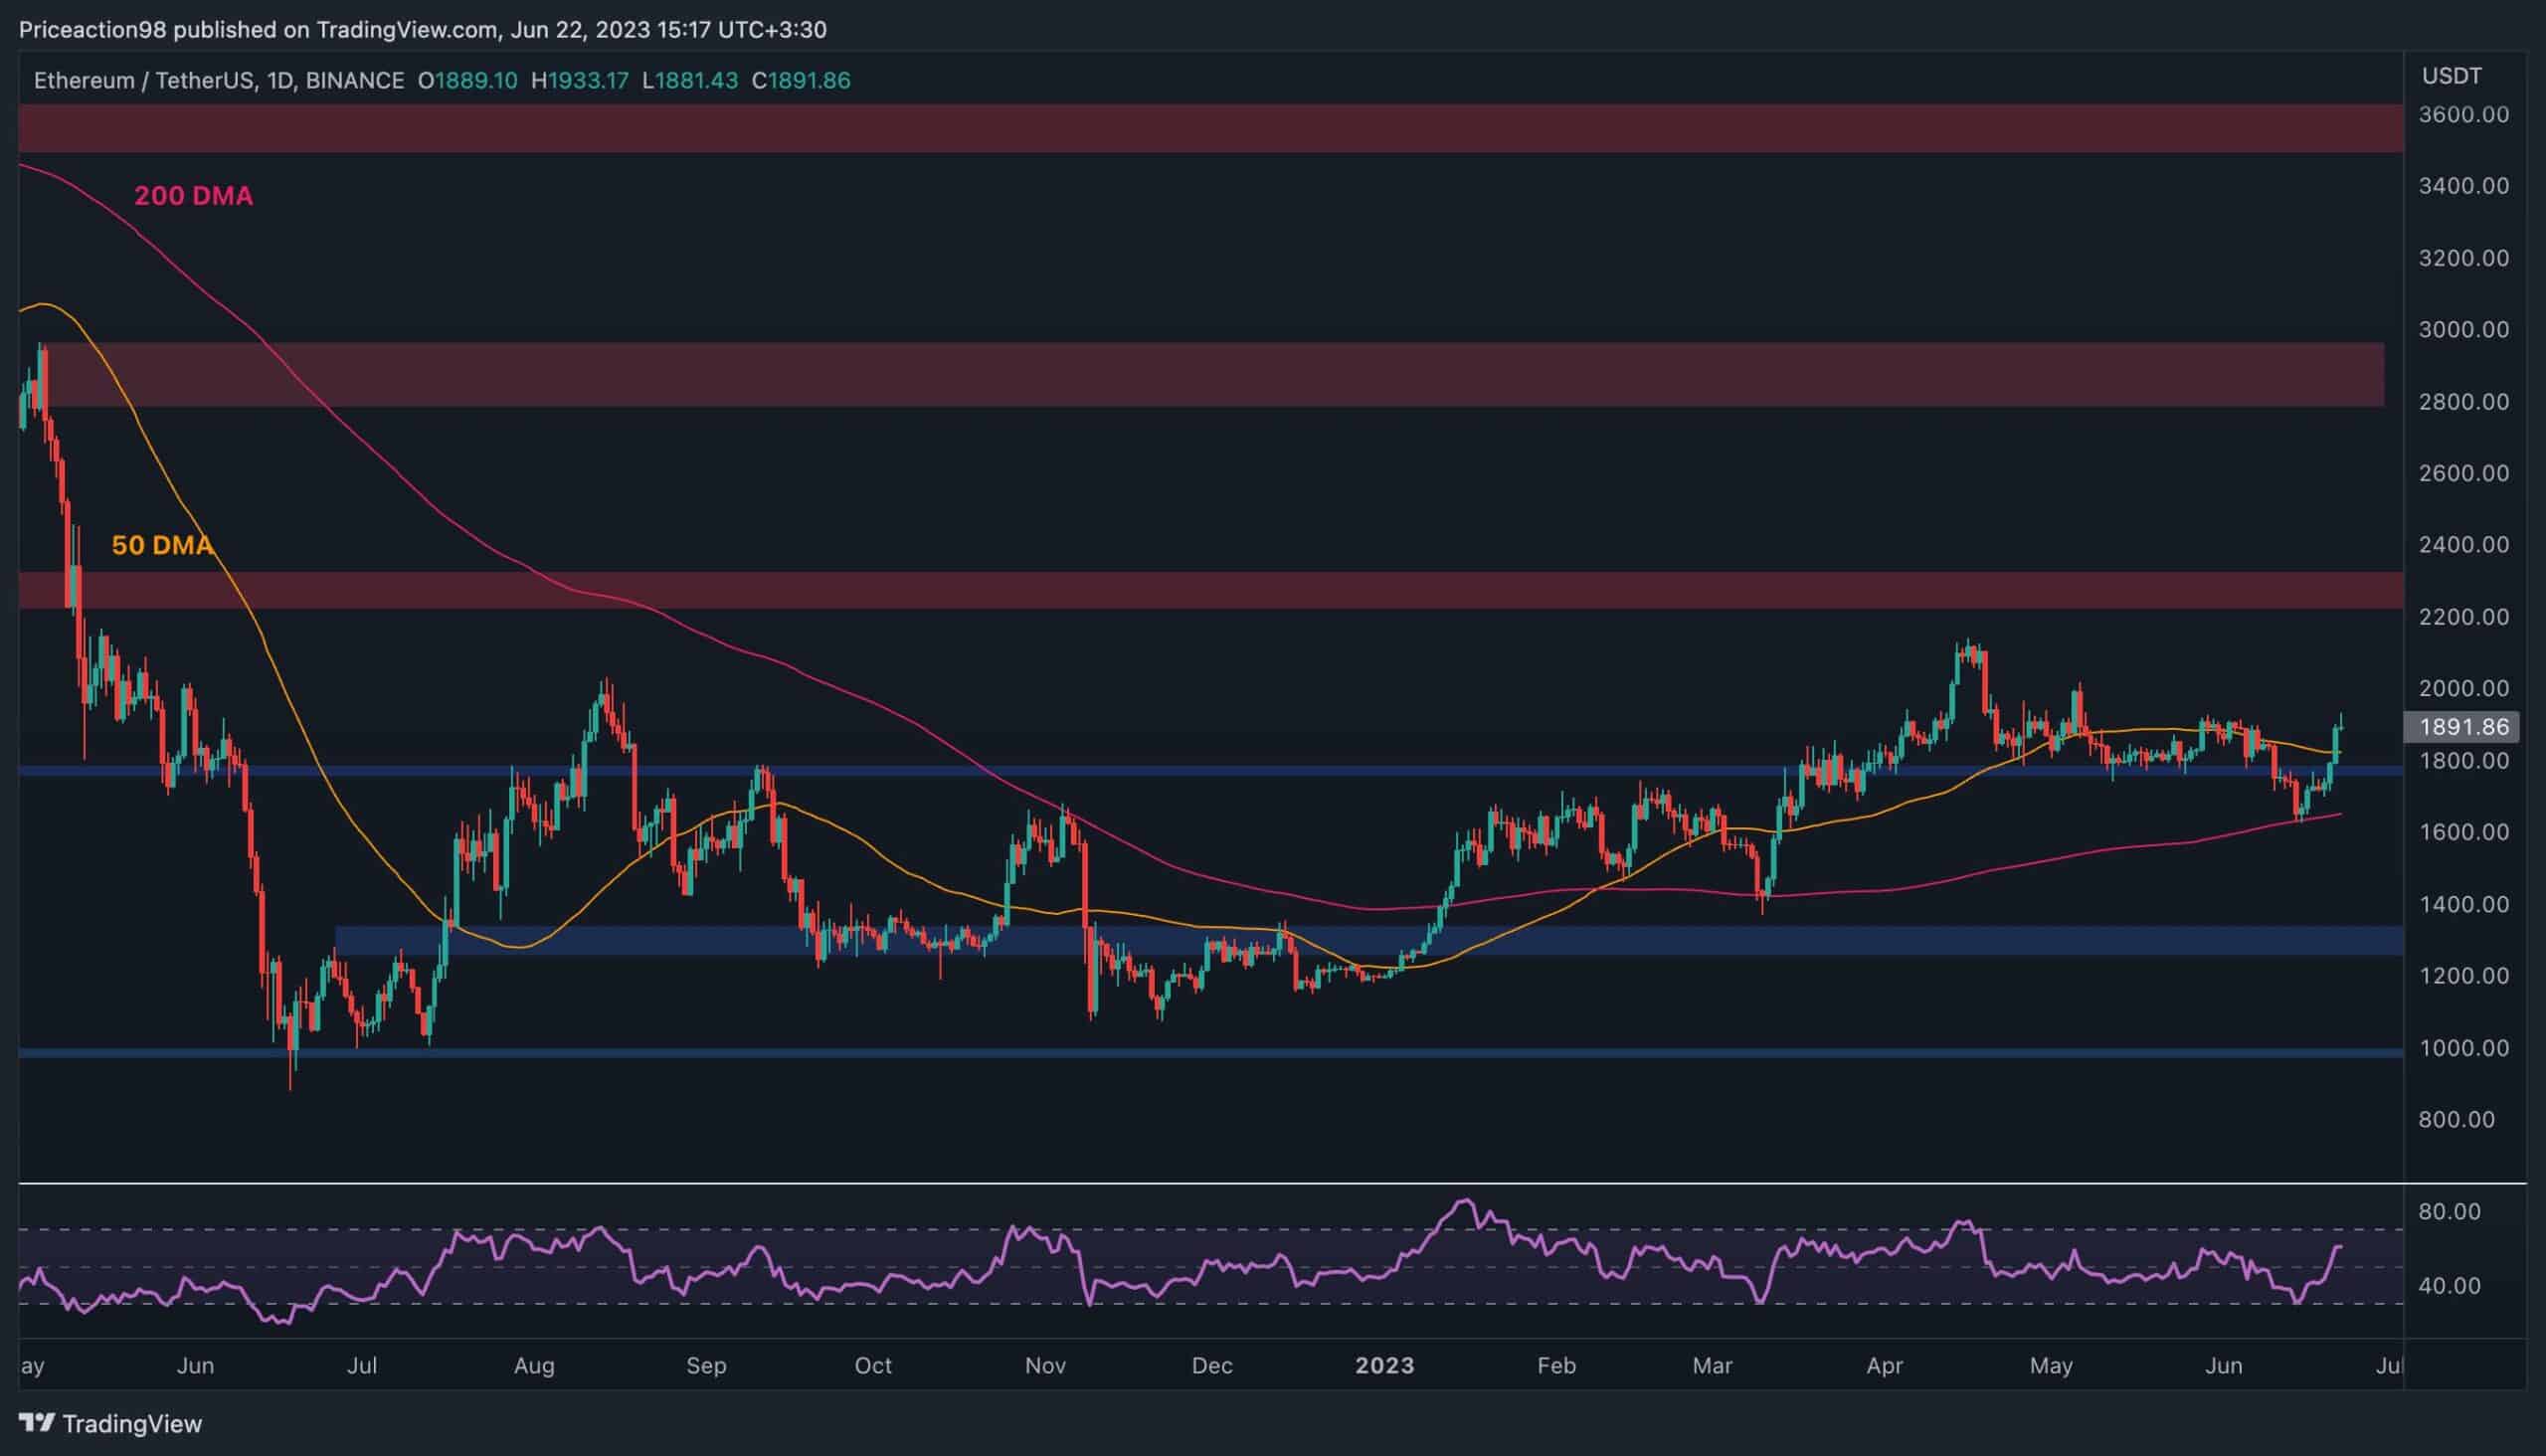
The Daily Chart:
The daily chart demonstrates a notable rebound around the $1600 level, where the 200-day moving average provided significant assistance last week.
Subsequently, the price has experienced a rally and successfully surpassed both the $1800 resistance level and the 50-day moving average, both of which are expected to function as support going forward.
The current focus appears to be on surpassing the psychological resistance level of $2000, followed by the important technical area around $2300.
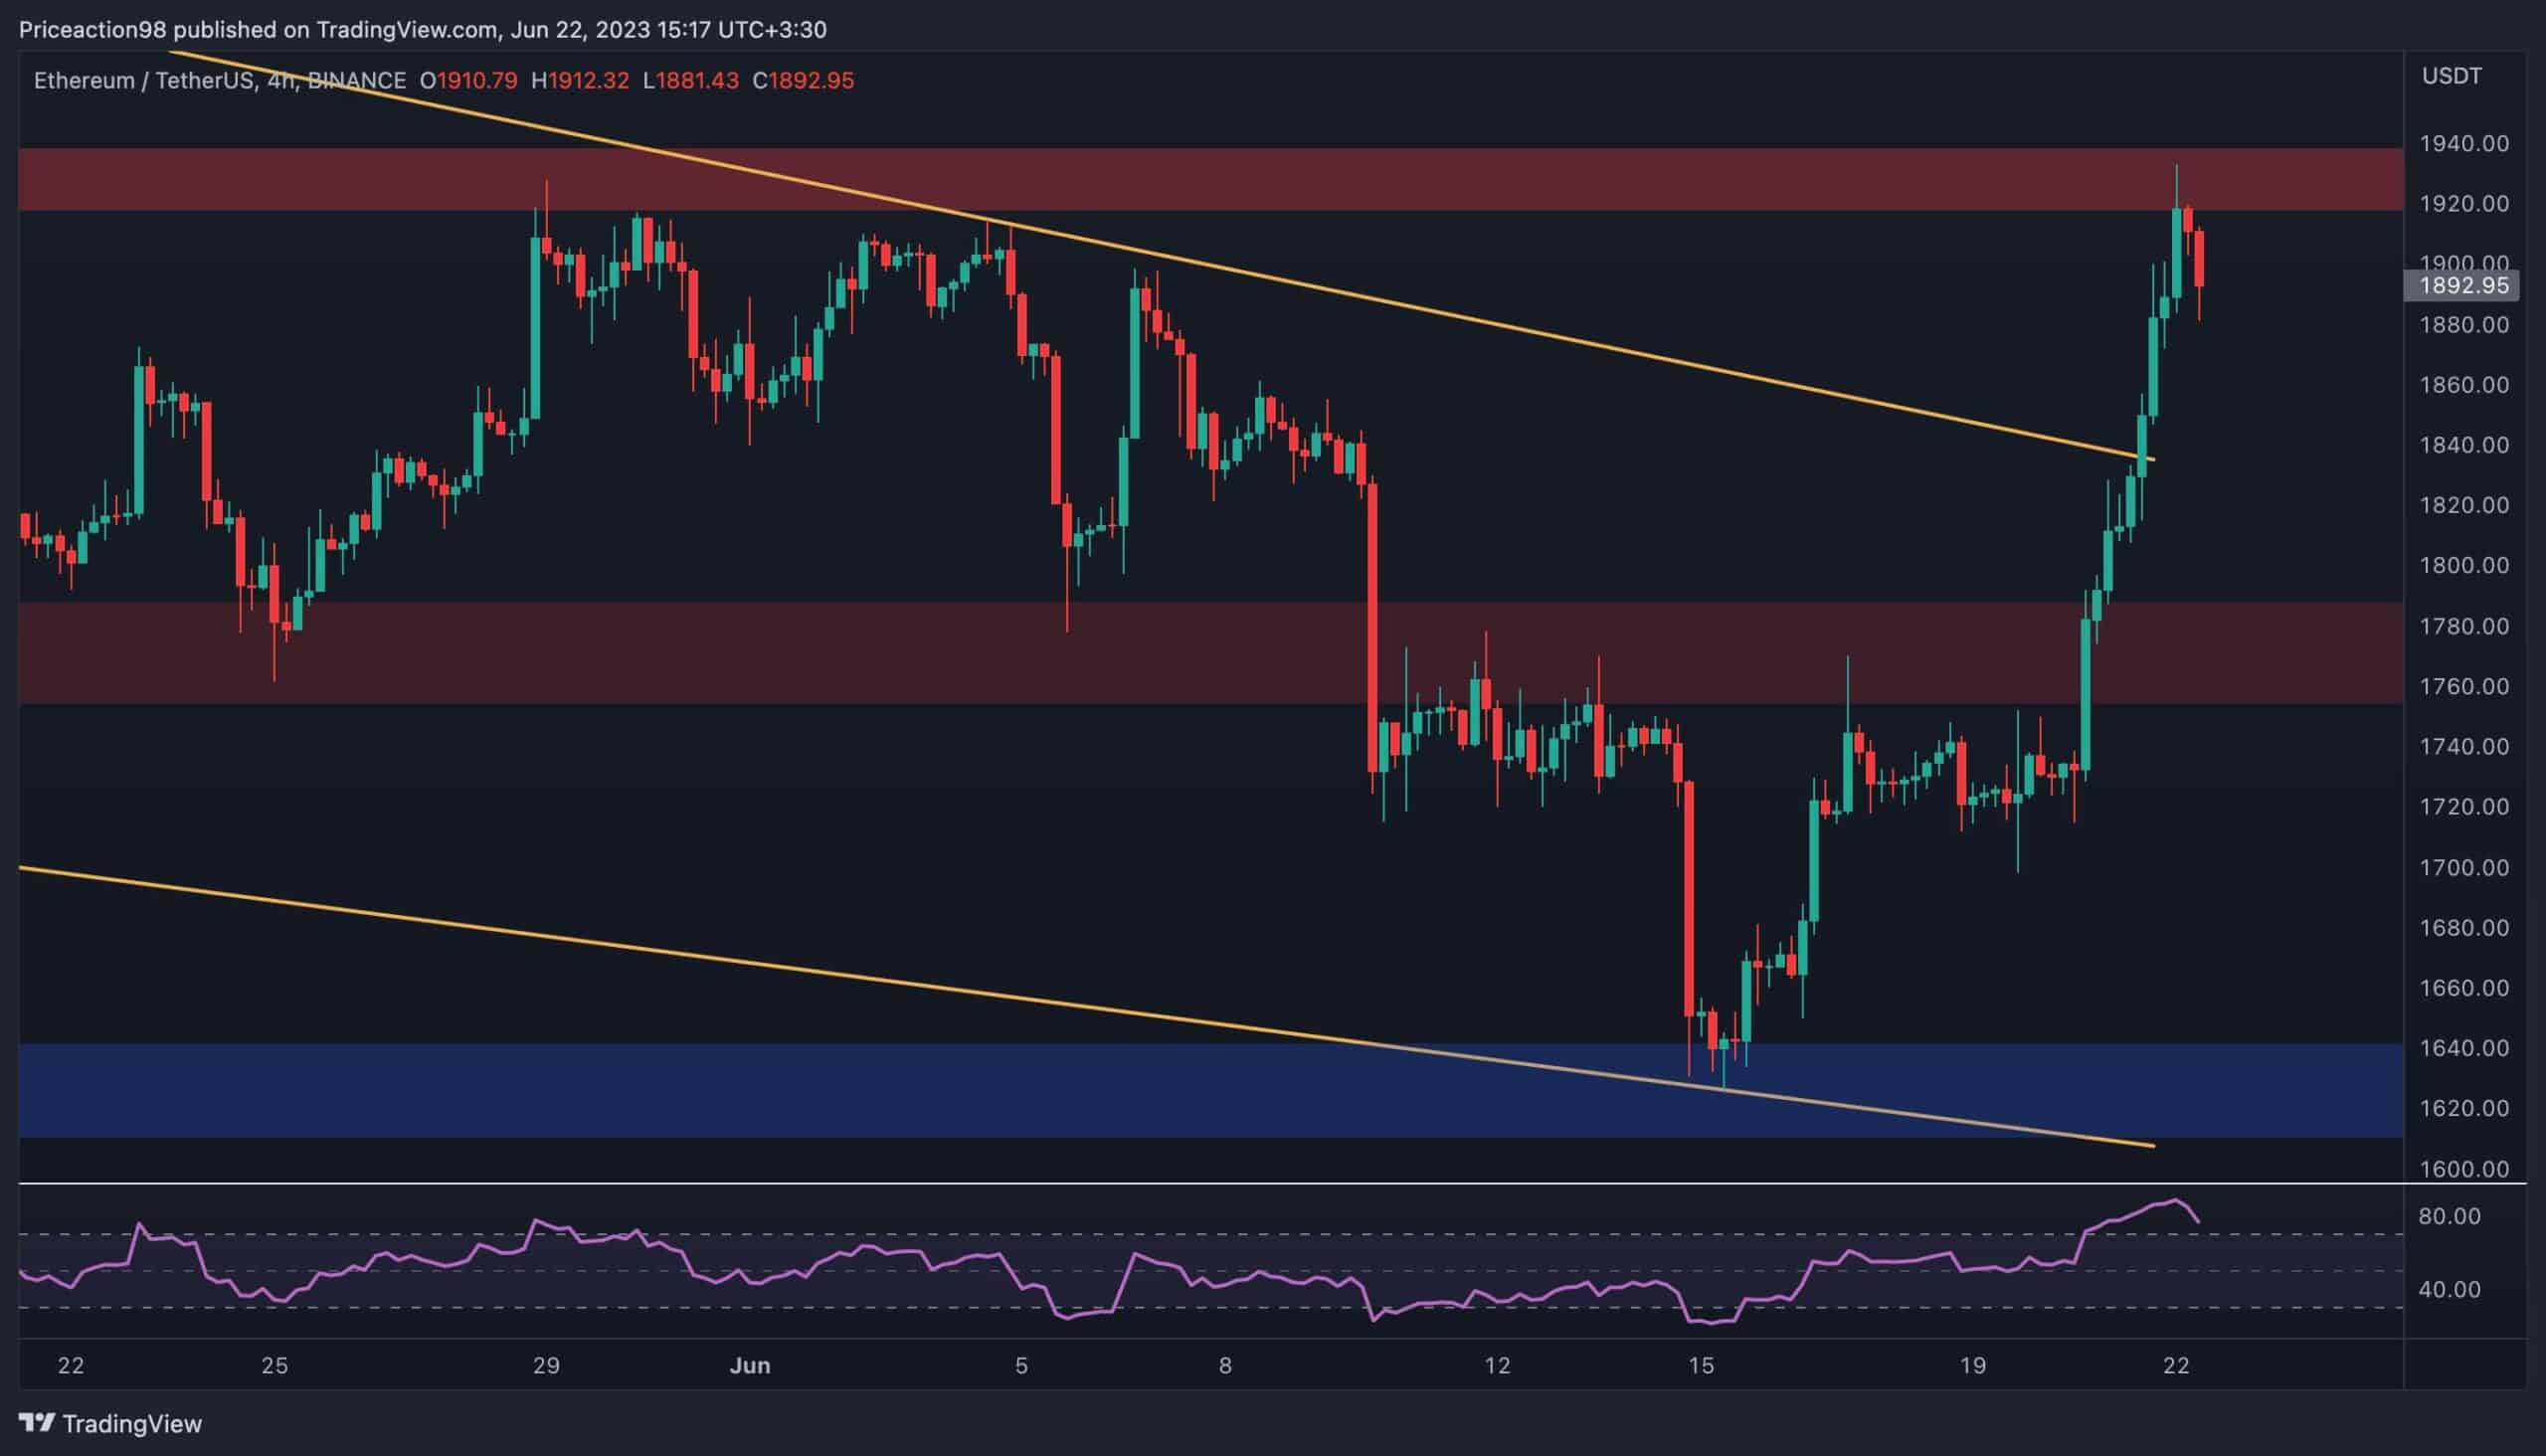
The 4-Hour Chart:
Examining the 4-hour chart, it is evident that the price found support at the lower boundary of a significant falling wedge pattern, aligning with the $1600 support level.
Following this support, Ethereum experienced a rally, successfully surpassing both the $1750 level and the upper boundary of the wedge pattern. A bullish breakout from a falling wedge is generally viewed as a positive signal.
However, the price is currently encountering resistance around the $1900 zone. Additionally, the RSI indicator indicates overbought conditions, suggesting the possibility of a short-term pullback or consolidation.
Sentiment Analysis
By: Edris
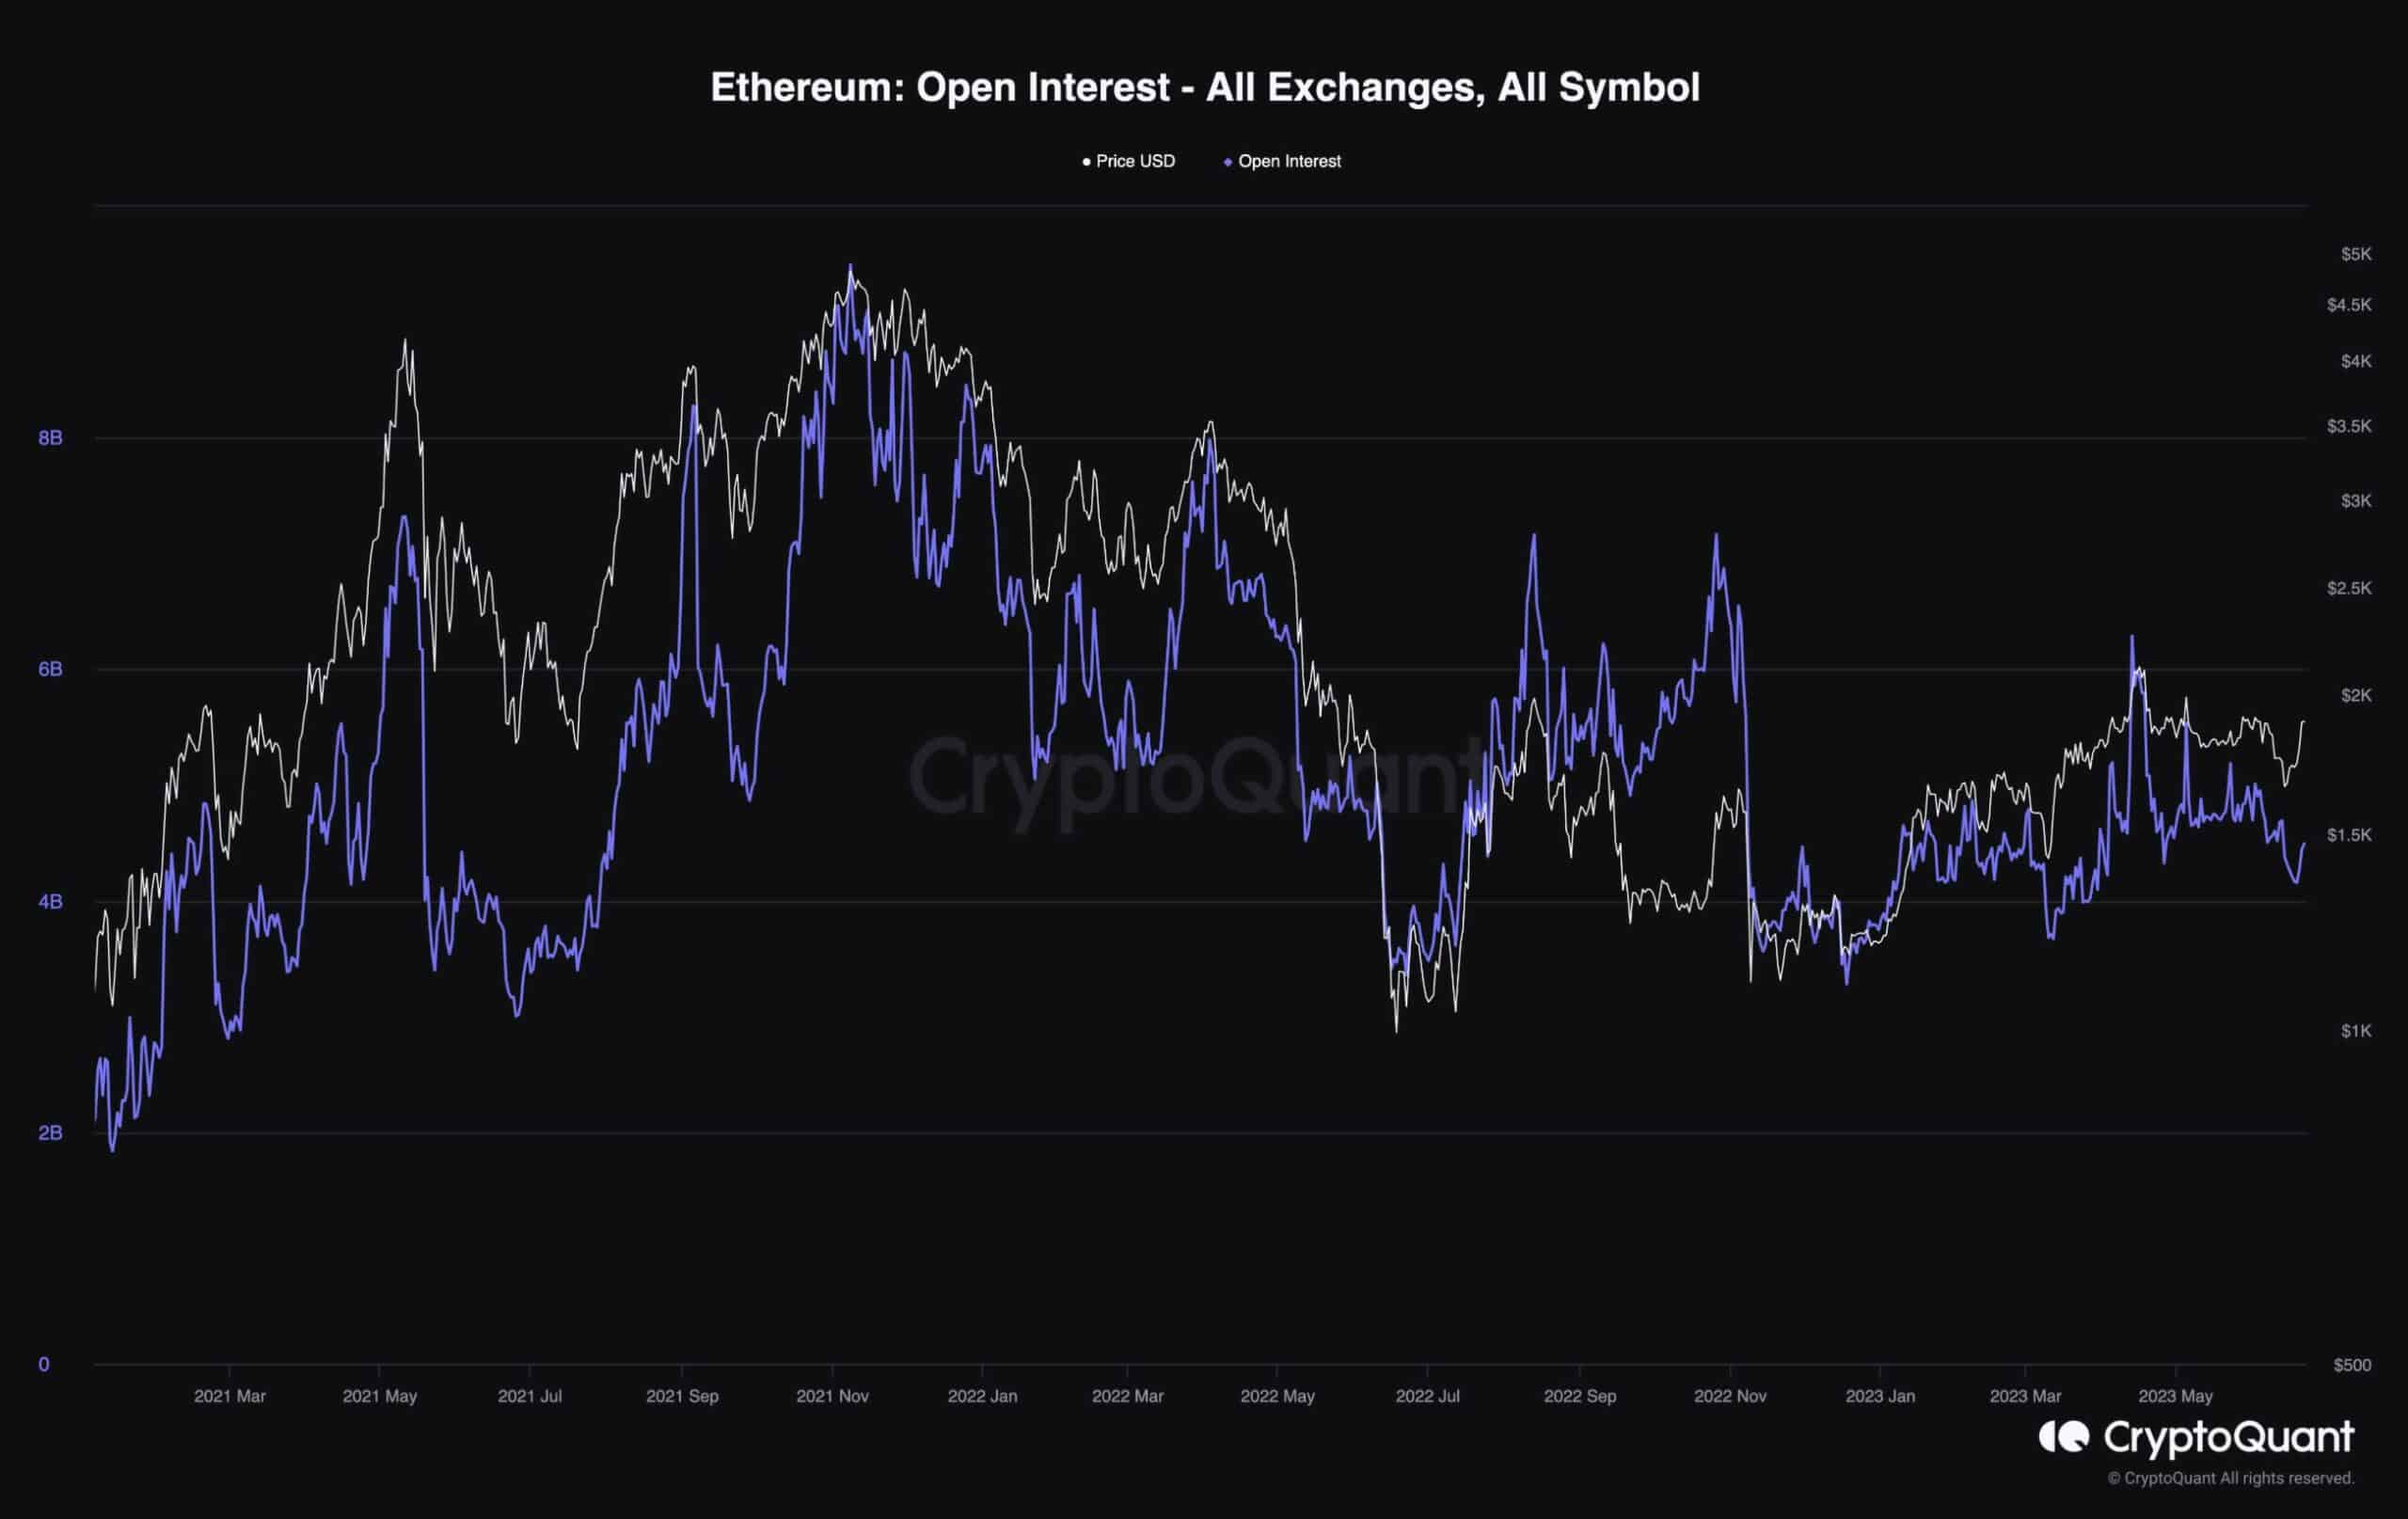
Ethereum Open Interest
Ethereum’s price has recently experienced an uptick after consolidation over the past few months. This upward movement might attract the interest of investors and traders, particularly speculators in the perpetual futures market.
The open interest metric, which indicates the number of open futures positions, currently shows a relatively low value compared to current levels.
This suggests there may be lower volatility in the market until the metric increases. Consequently, it is plausible to expect a continued upward trend in the short term unless unforeseen events disrupt the current scenario.