Ethereum’s price is showing a very bullish signal right now, with a couple of key resistance levels getting broken to the upside. If the breakout is valid, things could look much better for the crypto market in the coming months. Technical Analysis By: Edris The Daily Chart: On the daily chart, the price has been rallying since a sharp rebound from the 200-day moving average around the 00 mark. It has climbed above the 50-day moving average located around the 00 level, before breaking through the higher boundary of the large symmetrical triangle pattern. Currently, the key 00 resistance level is also seemingly getting tested, and the price could soon target values above 00, especially the 00 level, in the coming weeks if the current breakout is valid. On the
Topics:
CryptoVizArt considers the following as important: ETH Analysis, ETHBTC, Ethereum (ETH) Price, ethusd
This could be interesting, too:
Mandy Williams writes Ethereum Derivatives Metrics Signal Modest Downside Tail Risk Ahead: Nansen
Jordan Lyanchev writes Weekly Bitcoin, Ethereum ETF Recap: Light at the End of the Tunnel for BTC
CryptoVizArt writes Will Weak Momentum Drive ETH to .5K? (Ethereum Price Analysis)
Jordan Lyanchev writes Bybit Hack Fallout: Arthur Hayes, Samson Mow Push for Ethereum Rollback
Ethereum’s price is showing a very bullish signal right now, with a couple of key resistance levels getting broken to the upside. If the breakout is valid, things could look much better for the crypto market in the coming months.
Technical Analysis
By: Edris
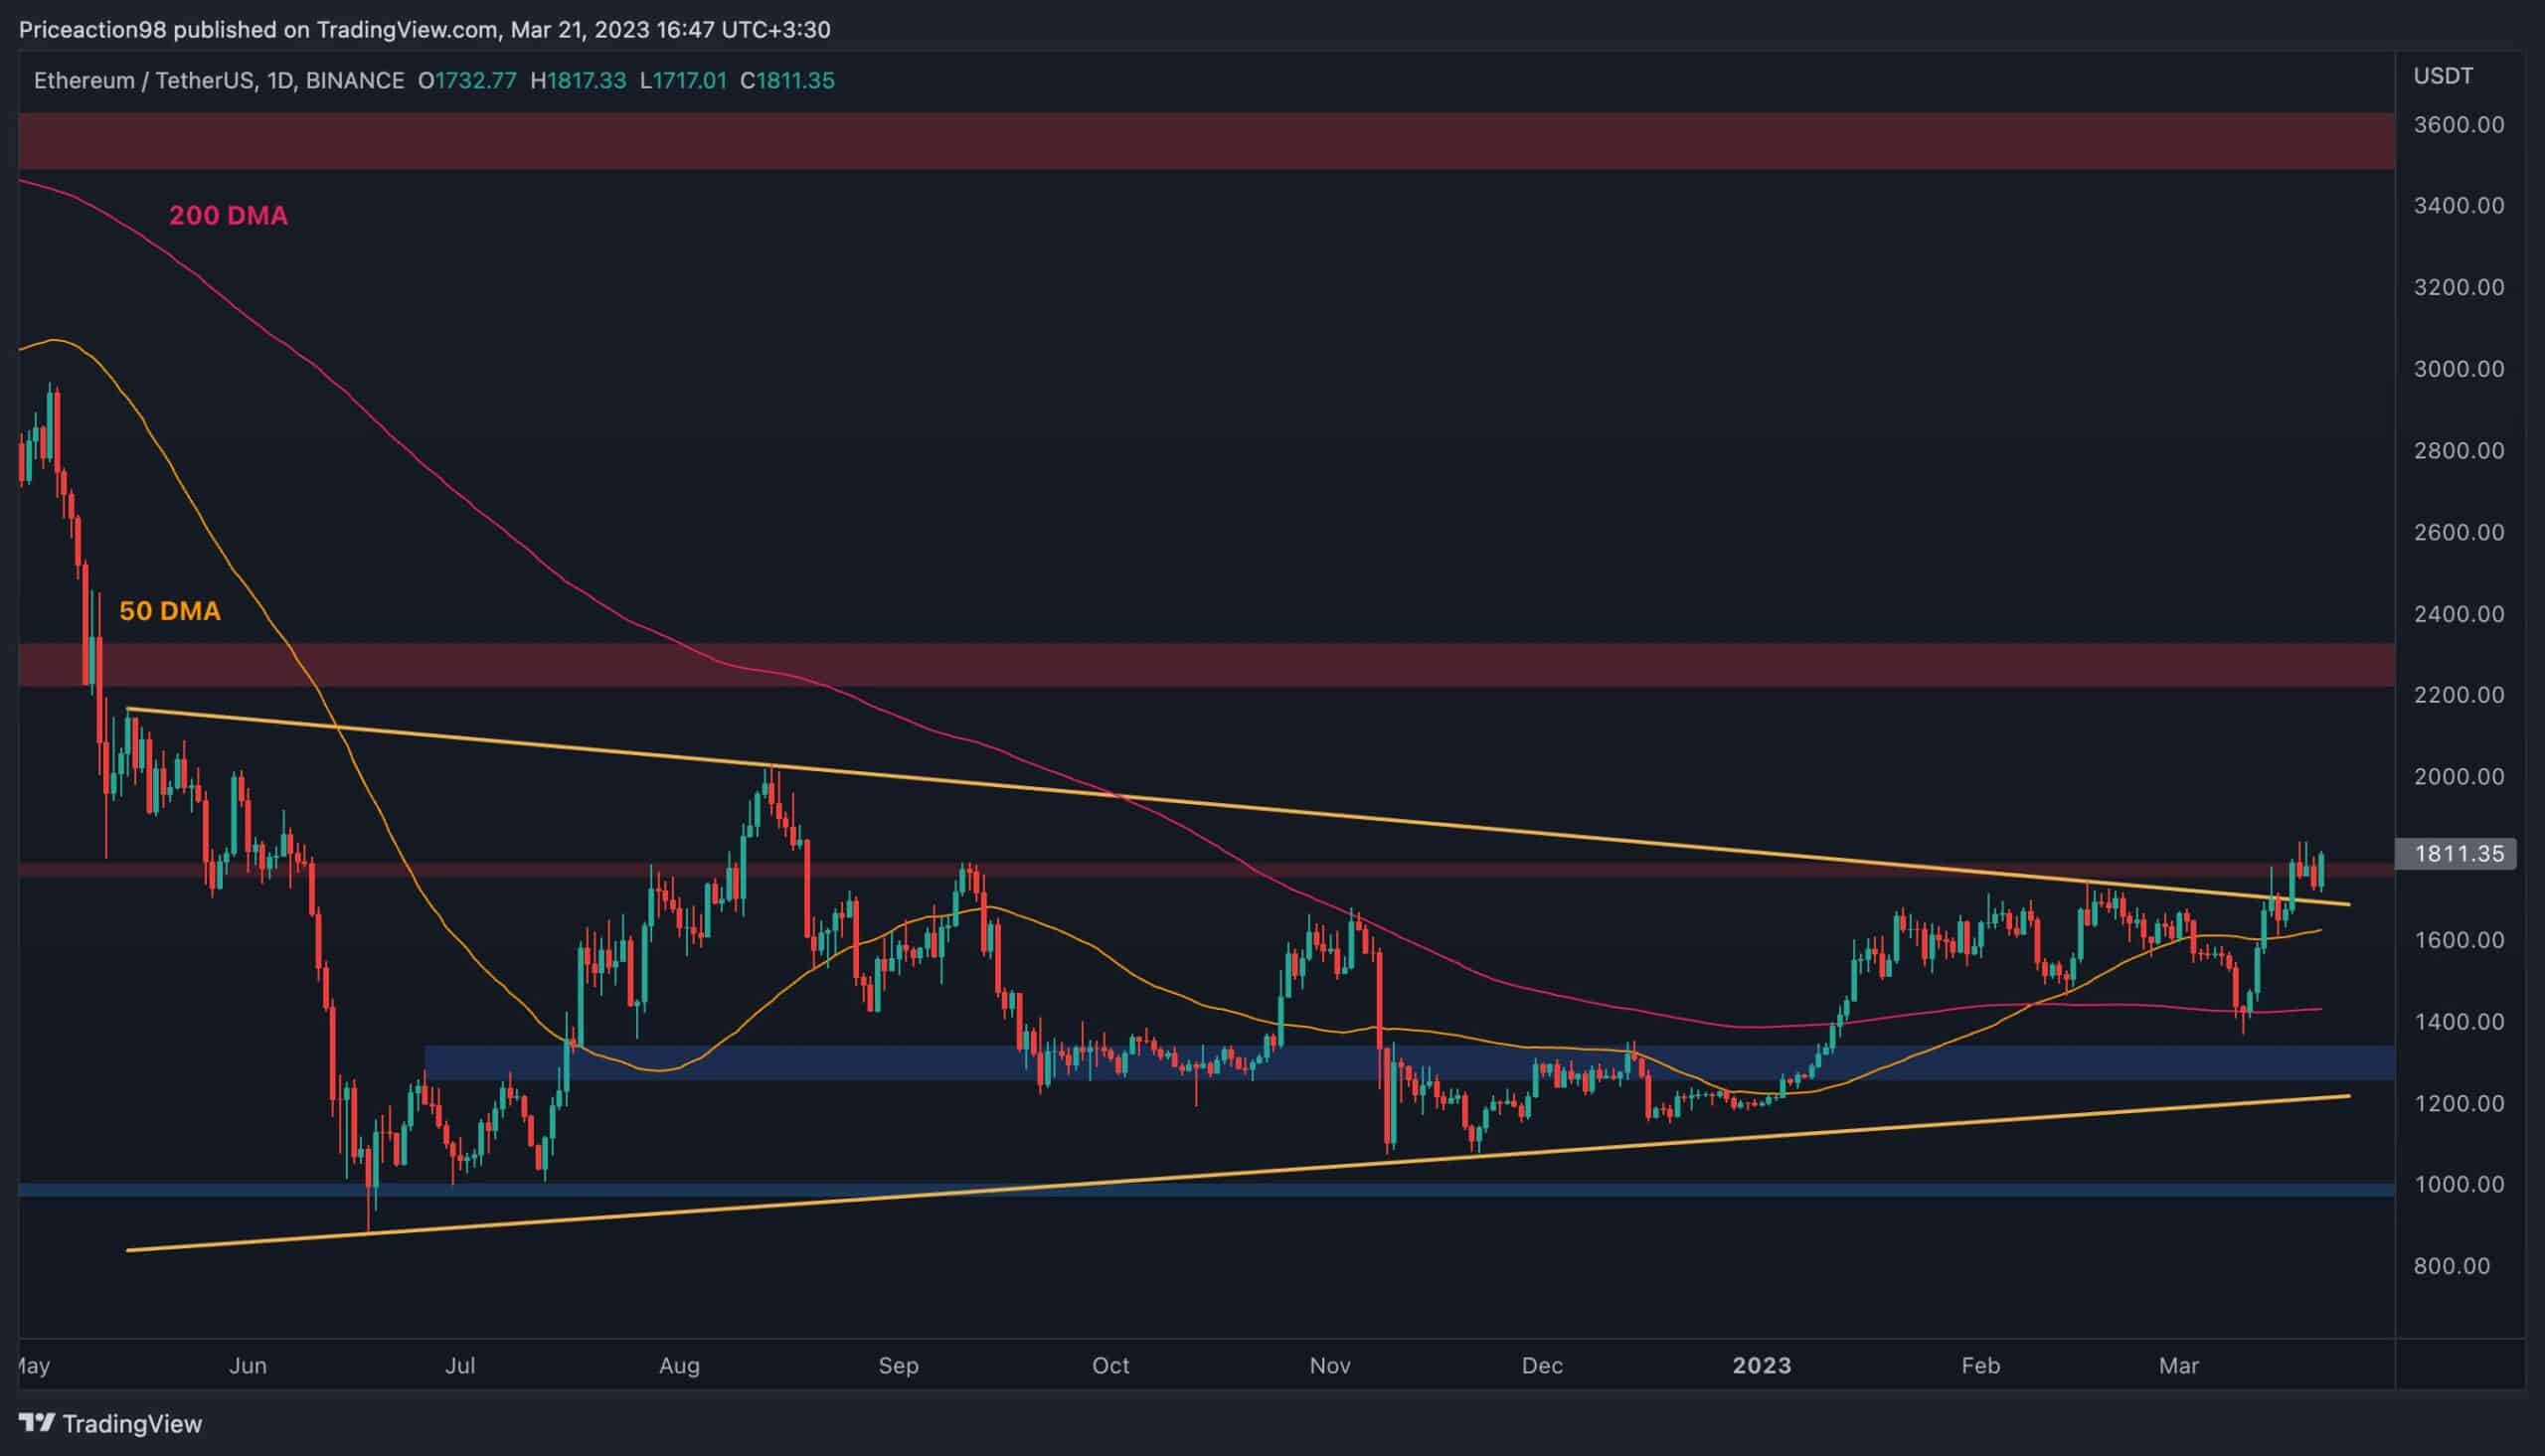
The Daily Chart:
On the daily chart, the price has been rallying since a sharp rebound from the 200-day moving average around the $1400 mark. It has climbed above the 50-day moving average located around the $1600 level, before breaking through the higher boundary of the large symmetrical triangle pattern.
Currently, the key $1800 resistance level is also seemingly getting tested, and the price could soon target values above $2000, especially the $2300 level, in the coming weeks if the current breakout is valid.
On the other hand, in case a fake breakout occurs, a pullback towards either of the 50-day or 200-day moving averages or the $1300 support area could be expected.
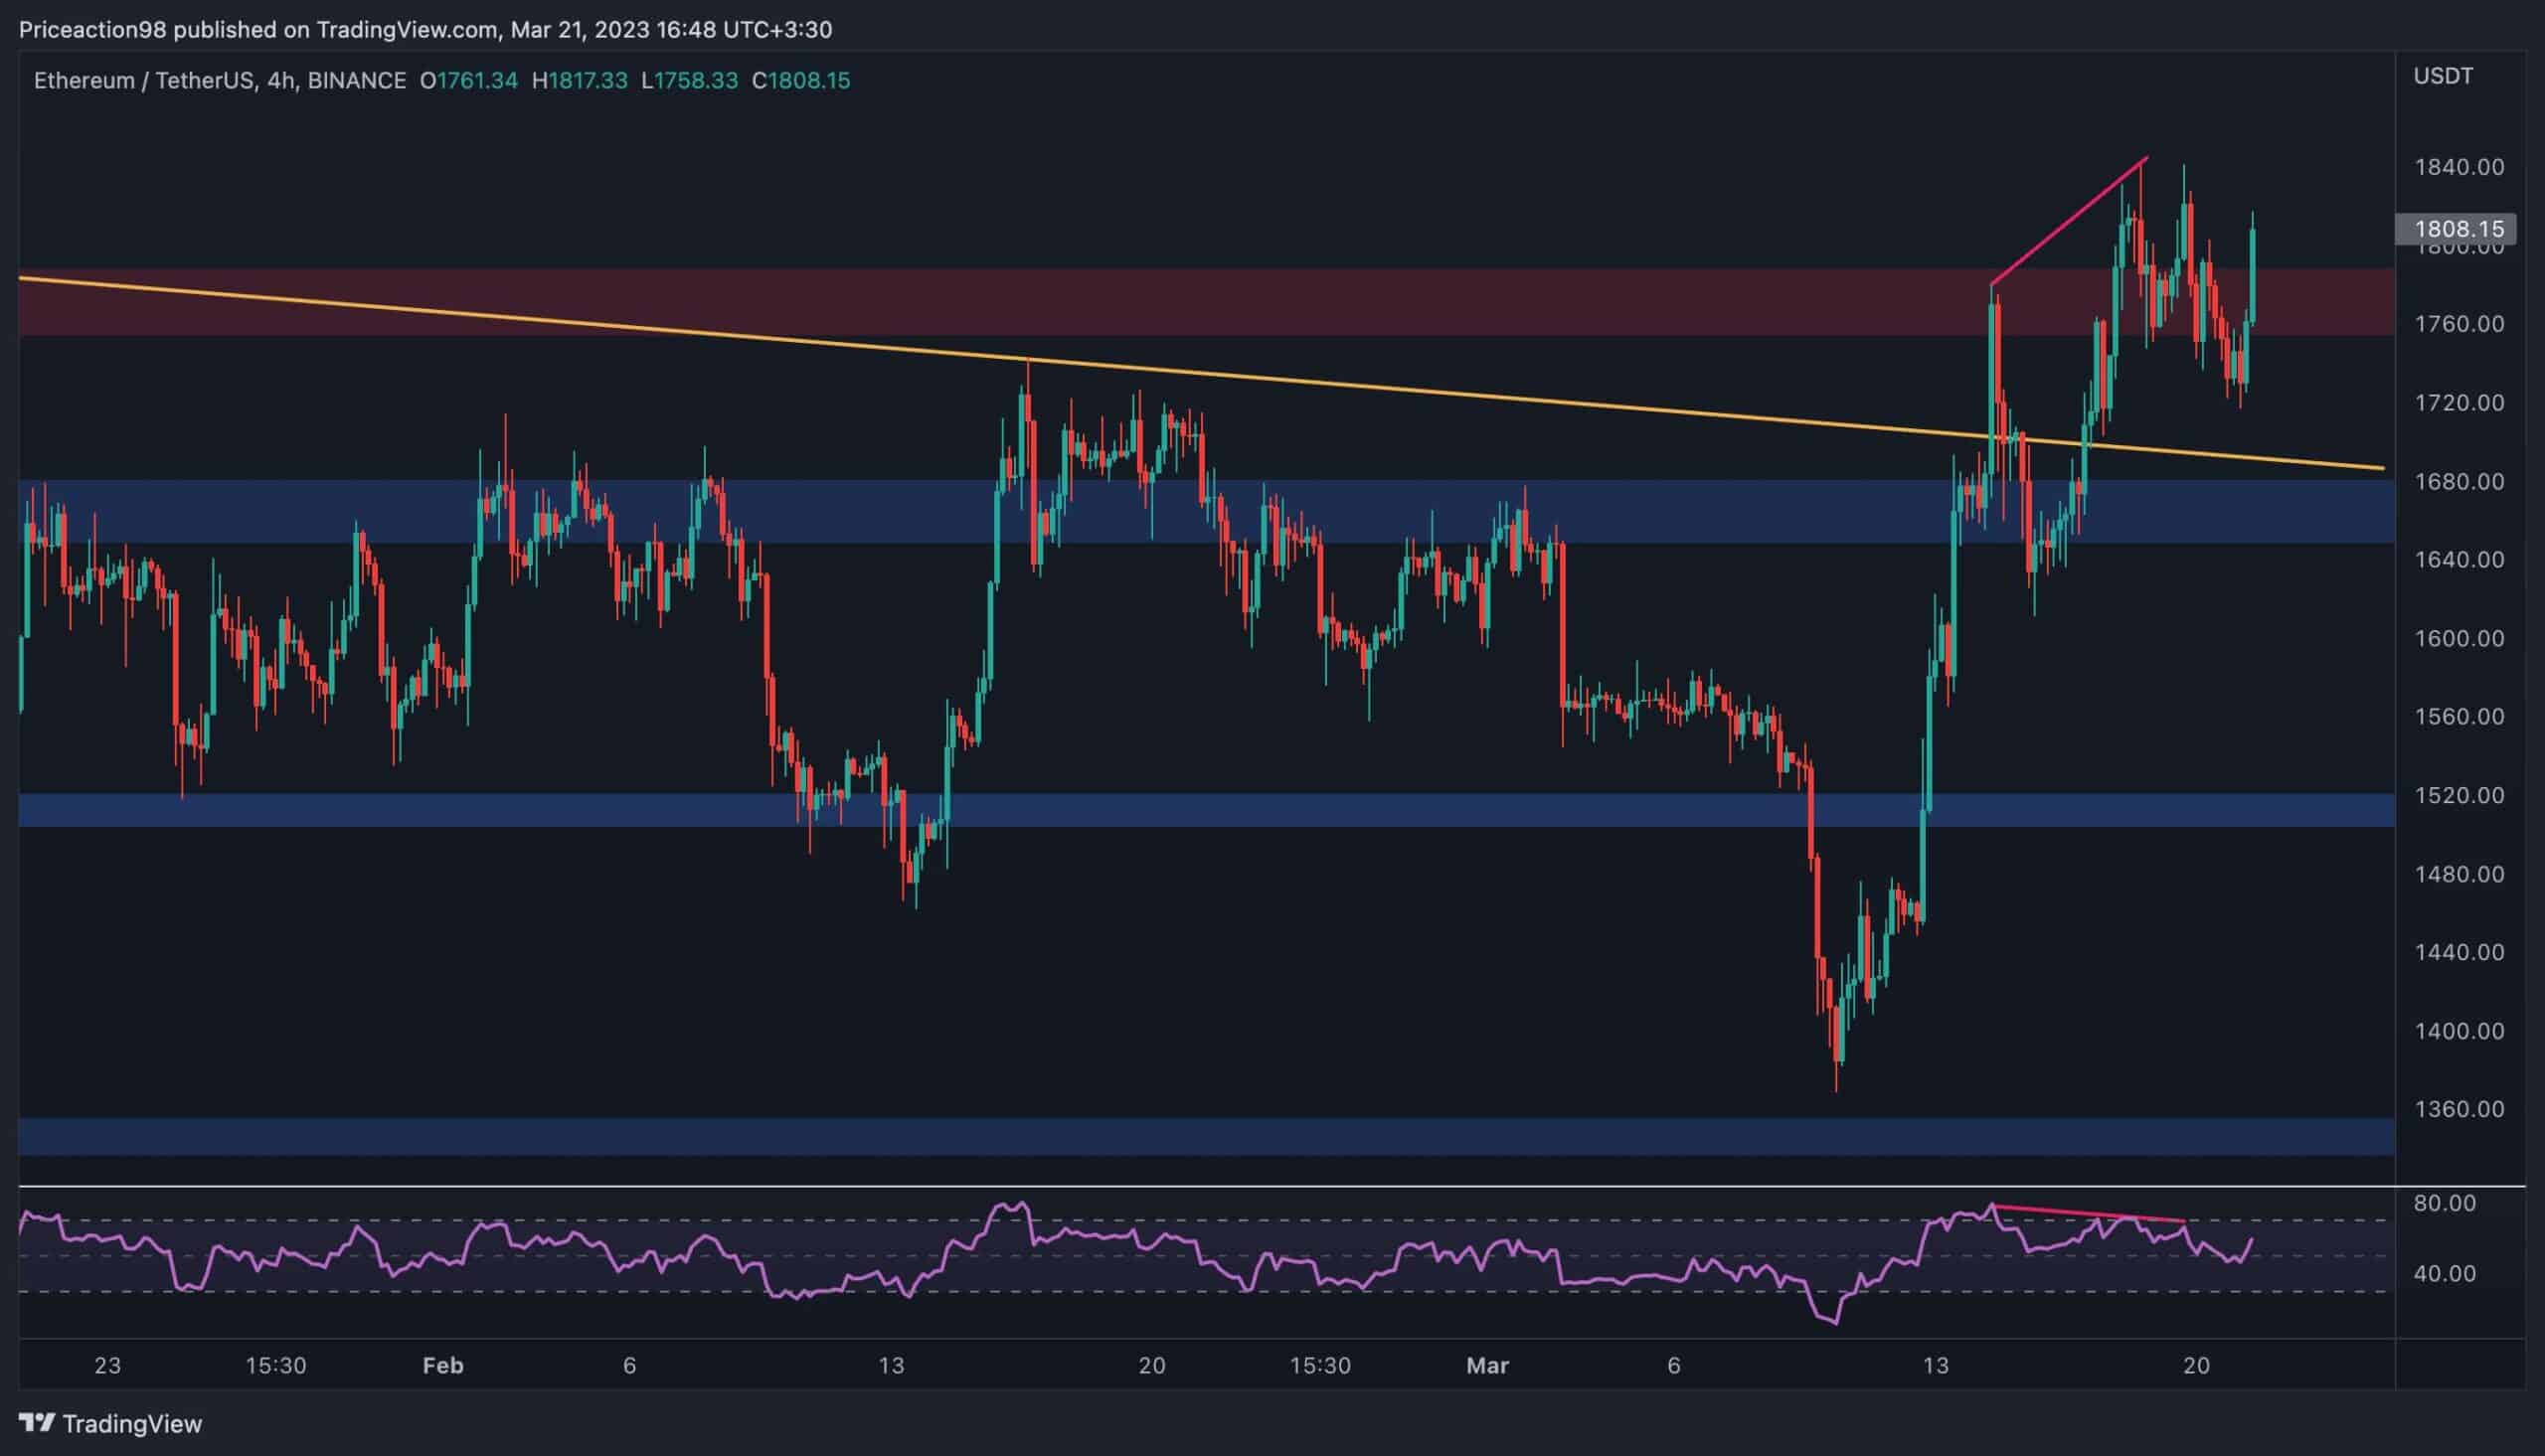
The 4-Hour Chart:
Looking at the 4-hour timeframe, the recent price rally becomes more clear. The cryptocurrency has been struggling with the higher boundary of the symmetrical triangle and the $1800 level over the last few days, with the latter yet to be broken to the upside.
The RSI indicator also demonstrates a bearish divergence between the recent price highs, which could point to a possible correction in the short term. The $1680 and $1500 levels could be possible turning points for the price in case a bearish move materializes.
However, from a price action perspective, ETH is seemingly willing to continue higher, considering the last two 4-hour candles, which are breaking above the $1800 area.
Sentiment Analysis
By: Edris
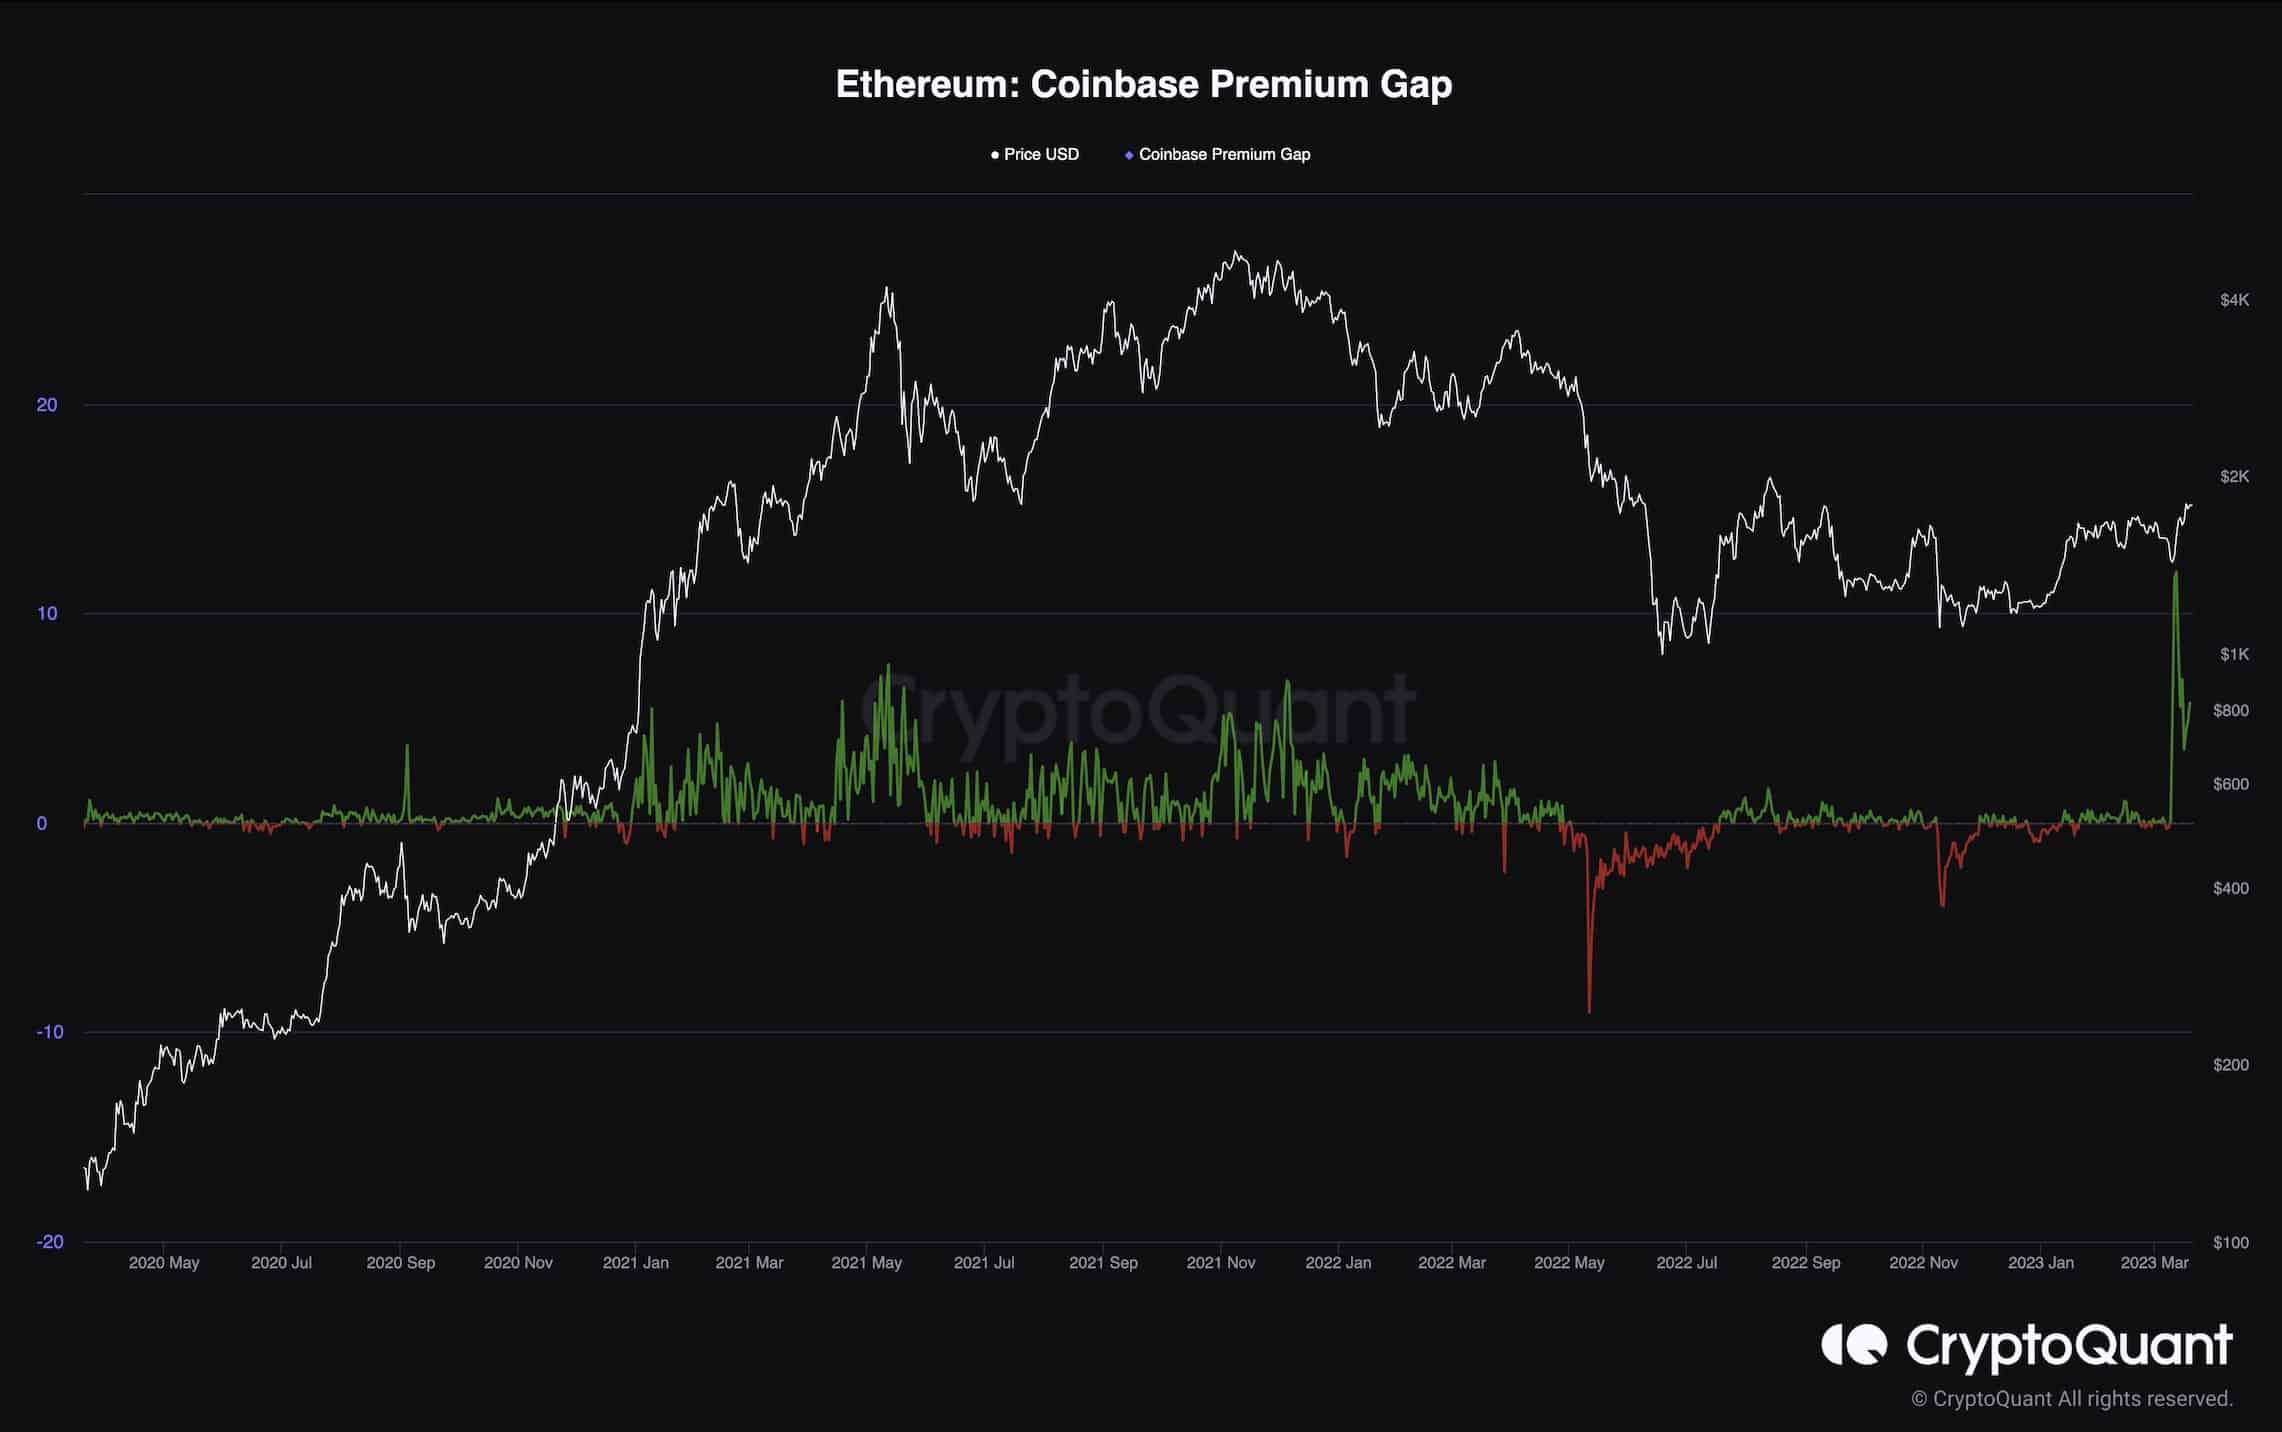
Ethereum Coinbase Premium Gap
With a banking crisis seemingly on the horizon, investors are getting worried about the potential effects on the crypto market.
Interesting signs regarding American investors’ recent behavior have emerged. The Coinbase premium gap chart shows a huge spike that recently occurred, demonstrating the gap between Coinbase’s ETH/USD pair and Binance’s ETH/USDT pair. Positive values indicate higher buying pressure in the U.S., while negative values are associated with selling pressure.
If this behavior continues, the market would likely sustain its uptrend in the mid-term, and a new bull market could begin. However, if the value declines in the coming days and falls below zero, investors should be cautious, as it could be an early sign of a bearish reversal.