Ethereum has recently flashed a bullish signal by finding support at the 100-day moving average of 91 and experienced a spike in its price. Also, it has now encountered a crucial resistance level, and surpassing it would likely trigger another surge. Technical Analysis By Shayan The Daily Chart Ethereum had a period of steady price action around the 100-day moving average of 90 before finding support and proceeding upward. However, during the recent consolidation correction phase since mid-April, the price formed a descending wedge pattern (marked by yellow). Presently, the price has reached the upper boundary of the wedge at .9K due to its recent surge and is on the verge of surpassing this critical level. Ethereum’s price is currently confined within a narrow
Topics:
CryptoVizArt considers the following as important: ETH Analysis, ETHBTC, Ethereum (ETH) Price, ethusd
This could be interesting, too:
Mandy Williams writes BTC at 0K, ETH to K, and More: Here’s VanEck’s Top Crypto Predictions for 2025
Jordan Lyanchev writes Bitcoin, Ethereum ETF Streak Continues With Massive Net Inflows: Weekly Recap
CryptoVizArt writes ETH Seems Primed to Take Down K After Recent Rebound: Ethereum Price Analysis
Dimitar Dzhondzhorov writes Top Ethereum (ETH) Price Predictions: New ATH or Another Severe Correction?
Ethereum has recently flashed a bullish signal by finding support at the 100-day moving average of $1791 and experienced a spike in its price. Also, it has now encountered a crucial resistance level, and surpassing it would likely trigger another surge.
Technical Analysis
By Shayan
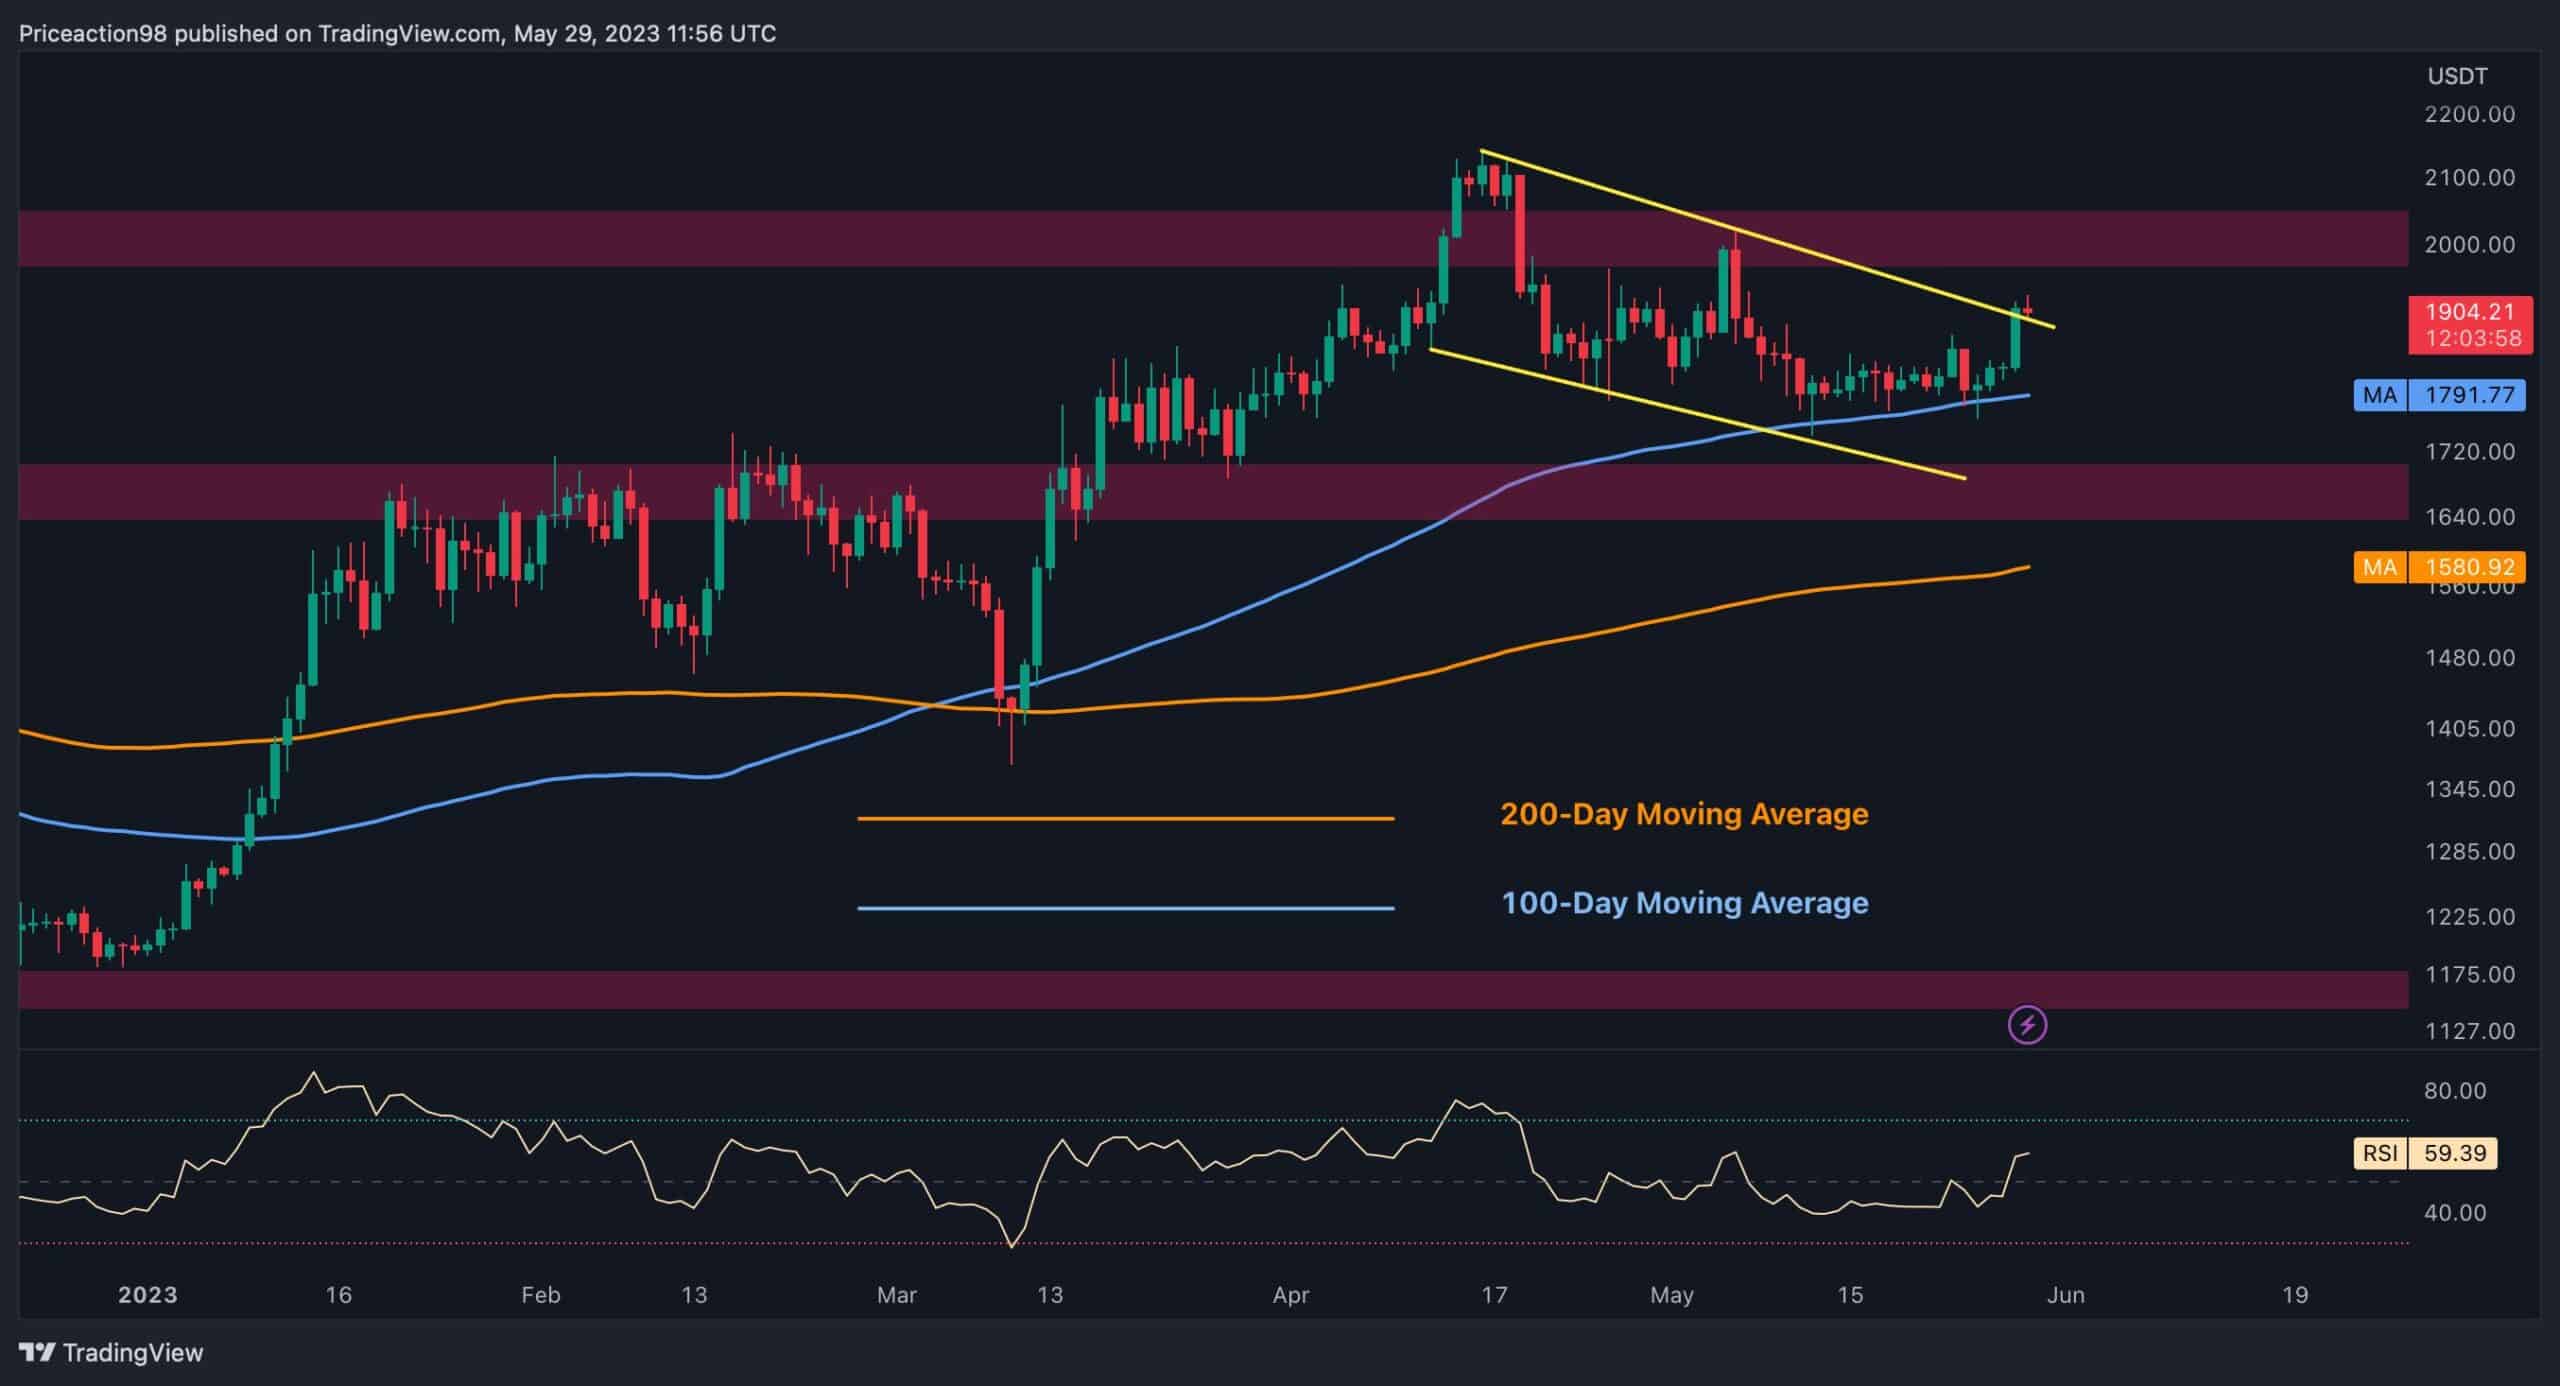
The Daily Chart
Ethereum had a period of steady price action around the 100-day moving average of $1790 before finding support and proceeding upward.
However, during the recent consolidation correction phase since mid-April, the price formed a descending wedge pattern (marked by yellow).
Presently, the price has reached the upper boundary of the wedge at $1.9K due to its recent surge and is on the verge of surpassing this critical level.
Ethereum’s price is currently confined within a narrow range, between approximately $1791 and the static resistance zone of $2K. A breakout from the wedge is likely to trigger another rally toward the $2K resistance zone.
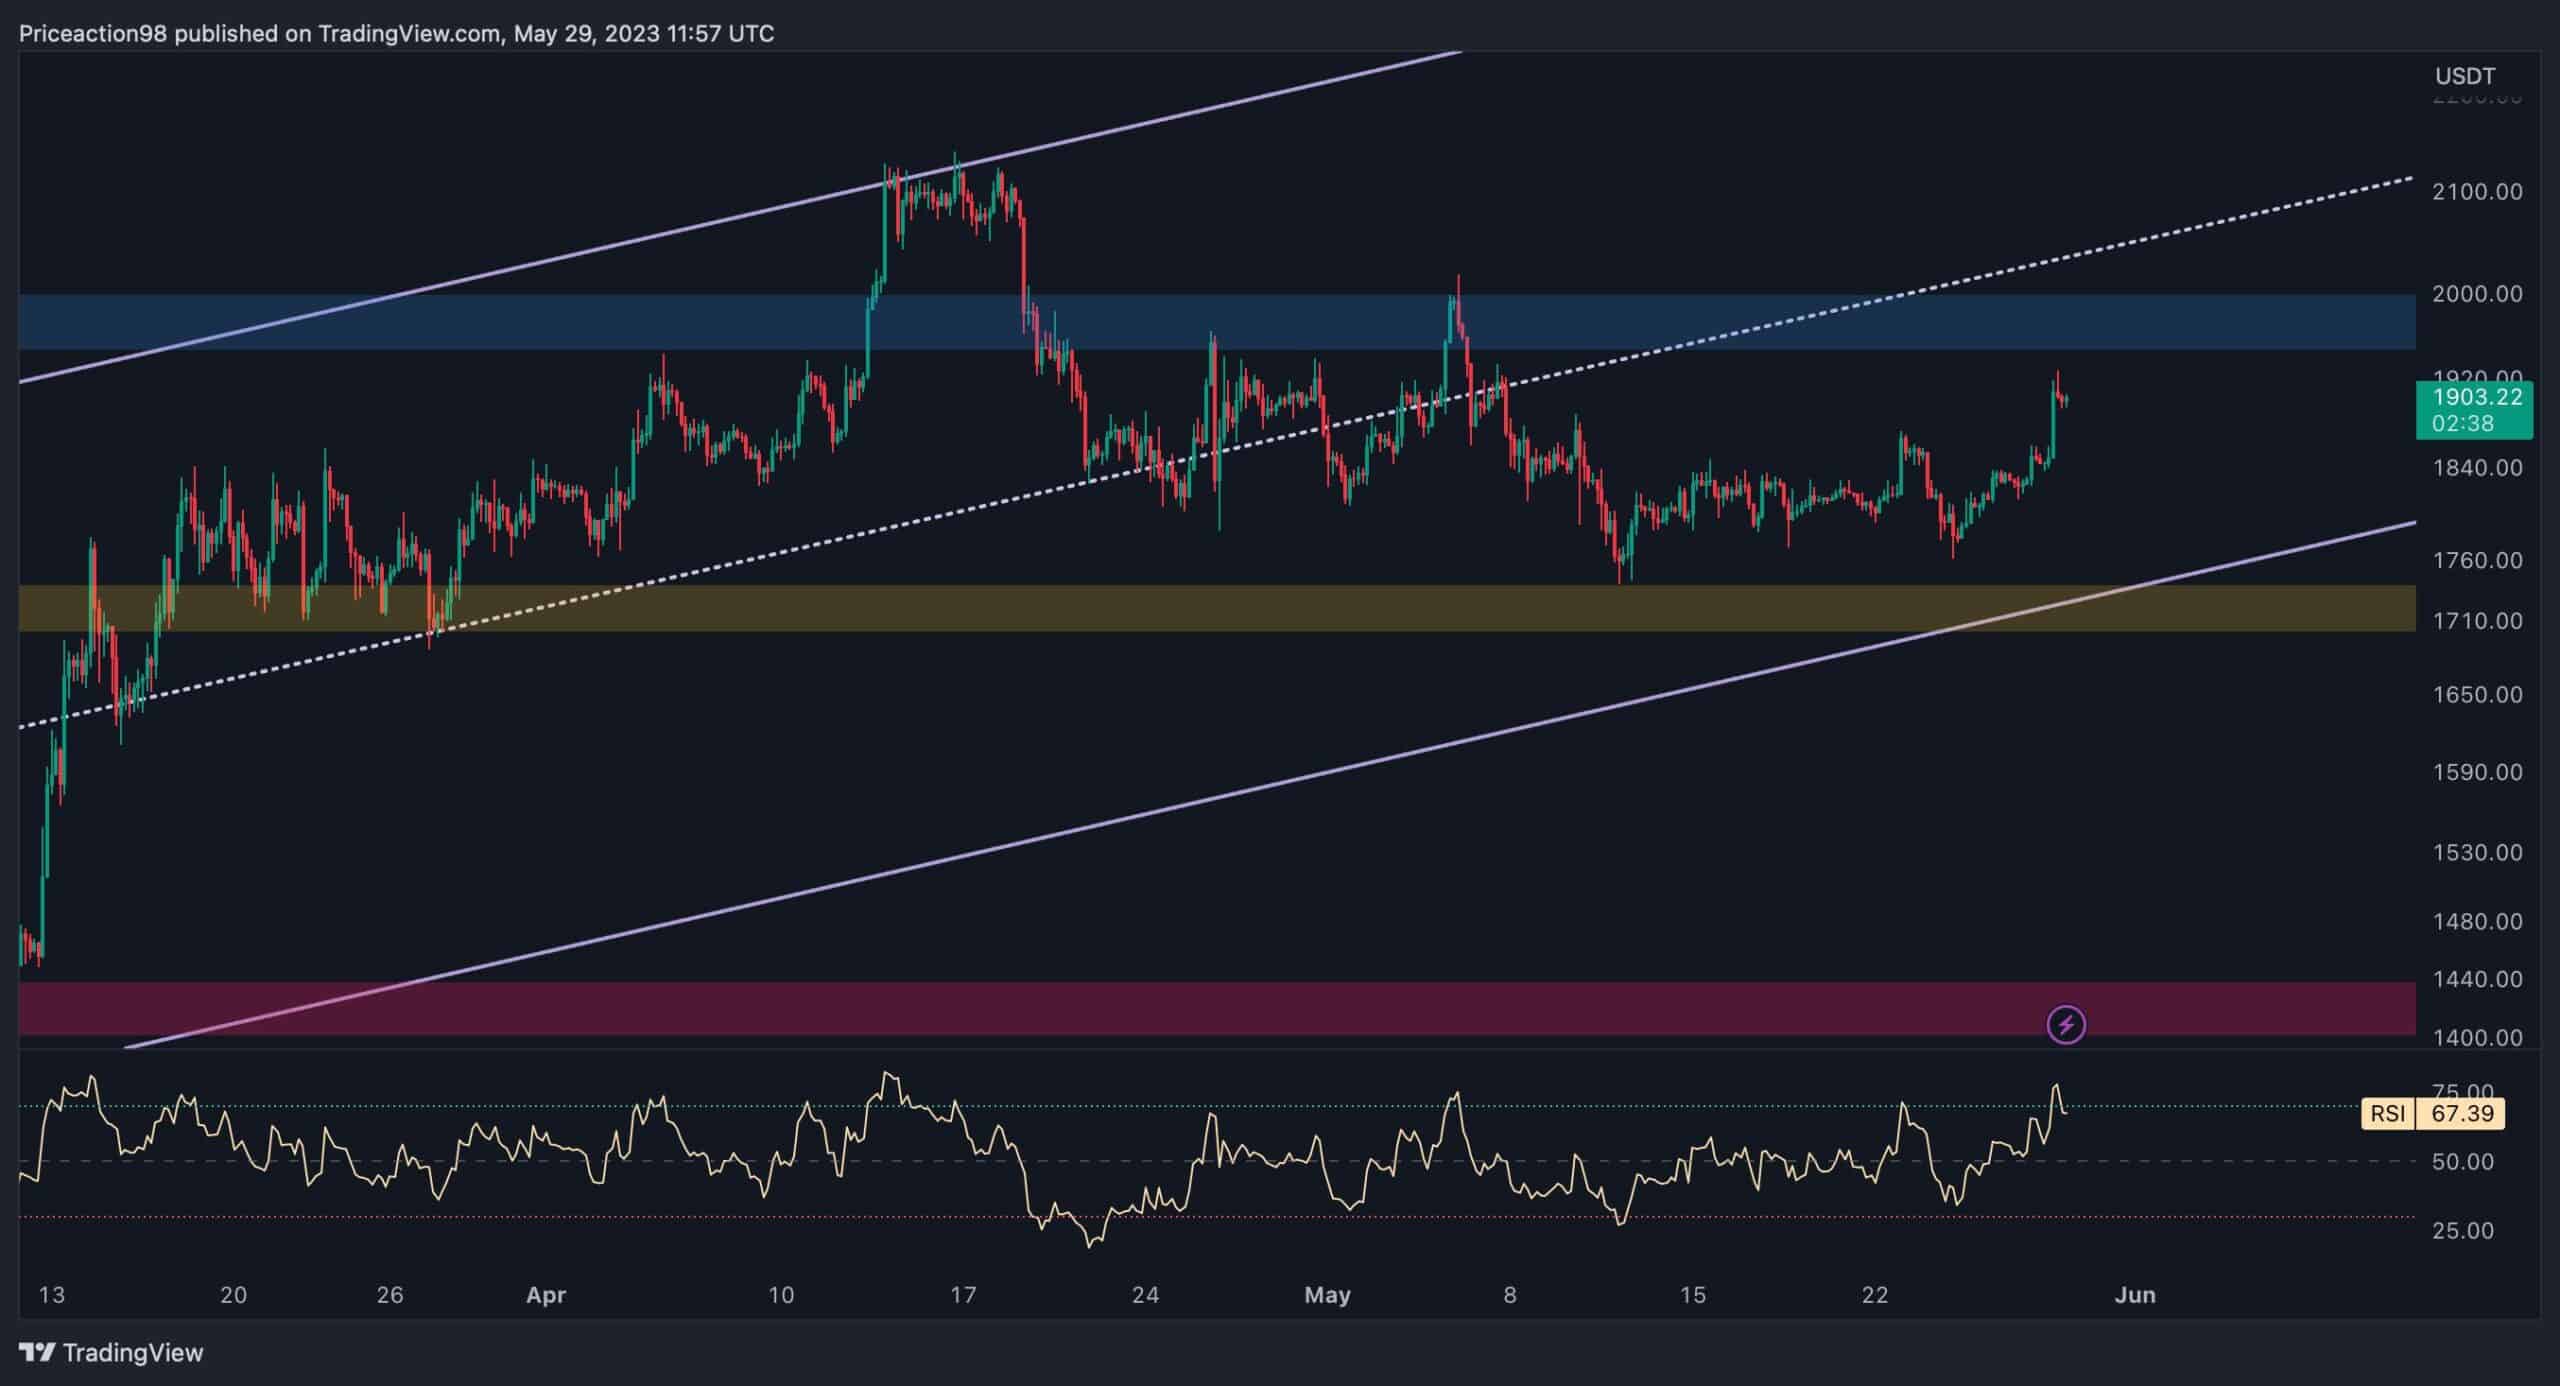
The 4-Hour Chart
Zooming in on the 4-hour chart, we can identify three crucial price regions: the static resistance at $2K, the dynamic resistance of the ascending channel’s trend-line midpoint, and the static support at $1710.
Based on the current price action, the price seems more likely to continue its upward trend toward the $2K resistance and attempt to break out. However, considering the current market conditions and the prevailing uncertainty among participants, it is also likely that a consolidation phase between the $2K resistance and the $1710 support regions will take place.
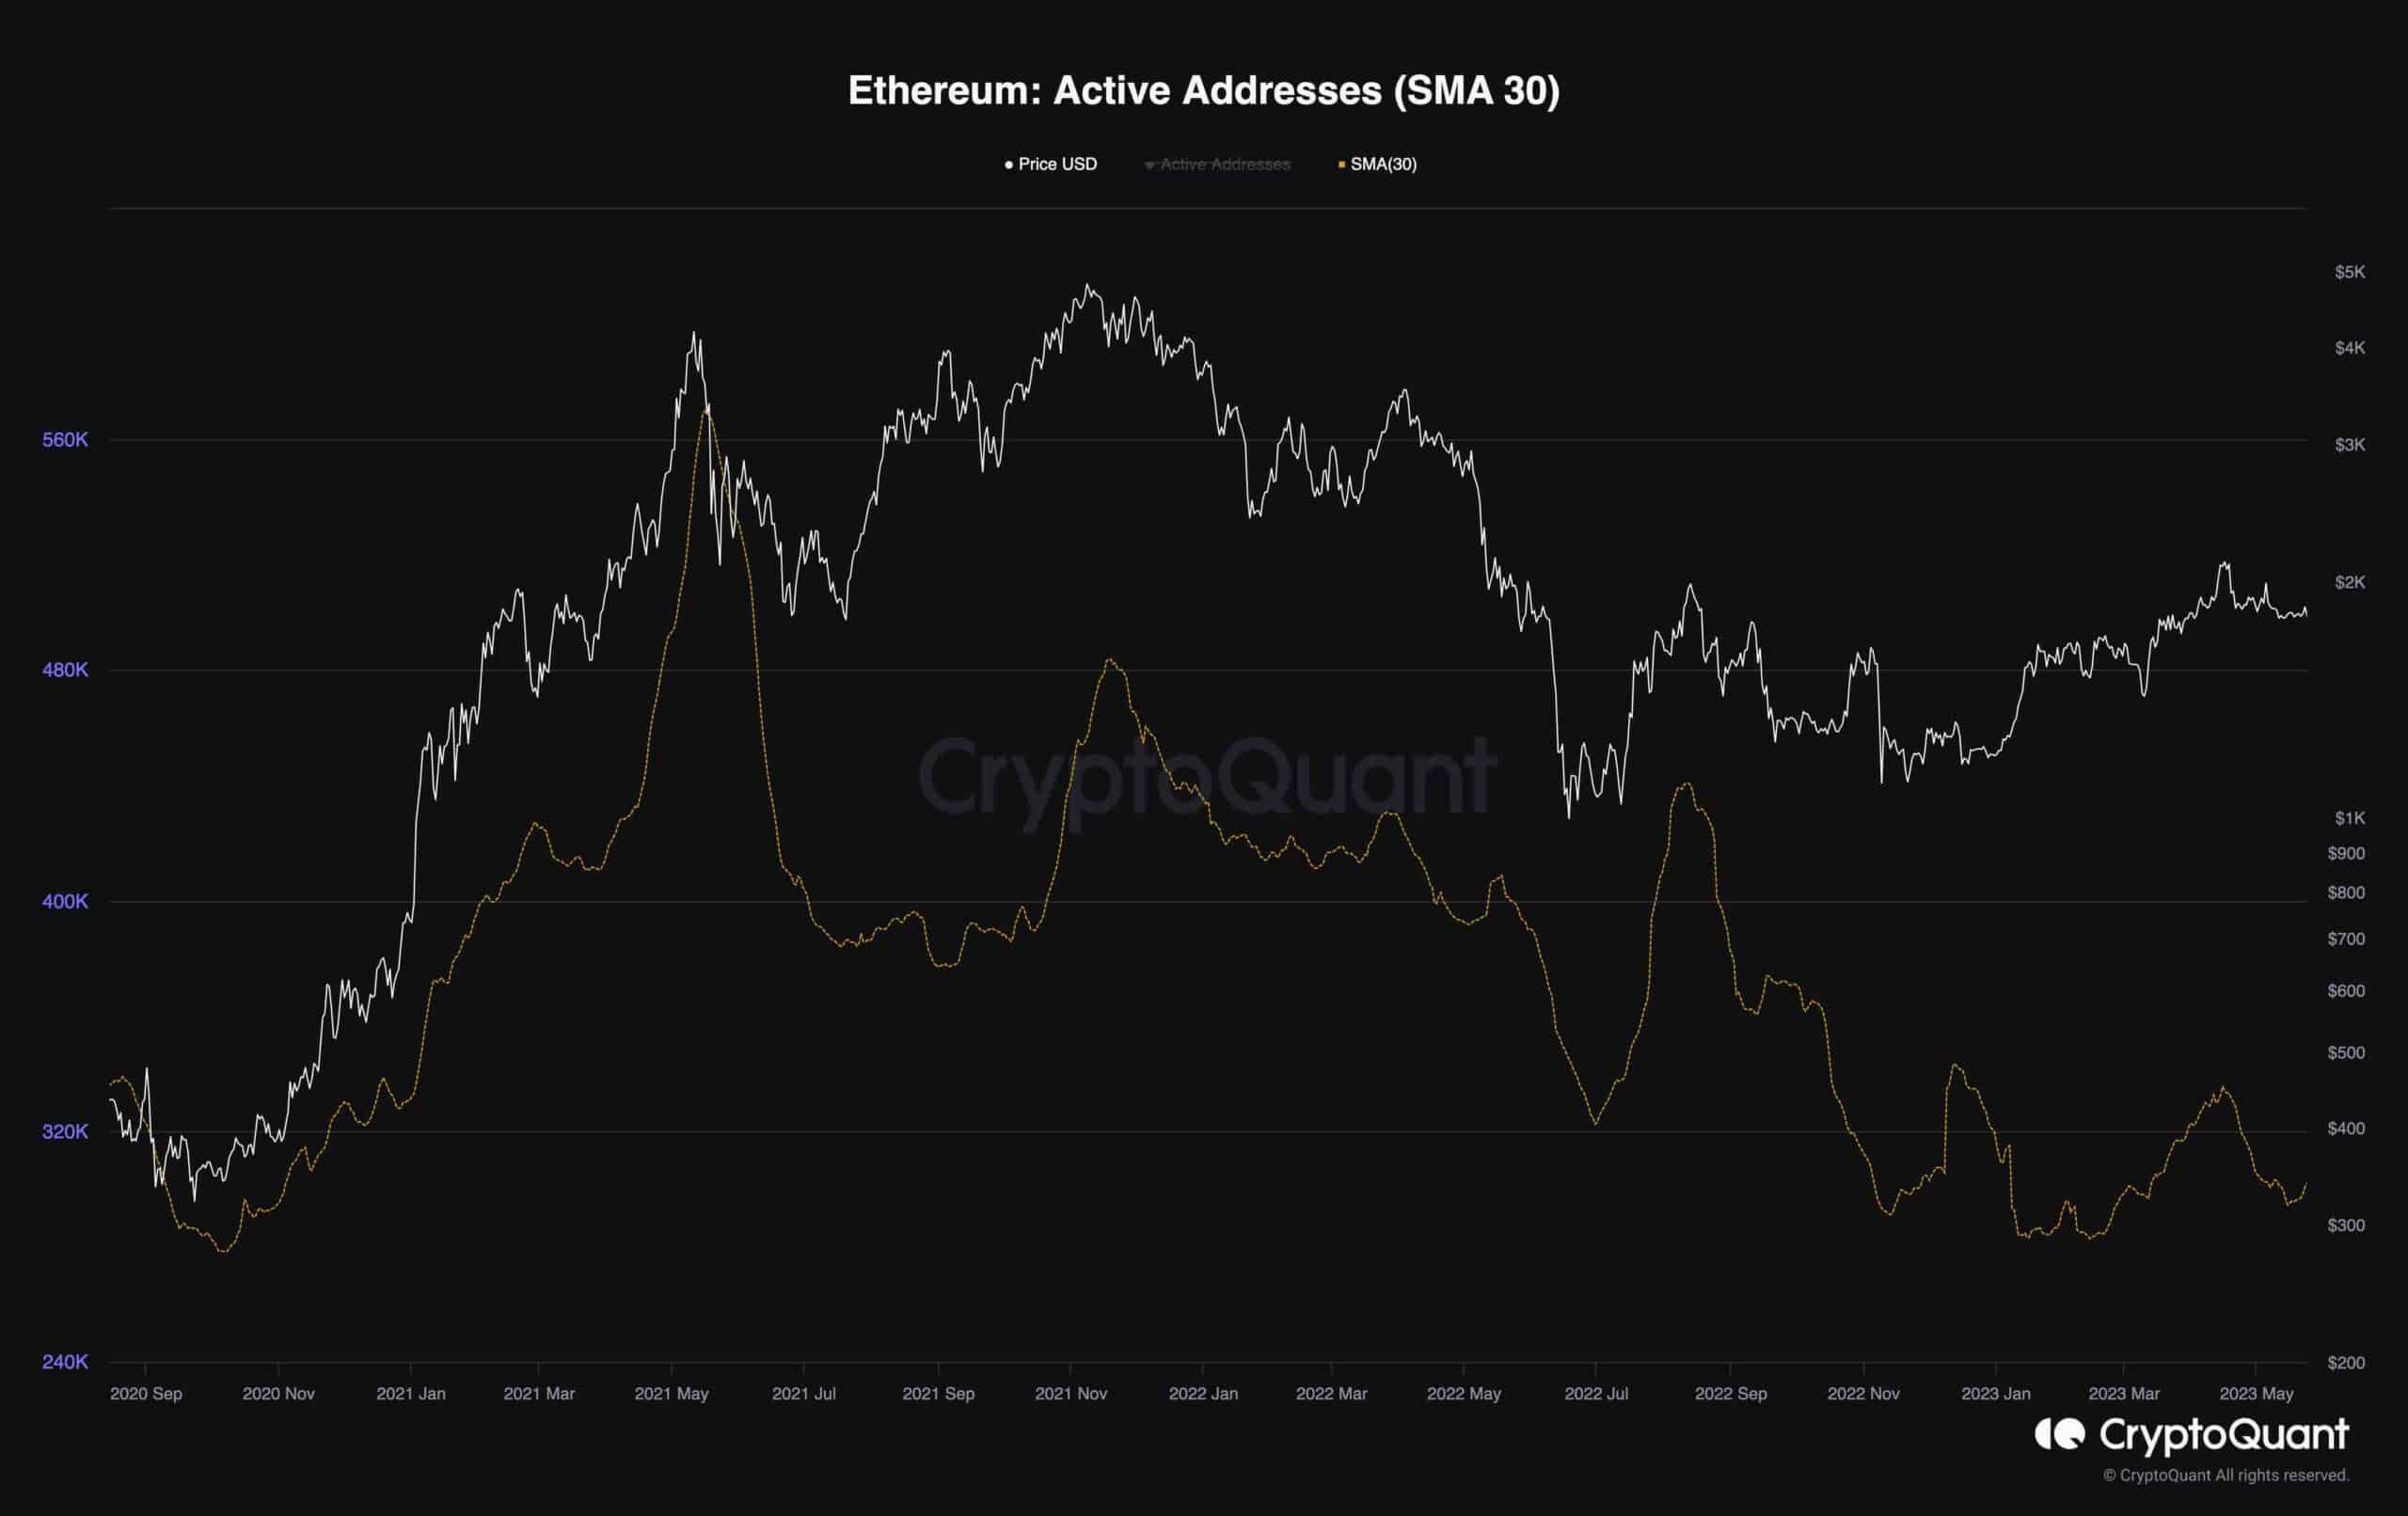
On-chain Analysis
Price fluctuations in the market result from the dynamic interplay between supply and demand forces. Demand plays a crucial role among these forces, and closely monitoring market participants’ behavior is critical to assessing the existing demand.
One effective way to gain insights is by analyzing the Active Addresses metric. It measures the total number of unique active addresses, including both senders and receivers. During the recent consolidation phase, it has fallen into a downtrend, indicating a decrease in demand and a period of uncertainty among market participants.
Furthermore, the metric has recently hit its lowest point of the year, suggesting that the current level of demand is insufficient to signal the beginning of the next bull run. As a result, the market needs increased activity to kickstart a healthy bullish cycle. This could potentially be achieved if the price successfully breaks through the significant resistance region at $2K.