Technical Analysis By TradingRage Ethereum’s price is finally trading above ,000 again. Investors are more optimistic than ever, hoping that a new bull market has begun and ETH’s price is destined for a new ATH in the coming months. Yet, it is wise to be cautious after significant price movements. The Daily Chart On the daily timeframe, the price surged significantly yesterday after getting supported by the 200-day moving average around the ,800 mark. The market has broken above the large descending channel, indicating that a new bullish wave is on the horizon. However, a short-term consolidation or correction seems very likely at the moment. The price has reached the ,200 resistance level, and the Relative Strength Index is also showing a clear overbought signal.
Topics:
CryptoVizArt considers the following as important: ETH Analysis, ETHBTC, Ethereum (ETH) Price, ethusd
This could be interesting, too:
Mandy Williams writes Ethereum Derivatives Metrics Signal Modest Downside Tail Risk Ahead: Nansen
Jordan Lyanchev writes Weekly Bitcoin, Ethereum ETF Recap: Light at the End of the Tunnel for BTC
CryptoVizArt writes Will Weak Momentum Drive ETH to .5K? (Ethereum Price Analysis)
Jordan Lyanchev writes Bybit Hack Fallout: Arthur Hayes, Samson Mow Push for Ethereum Rollback
Technical Analysis
By TradingRage
Ethereum’s price is finally trading above $2,000 again. Investors are more optimistic than ever, hoping that a new bull market has begun and ETH’s price is destined for a new ATH in the coming months. Yet, it is wise to be cautious after significant price movements.
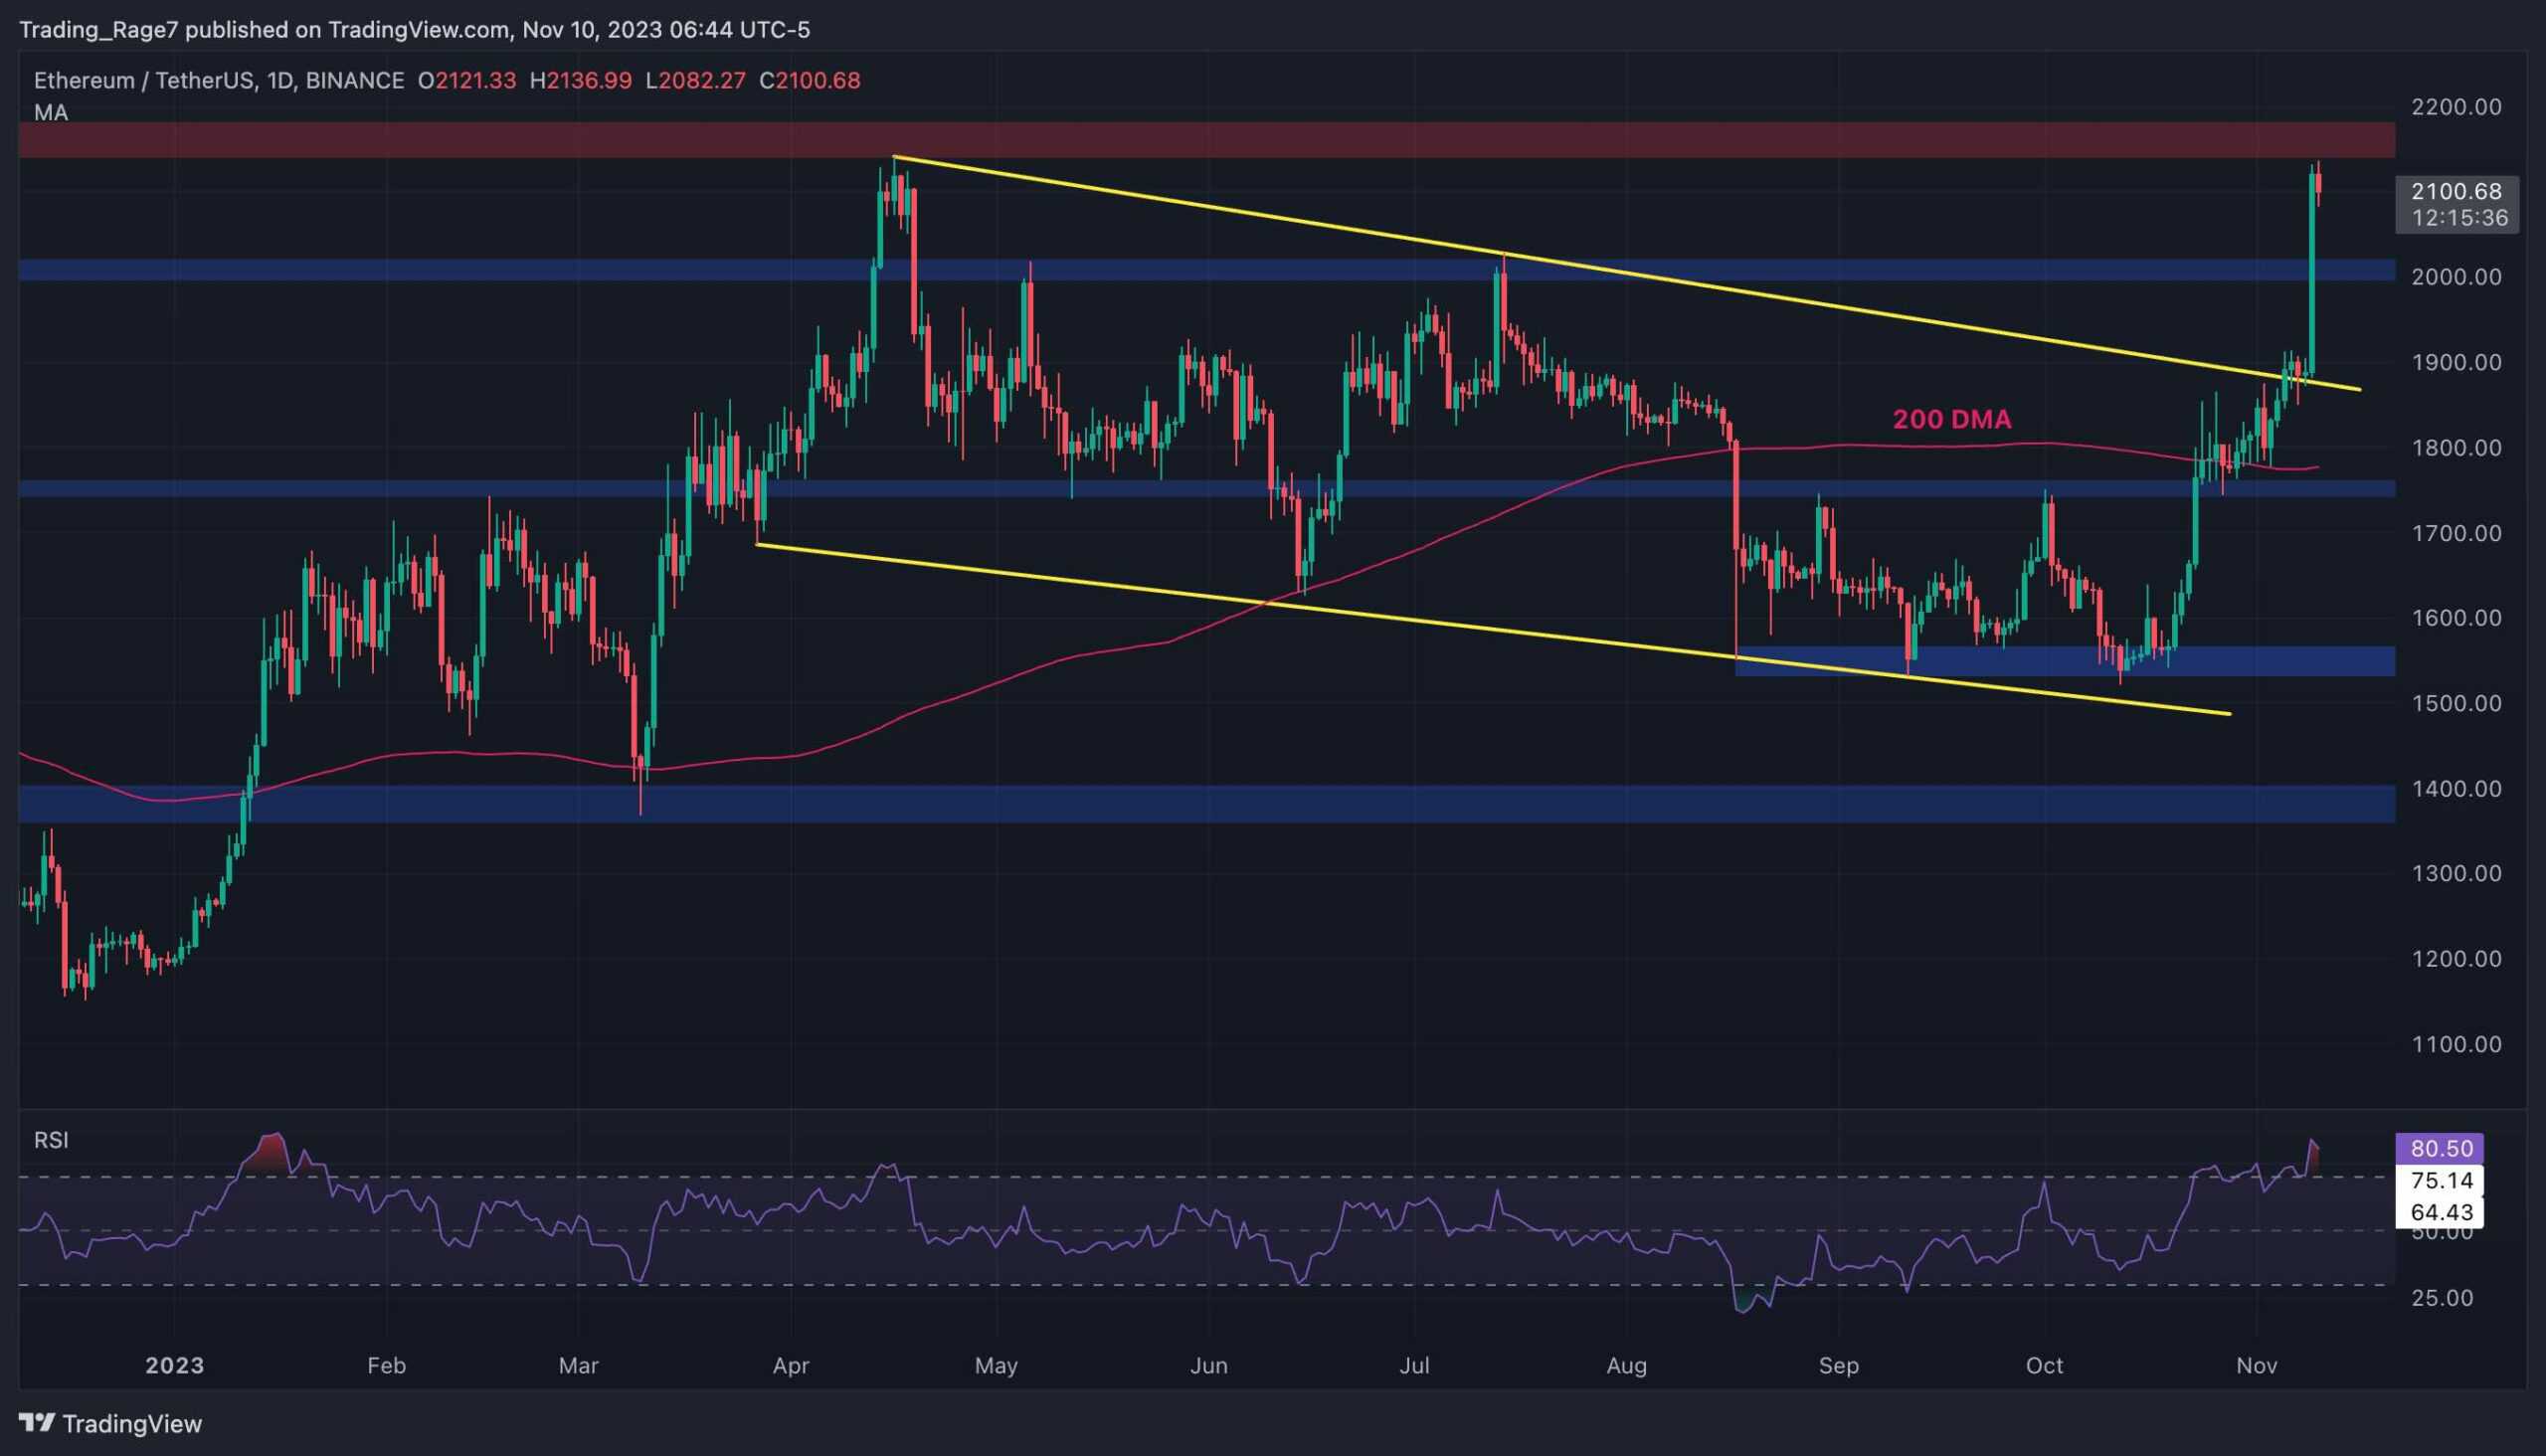
The Daily Chart
On the daily timeframe, the price surged significantly yesterday after getting supported by the 200-day moving average around the $1,800 mark. The market has broken above the large descending channel, indicating that a new bullish wave is on the horizon. However, a short-term consolidation or correction seems very likely at the moment.
The price has reached the $2,200 resistance level, and the Relative Strength Index is also showing a clear overbought signal.
As a result, a pullback to the $2,000 level is highly probable, with a deeper drop toward the higher trendline of the broken channel also possible.
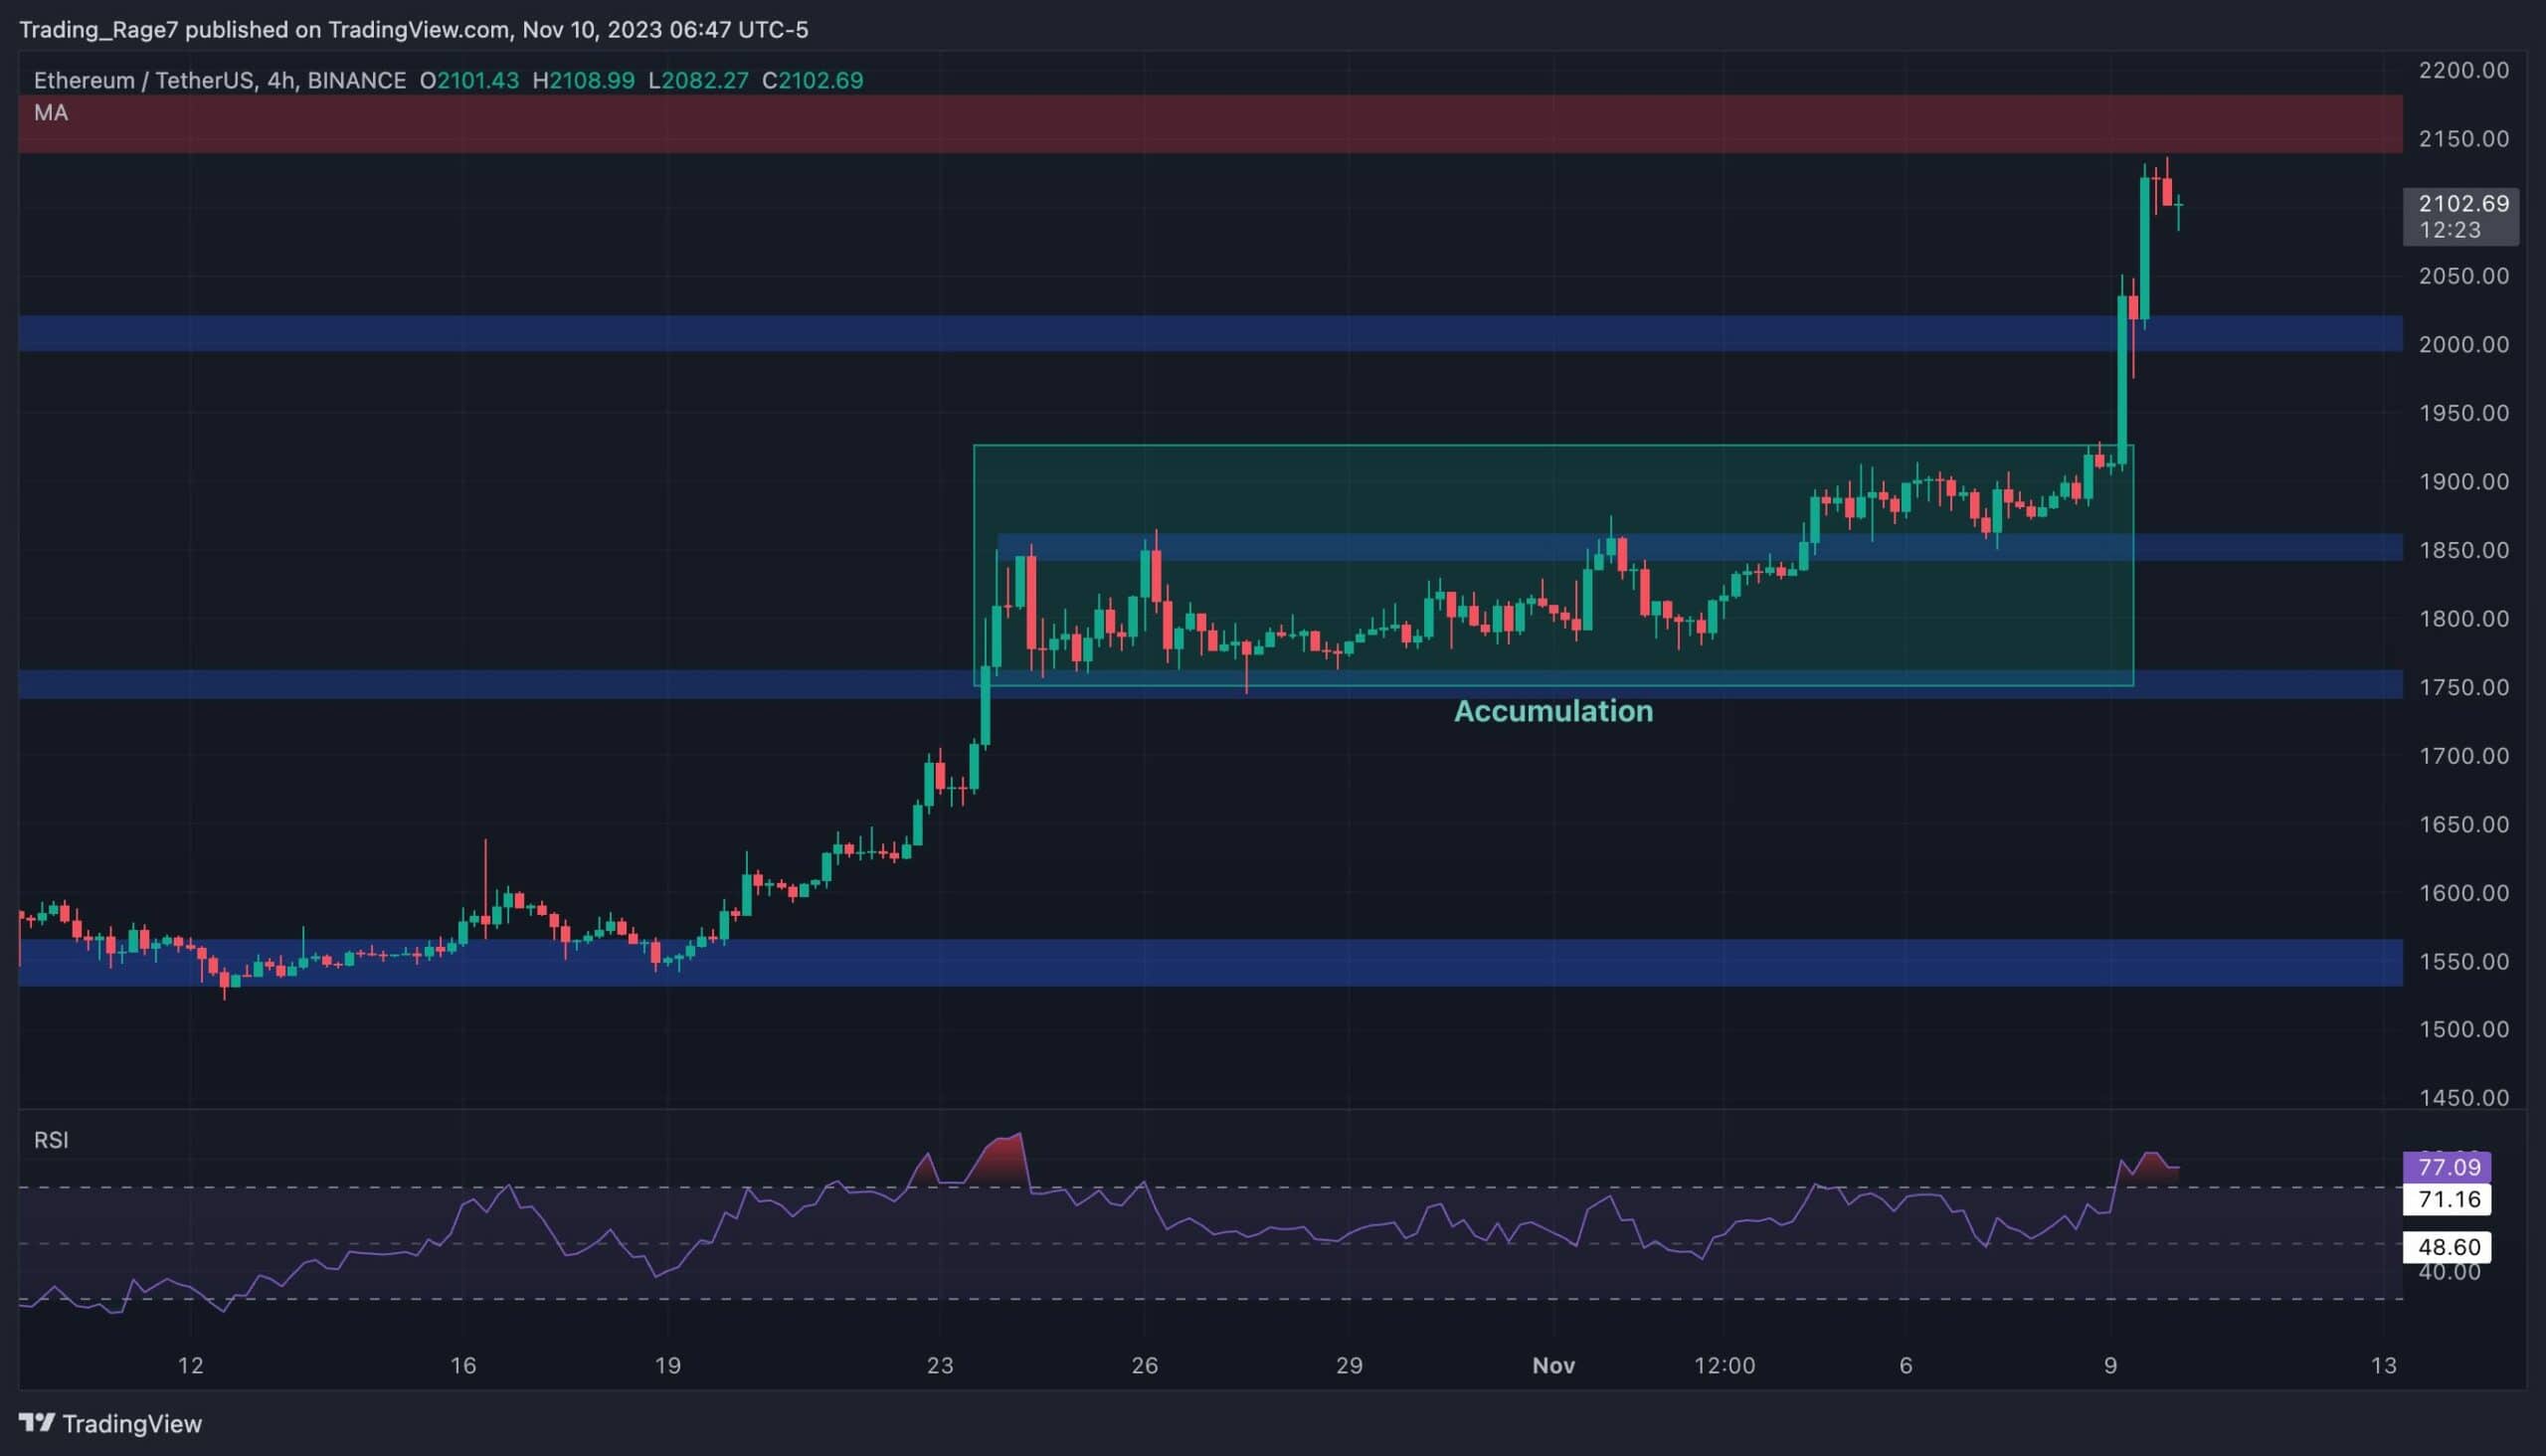
The 4-Hour Chart
The 4-hour chart depicts a classic bullish continuation pattern. The price first rebounded from the $1,550 level in October.
Then, the market went through a few weeks of accumulation phase, consolidating below the $2,000 level and creating a clear price range. Finally, yesterday’s price rally was a direct result of the long accumulation phase in the last few weeks, and the price is currently testing the $2,150 resistance zone.
Meanwhile, similar to the daily timeframe, the Relative Strength Index indicates an overbought state in momentum. Therefore, a drop back toward the $2,000 level or even the mid-line of the accumulation range at the $1,850 mark can be expected in the short term before a further move higher.
Sentiment Analysis
By TradingRage
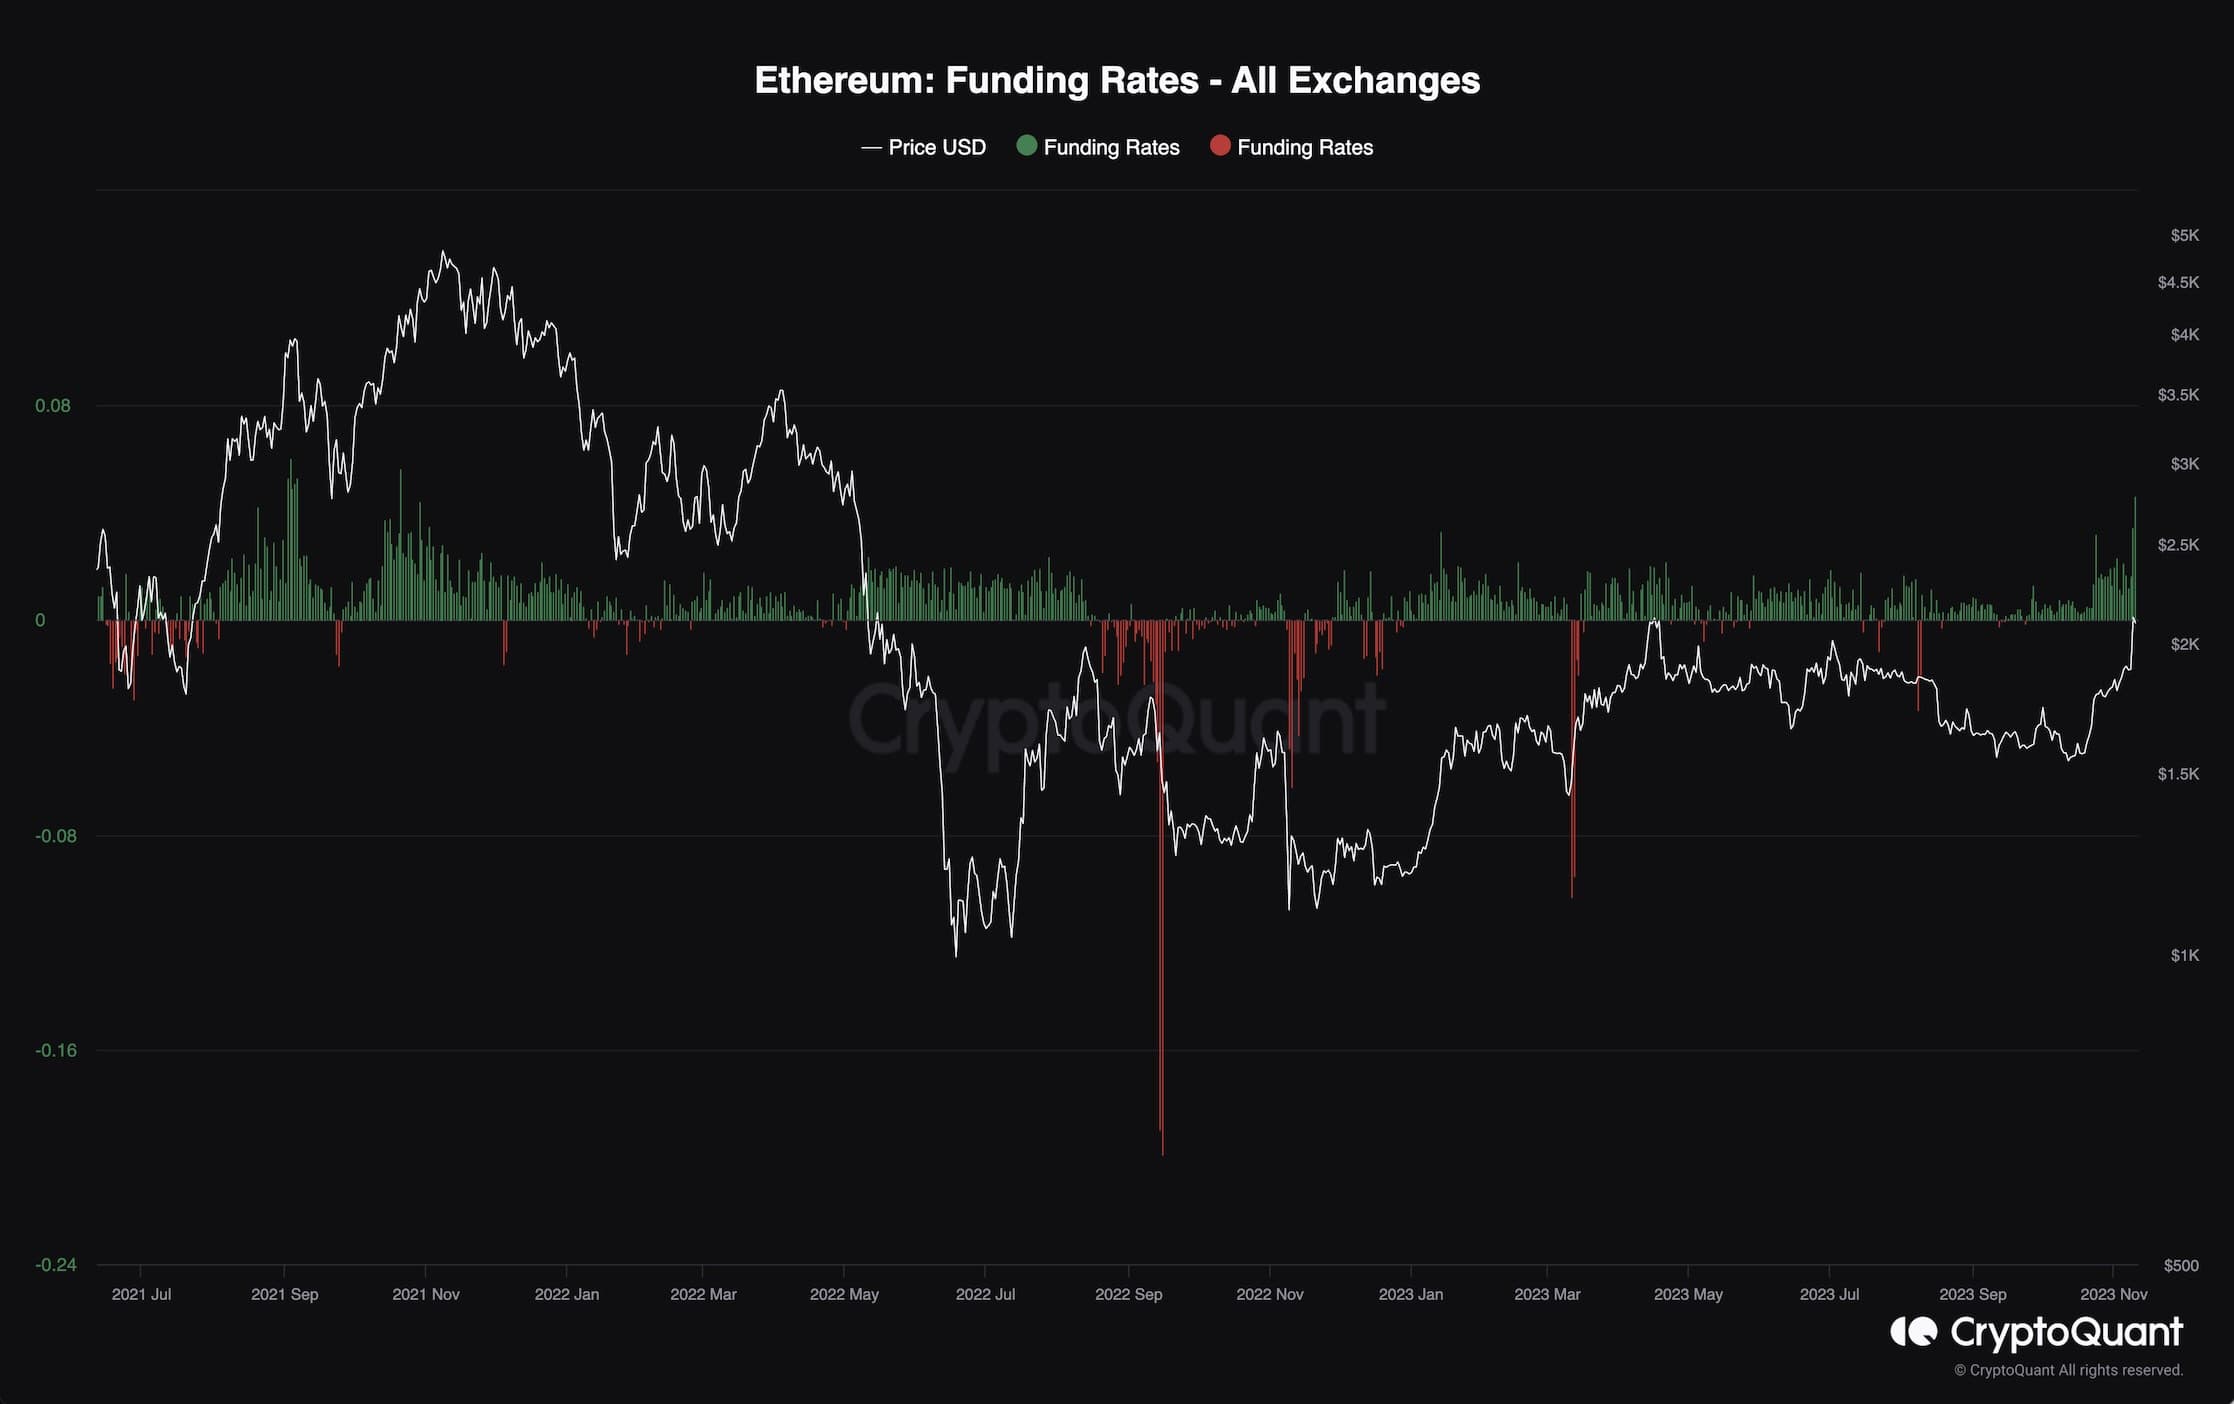
Funding Rates
Ethereum’s price skyrocketed more than 10% yesterday, breaking above the key $2,000 level. However, the derivatives market is demonstrating a rather worrying signal that market participants should consider carefully before taking any action.
This chart represents the funding rates for Ethereum, which is one of the prominent metrics for futures market sentiment evaluation. Positive values show optimism, and negative values exhibit pessimism in the futures traders.
While for any bullish trend, positive funding rates are necessary, there is such a thing as “too high” for this metric. Following yesterday’s price surge, the funding rates have spiked considerably, reaching levels last seen during the final phases of the 2021 bull market. Therefore, a correction or even a total reversal might be on the horizon as a result of a potential long liquidation cascade.