Ethereum’s price dropped significantly yesterday after multiple weeks of rising, causing investors to question the validity of the recent positive sentiment and wonder if a bearish continuation will soon follow. Technical Analysis By: Edris The Daily Chart: On the daily chart, the price has constantly been pushing higher, except for the last day, which saw the market plunge by almost 9%. Interestingly, the price is yet to reach the 00 resistance, but the 00 psychological level was well defended by the bears. The RSI indicator also hinted at a potential pullback or reversal earlier, with a clear overbought signal. Currently, Ethereum could rely on the 00 level and the 50-day moving average, trending around the same price mark, as potential support. If the bullish
Topics:
CryptoVizArt considers the following as important: ETH Analysis, ETHBTC, Ethereum (ETH) Price, ethusd
This could be interesting, too:
Mandy Williams writes Ethereum Derivatives Metrics Signal Modest Downside Tail Risk Ahead: Nansen
Jordan Lyanchev writes Weekly Bitcoin, Ethereum ETF Recap: Light at the End of the Tunnel for BTC
CryptoVizArt writes Will Weak Momentum Drive ETH to .5K? (Ethereum Price Analysis)
Jordan Lyanchev writes Bybit Hack Fallout: Arthur Hayes, Samson Mow Push for Ethereum Rollback
Ethereum’s price dropped significantly yesterday after multiple weeks of rising, causing investors to question the validity of the recent positive sentiment and wonder if a bearish continuation will soon follow.
Technical Analysis
By: Edris
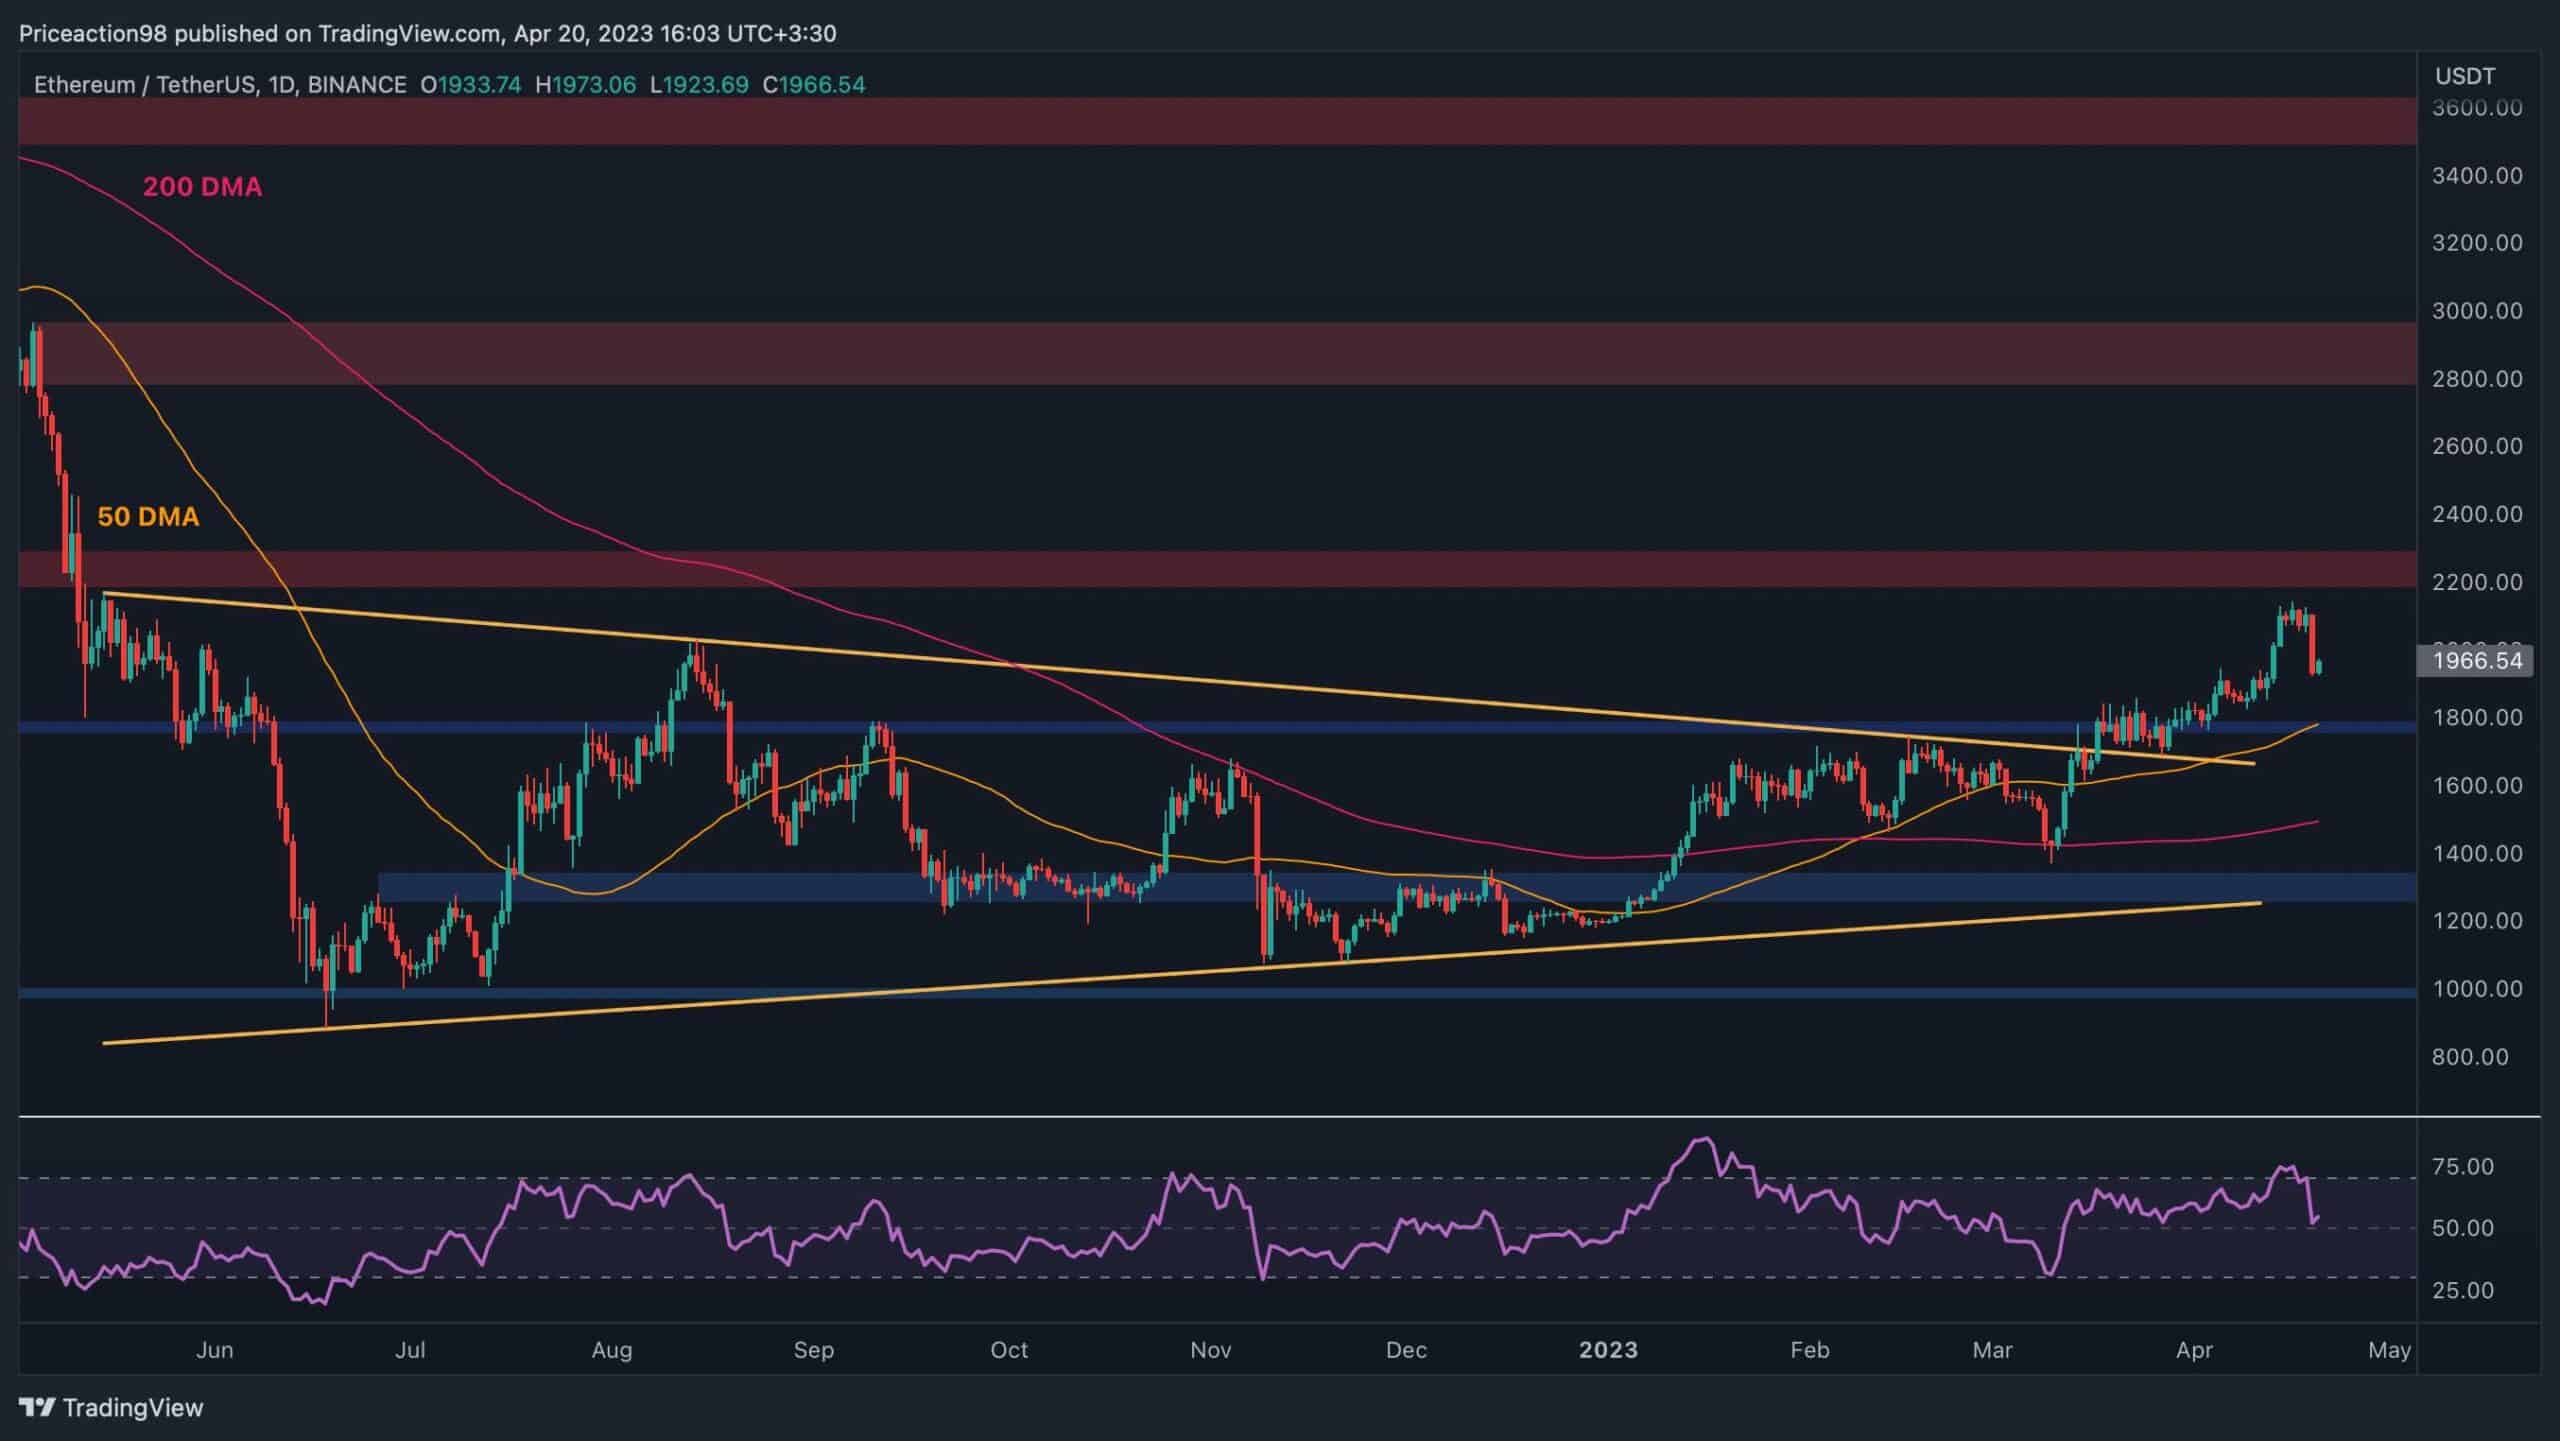
The Daily Chart:
On the daily chart, the price has constantly been pushing higher, except for the last day, which saw the market plunge by almost 9%. Interestingly, the price is yet to reach the $2200 resistance, but the $2000 psychological level was well defended by the bears.
The RSI indicator also hinted at a potential pullback or reversal earlier, with a clear overbought signal.
Currently, Ethereum could rely on the $1800 level and the 50-day moving average, trending around the same price mark, as potential support. If the bullish trend survives and the $2000 and $2200 levels finally get broken to the upside, a rally toward the significant $3000 resistance zone would be highly probable.
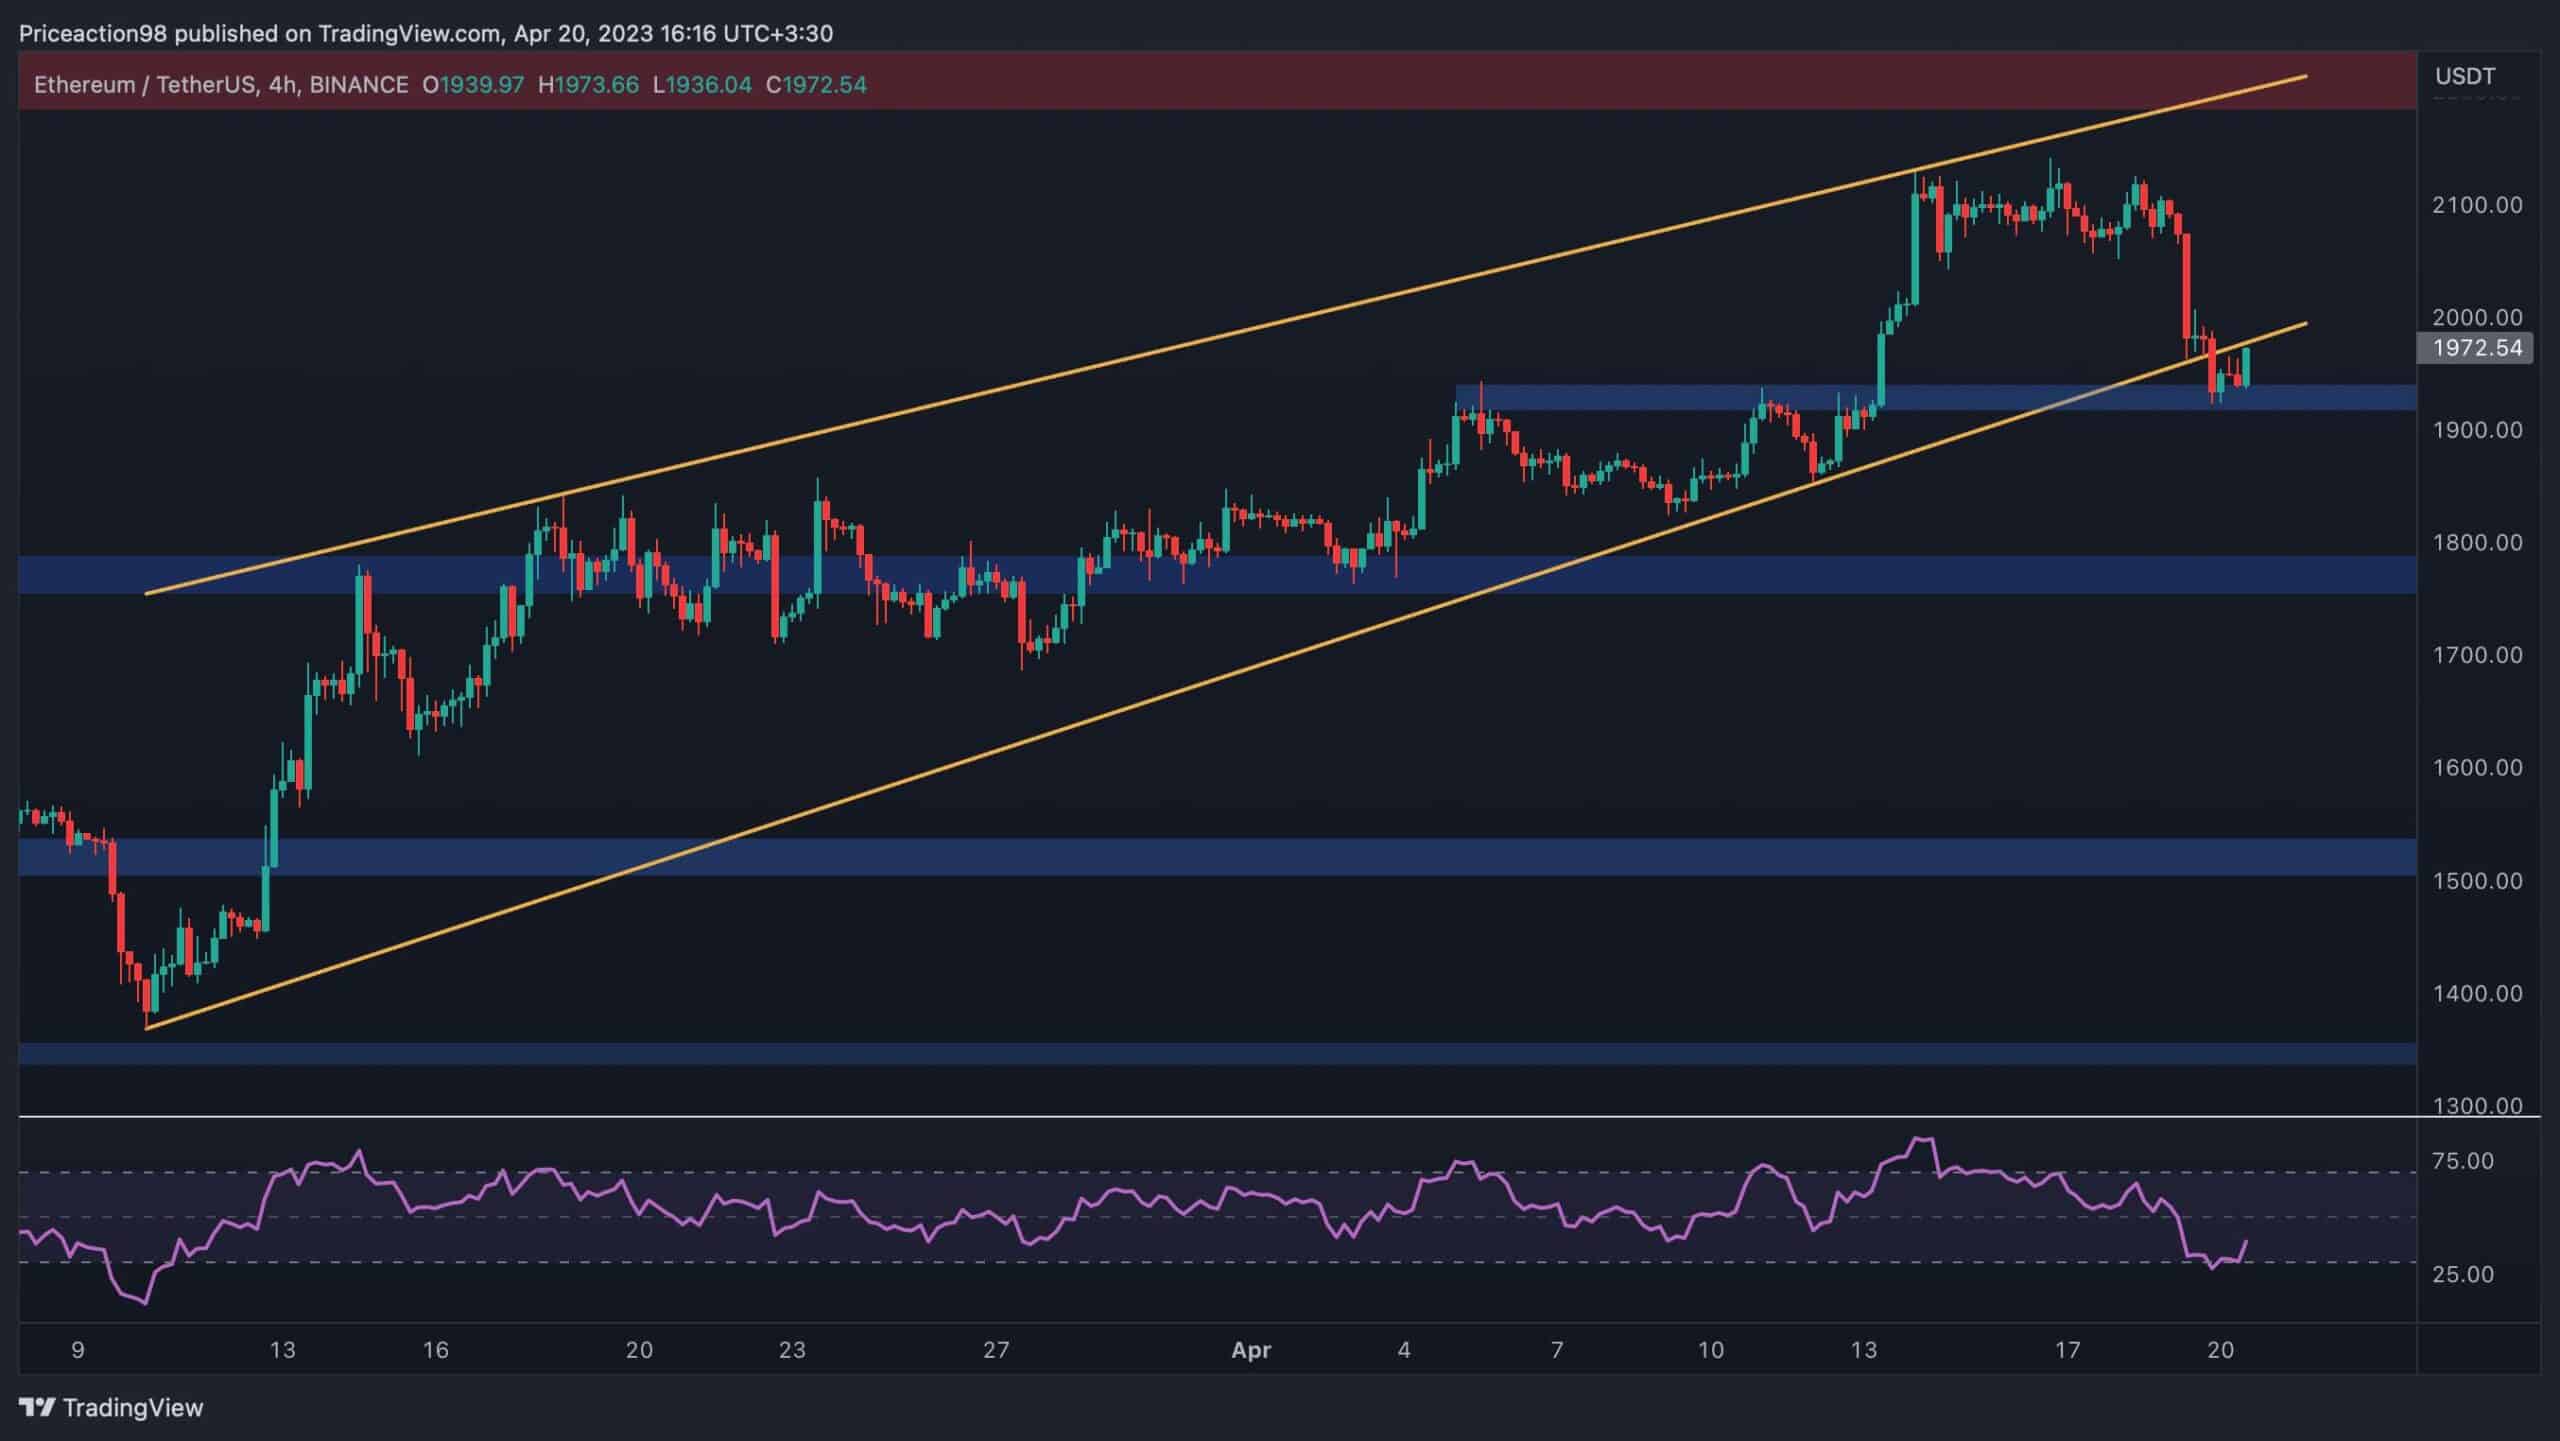
The 4-Hour Chart:
Looking at the 4-hour chart, things do not look much better for ETH, as the price has broken below the large ascending channel. The minor $1930 resistance level is holding the market at the moment, as the price is retesting the broken lower boundary of the channel.
If the price climbs back inside the channel, a bullish continuation higher could still be expected.
However, in case the trendline rejects the price, a drop towards at least the $1800 support area would be imminent. Although there are still multiple support levels, the bulls could look forward to pushing ETH higher and continuing the uptrend.
Sentiment Analysis
By: Shayan
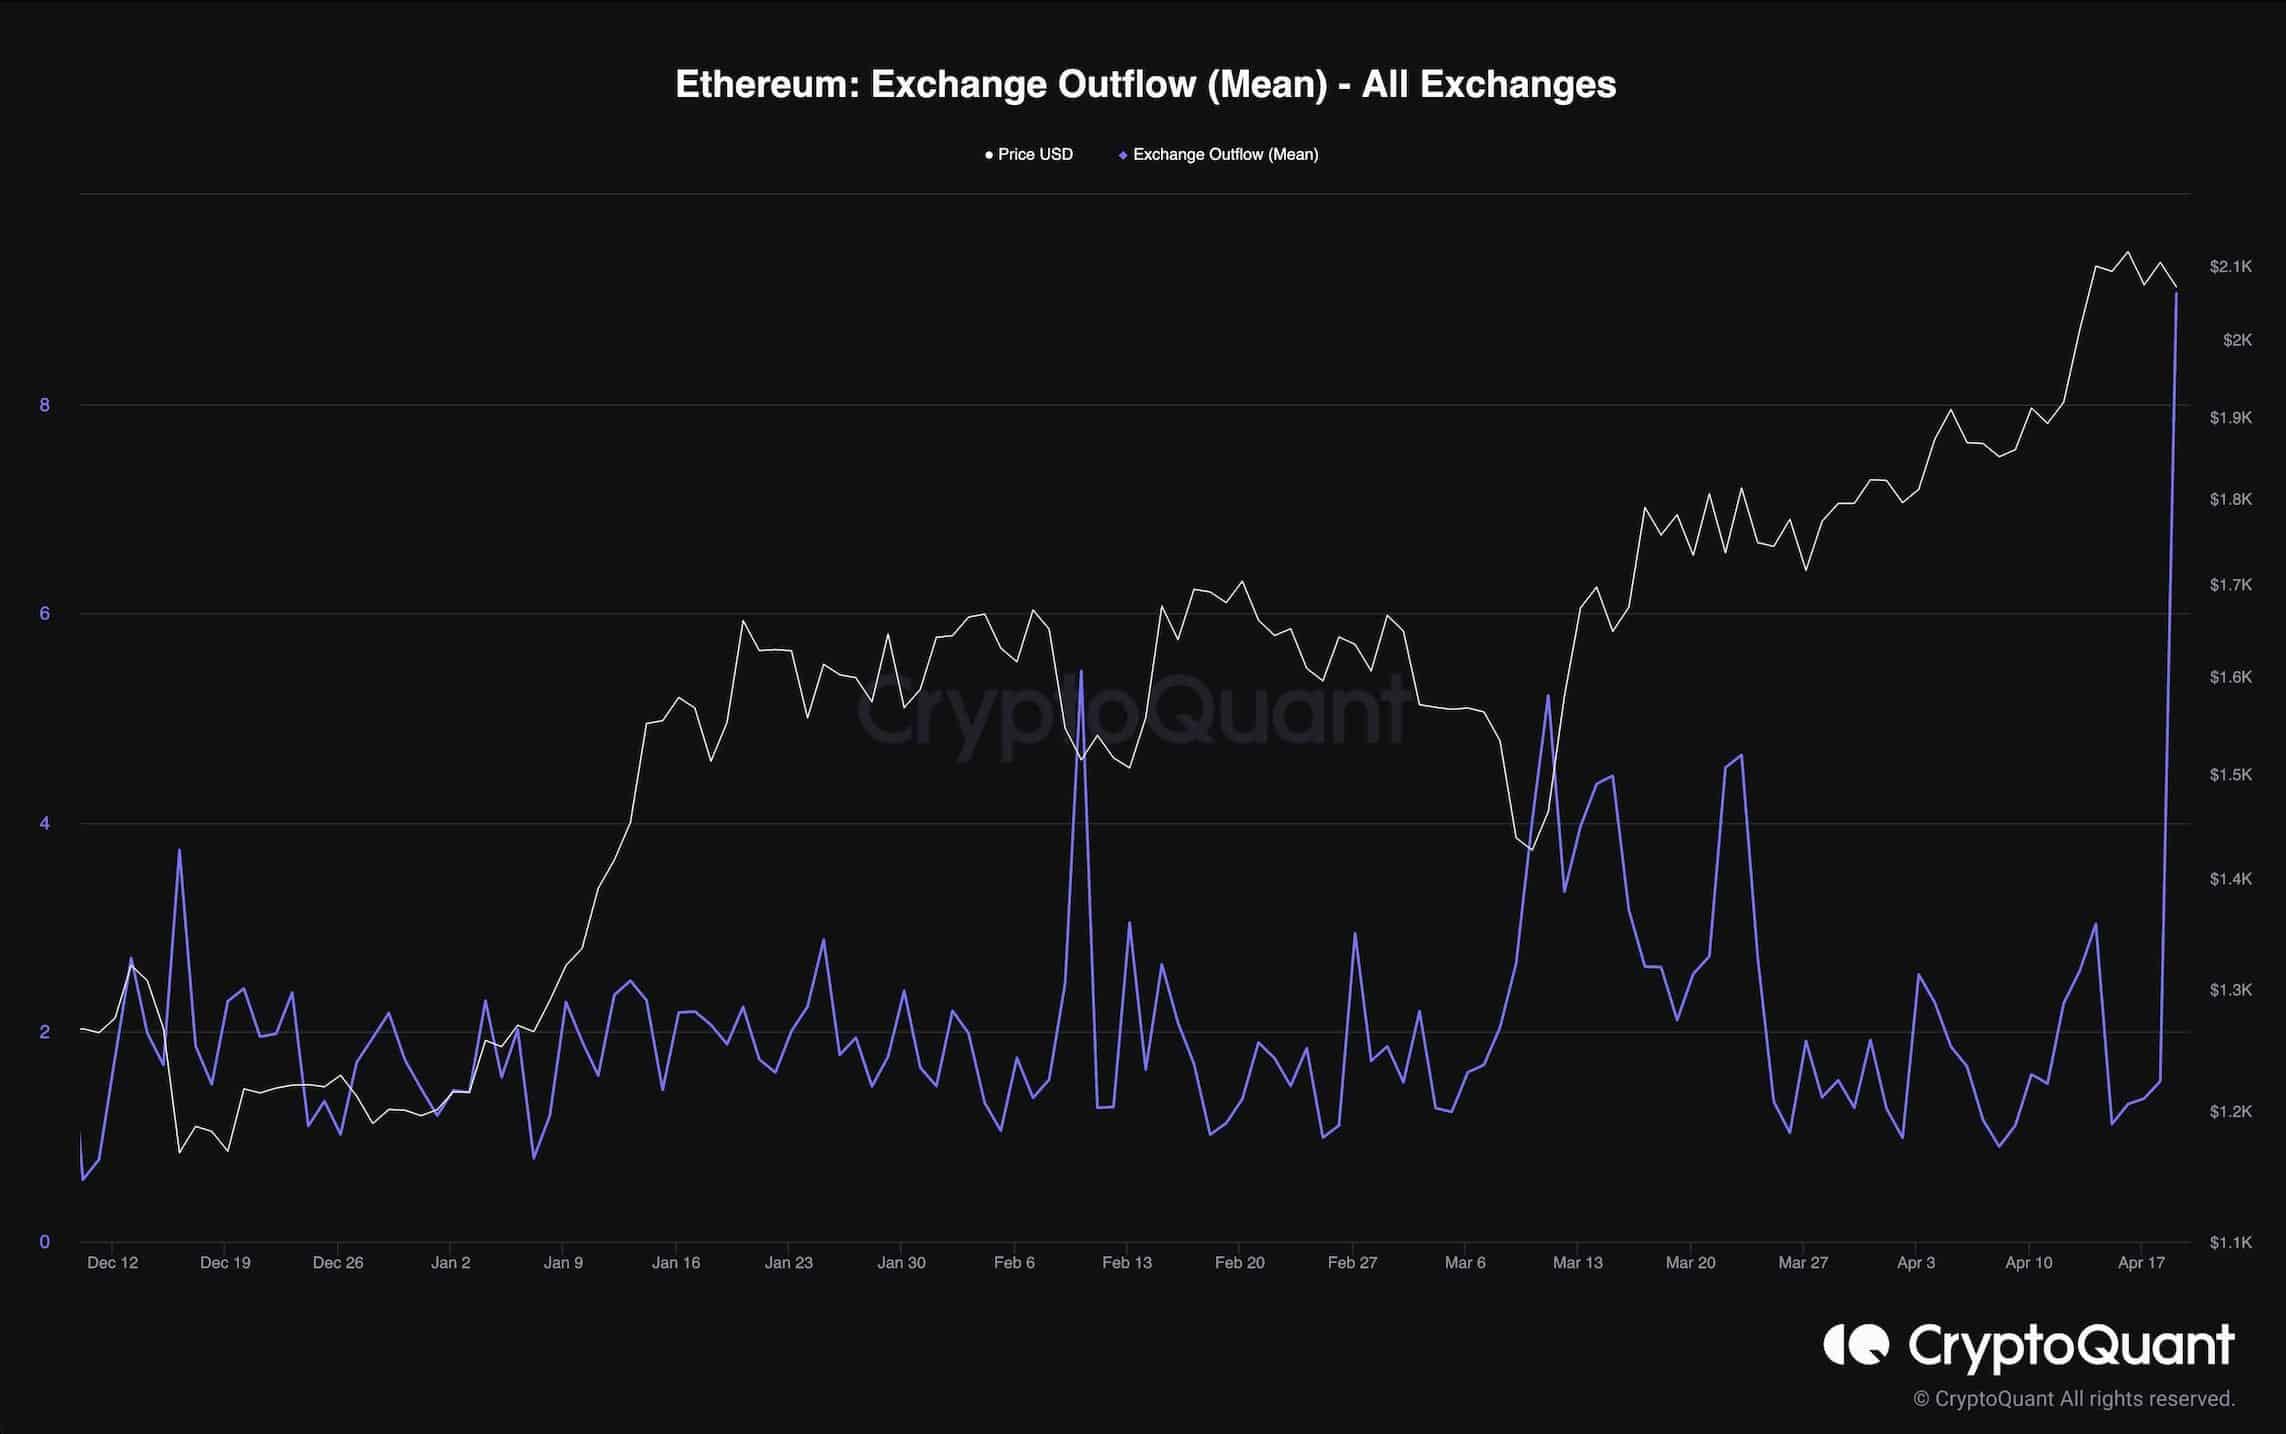
Ethereum Open Interest
This chart shows the Exchange Outflow (Mean) metric, which represents the average number of coins withdrawn per transaction from exchanges. Higher values suggest that investors are withdrawing more coins per transaction, indicating a decrease in selling pressure.
The chart indicates a significant surge in the metric at the time when Ethereum’s price spiked and reached the critical $2.1K price zone. This surge implies a shift in sentiment towards bullishness as investors accumulate Ethereum during its upward trend.
However, it is important to note that price corrections are always possible, and it is advisable to manage risks and avoid entering the market due to FOMO (fear of missing out).