Ethereum’s price has been rejected from a significant resistance level following the turmoil surrounding Silvergate. However, there are still multiple support levels available to hold the price for now. Technical Analysis By: Edris The Daily Chart On the daily timeframe, the price has been struggling to break above the 00 level. The higher boundary of the large symmetrical triangle pattern and a bearish rejection has led to the breakdown of the 50-day moving average located around the 00 mark. The 200-day moving average, located around 00, seems like the next probable support zone, followed by 00, which could be tested if a deeper pullback occurs. Source: TradingViewThe 4-Hour Chart On the 4-hour chart, the price has been impulsively rejected from the 50
Topics:
CryptoVizArt considers the following as important: ETH Analysis, ETHBTC, Ethereum (ETH) Price, ethusd
This could be interesting, too:
Mandy Williams writes Ethereum Derivatives Metrics Signal Modest Downside Tail Risk Ahead: Nansen
Jordan Lyanchev writes Weekly Bitcoin, Ethereum ETF Recap: Light at the End of the Tunnel for BTC
CryptoVizArt writes Will Weak Momentum Drive ETH to .5K? (Ethereum Price Analysis)
Jordan Lyanchev writes Bybit Hack Fallout: Arthur Hayes, Samson Mow Push for Ethereum Rollback
Ethereum’s price has been rejected from a significant resistance level following the turmoil surrounding Silvergate. However, there are still multiple support levels available to hold the price for now.
Technical Analysis
By: Edris
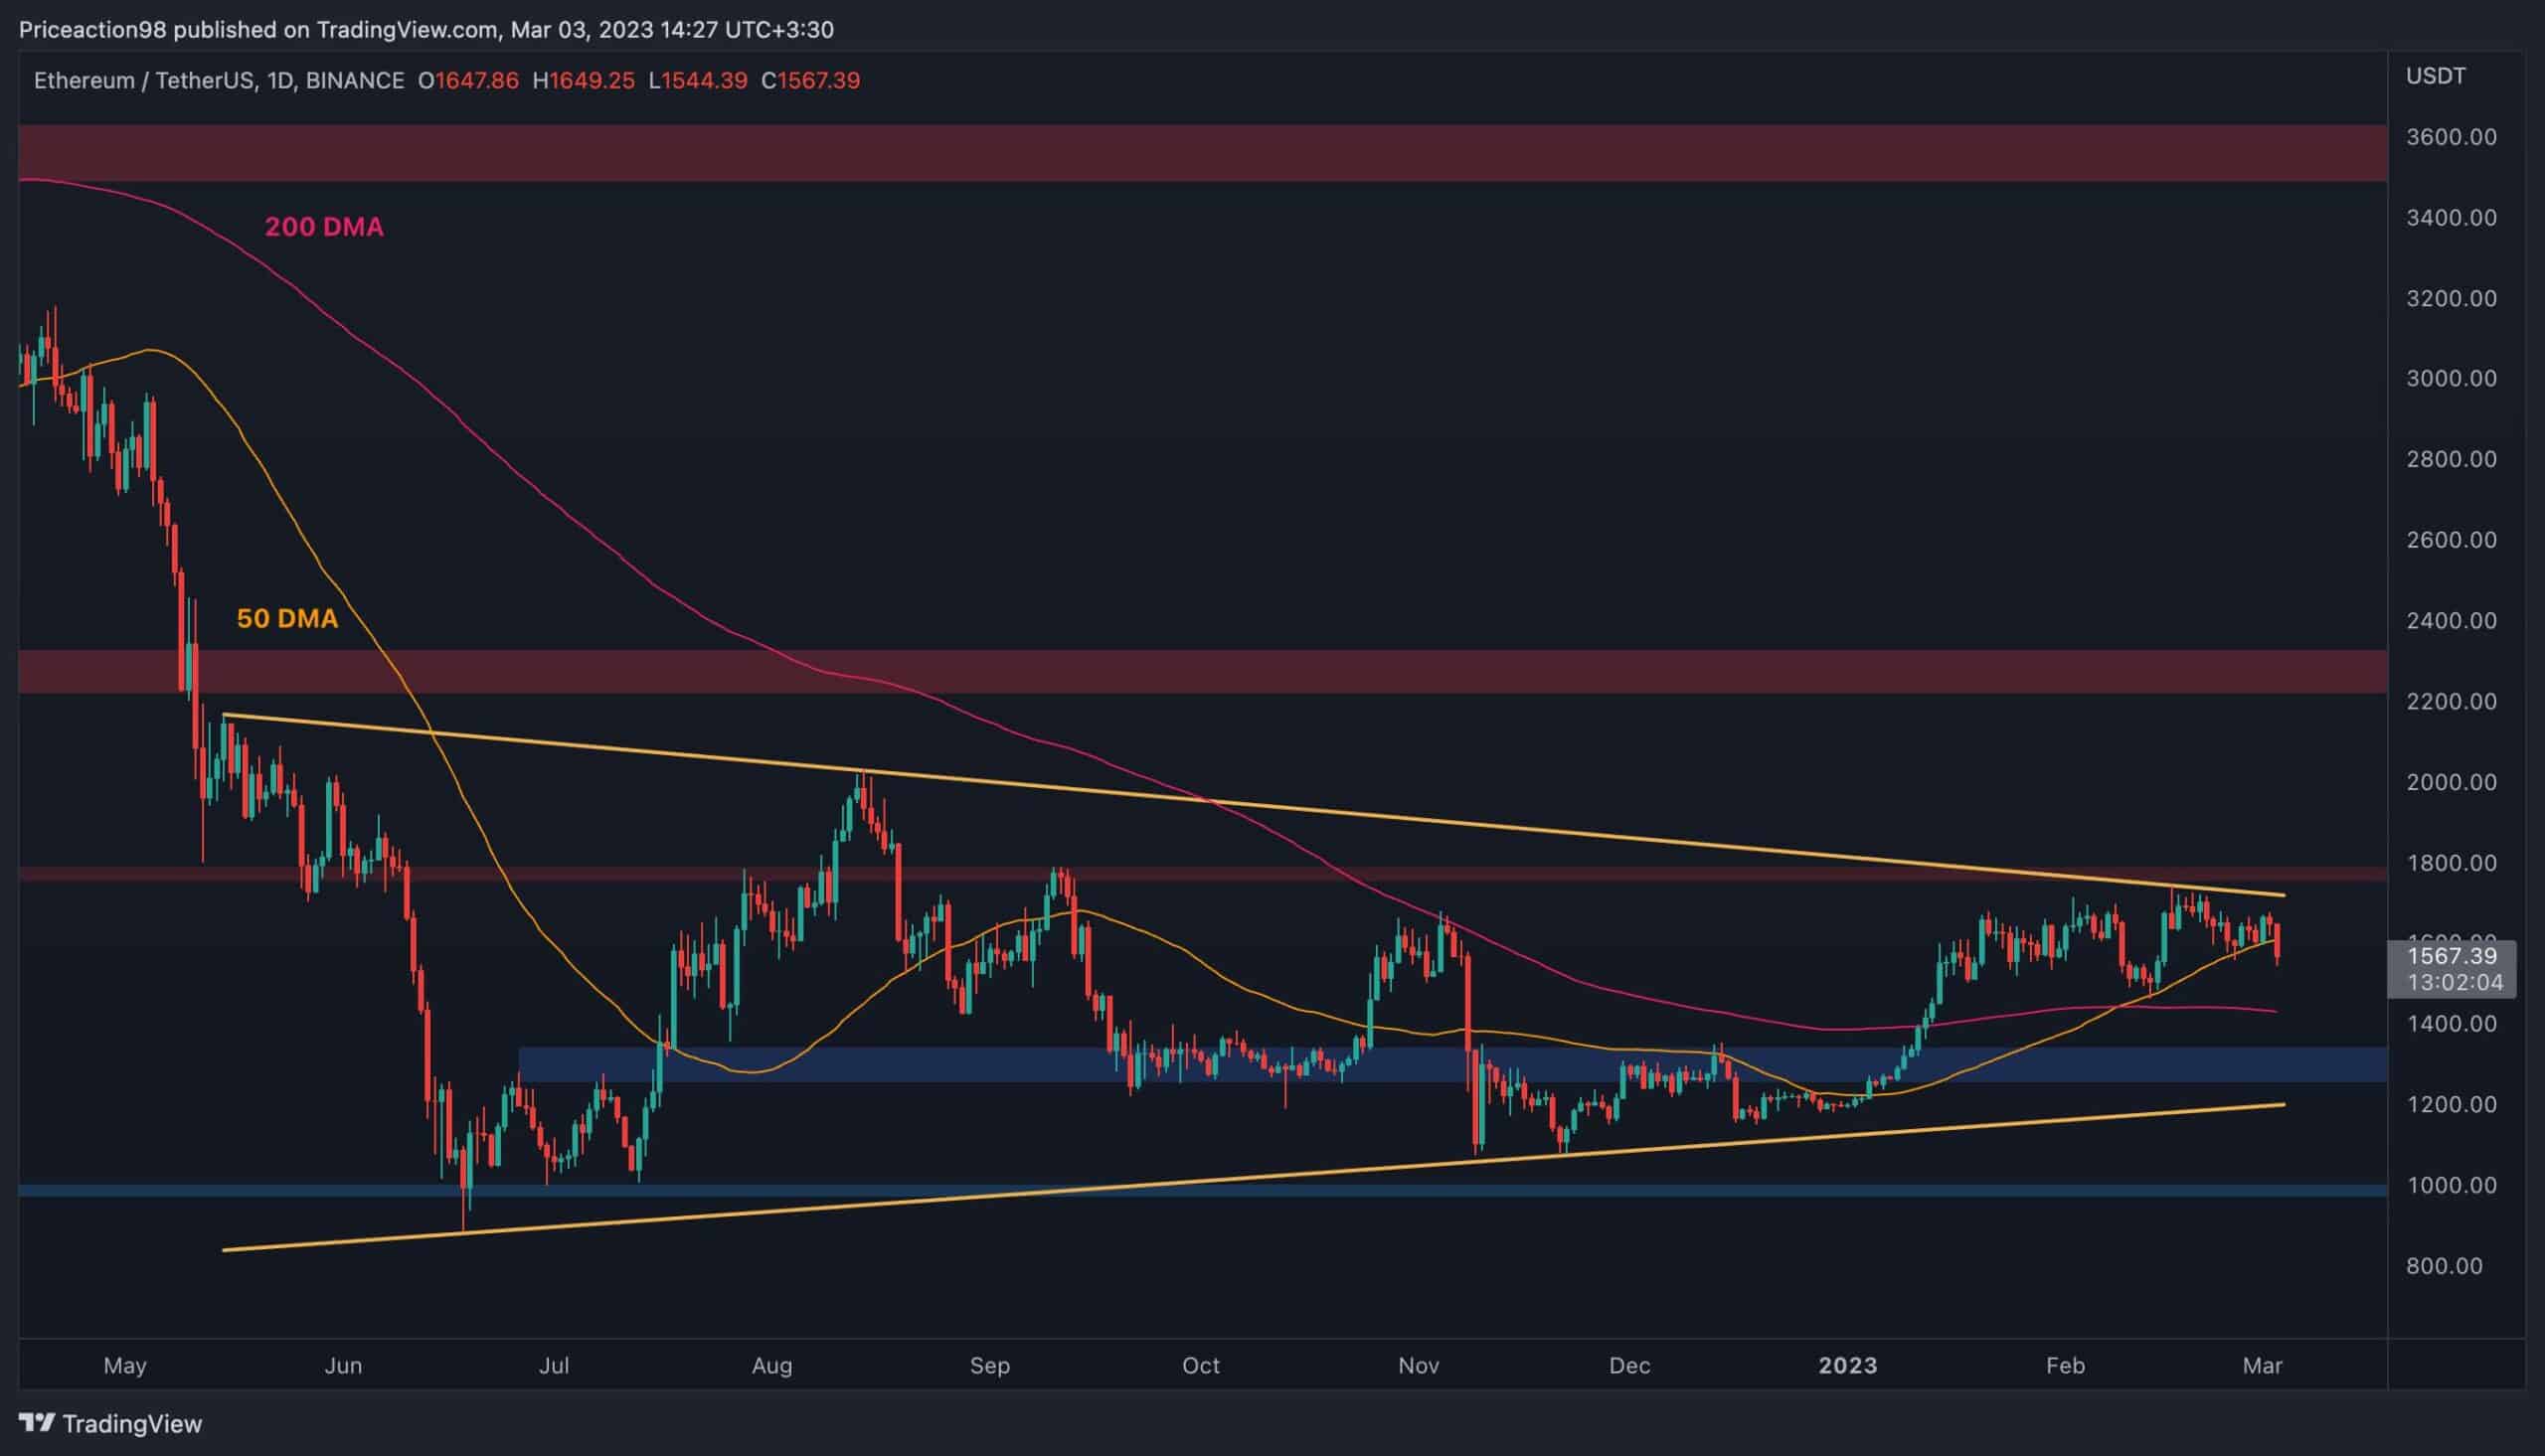
The Daily Chart
On the daily timeframe, the price has been struggling to break above the $1800 level. The higher boundary of the large symmetrical triangle pattern and a bearish rejection has led to the breakdown of the 50-day moving average located around the $1600 mark.
The 200-day moving average, located around $1400, seems like the next probable support zone, followed by $1300, which could be tested if a deeper pullback occurs.
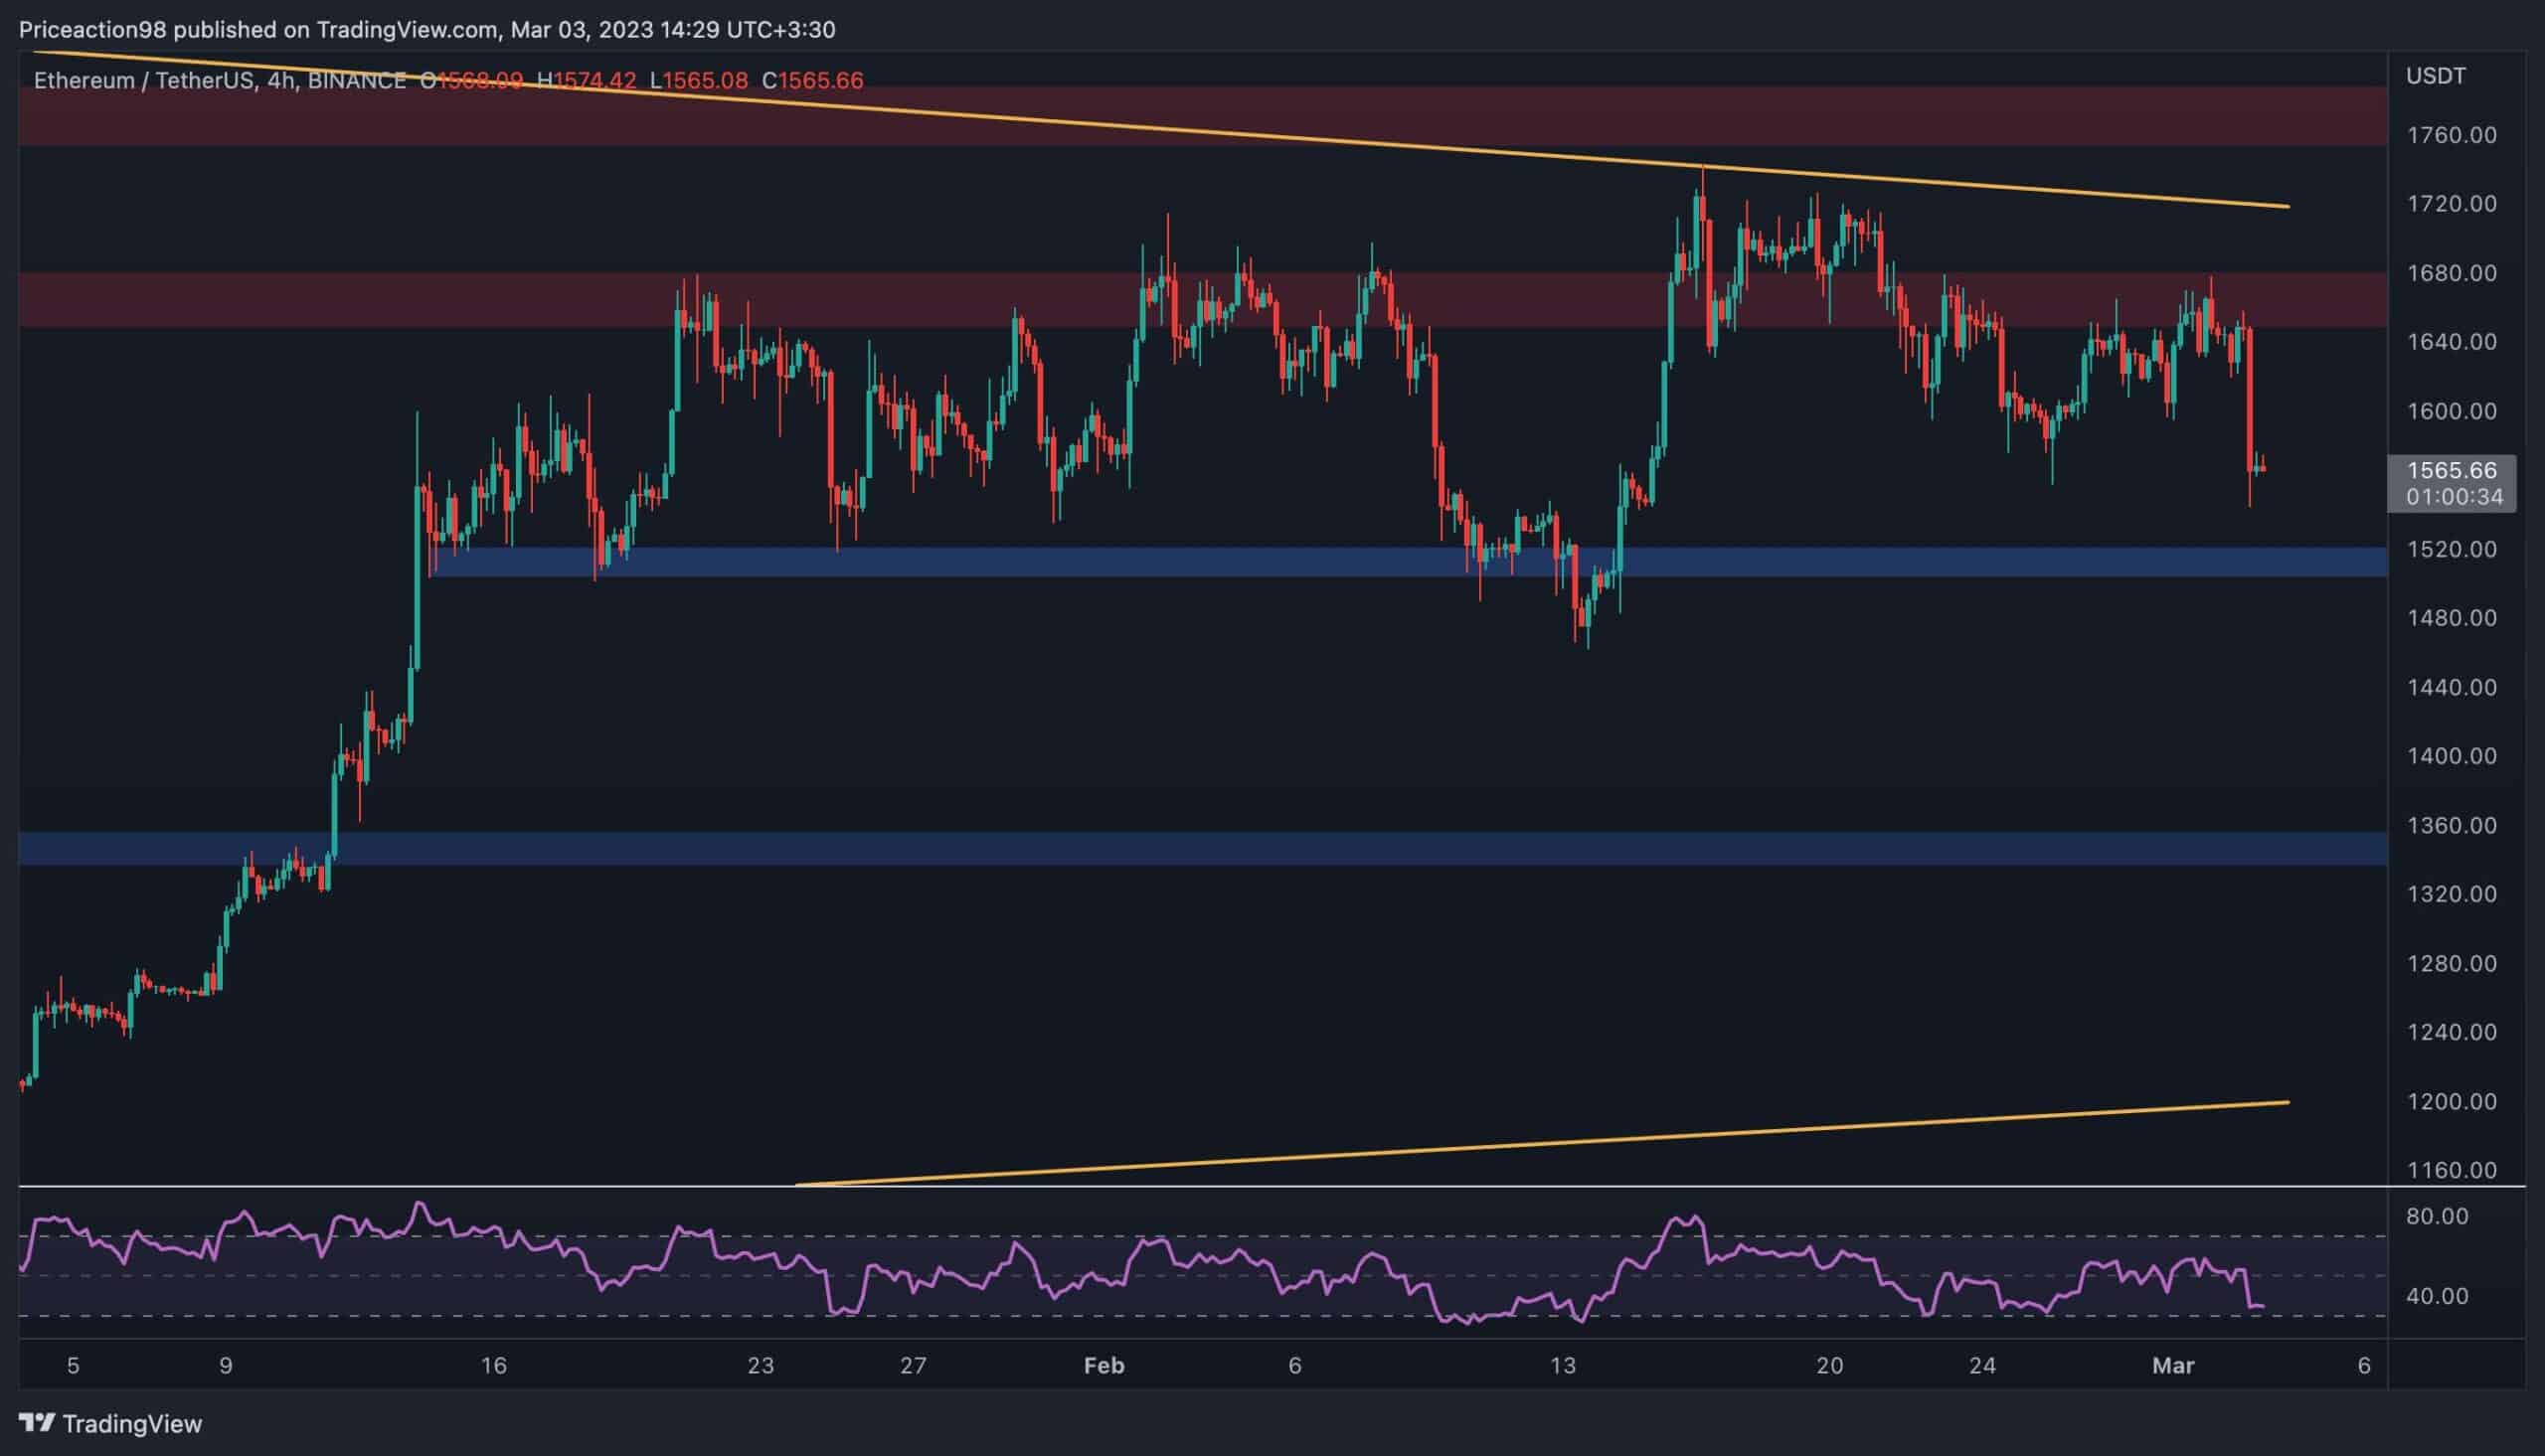
The 4-Hour Chart
On the 4-hour chart, the price has been impulsively rejected from the $1650 level and is likely to test the $1500 support level soon. If this support level holds, ETH could once more target the $1650 level and the higher boundary of the triangle pattern.
On the other hand, a breakdown of the $1500 level would likely result in a deeper drop toward the $1350 area, as no significant support level exists between these 2 levels. The RSI indicator is also showing values below 50%, which points to the bears’ dominance.
However, the RSI is approaching the oversold zone, which could lead to a consolidation or bullish pullback in the short term.
Onchain Analysis
By Shayan
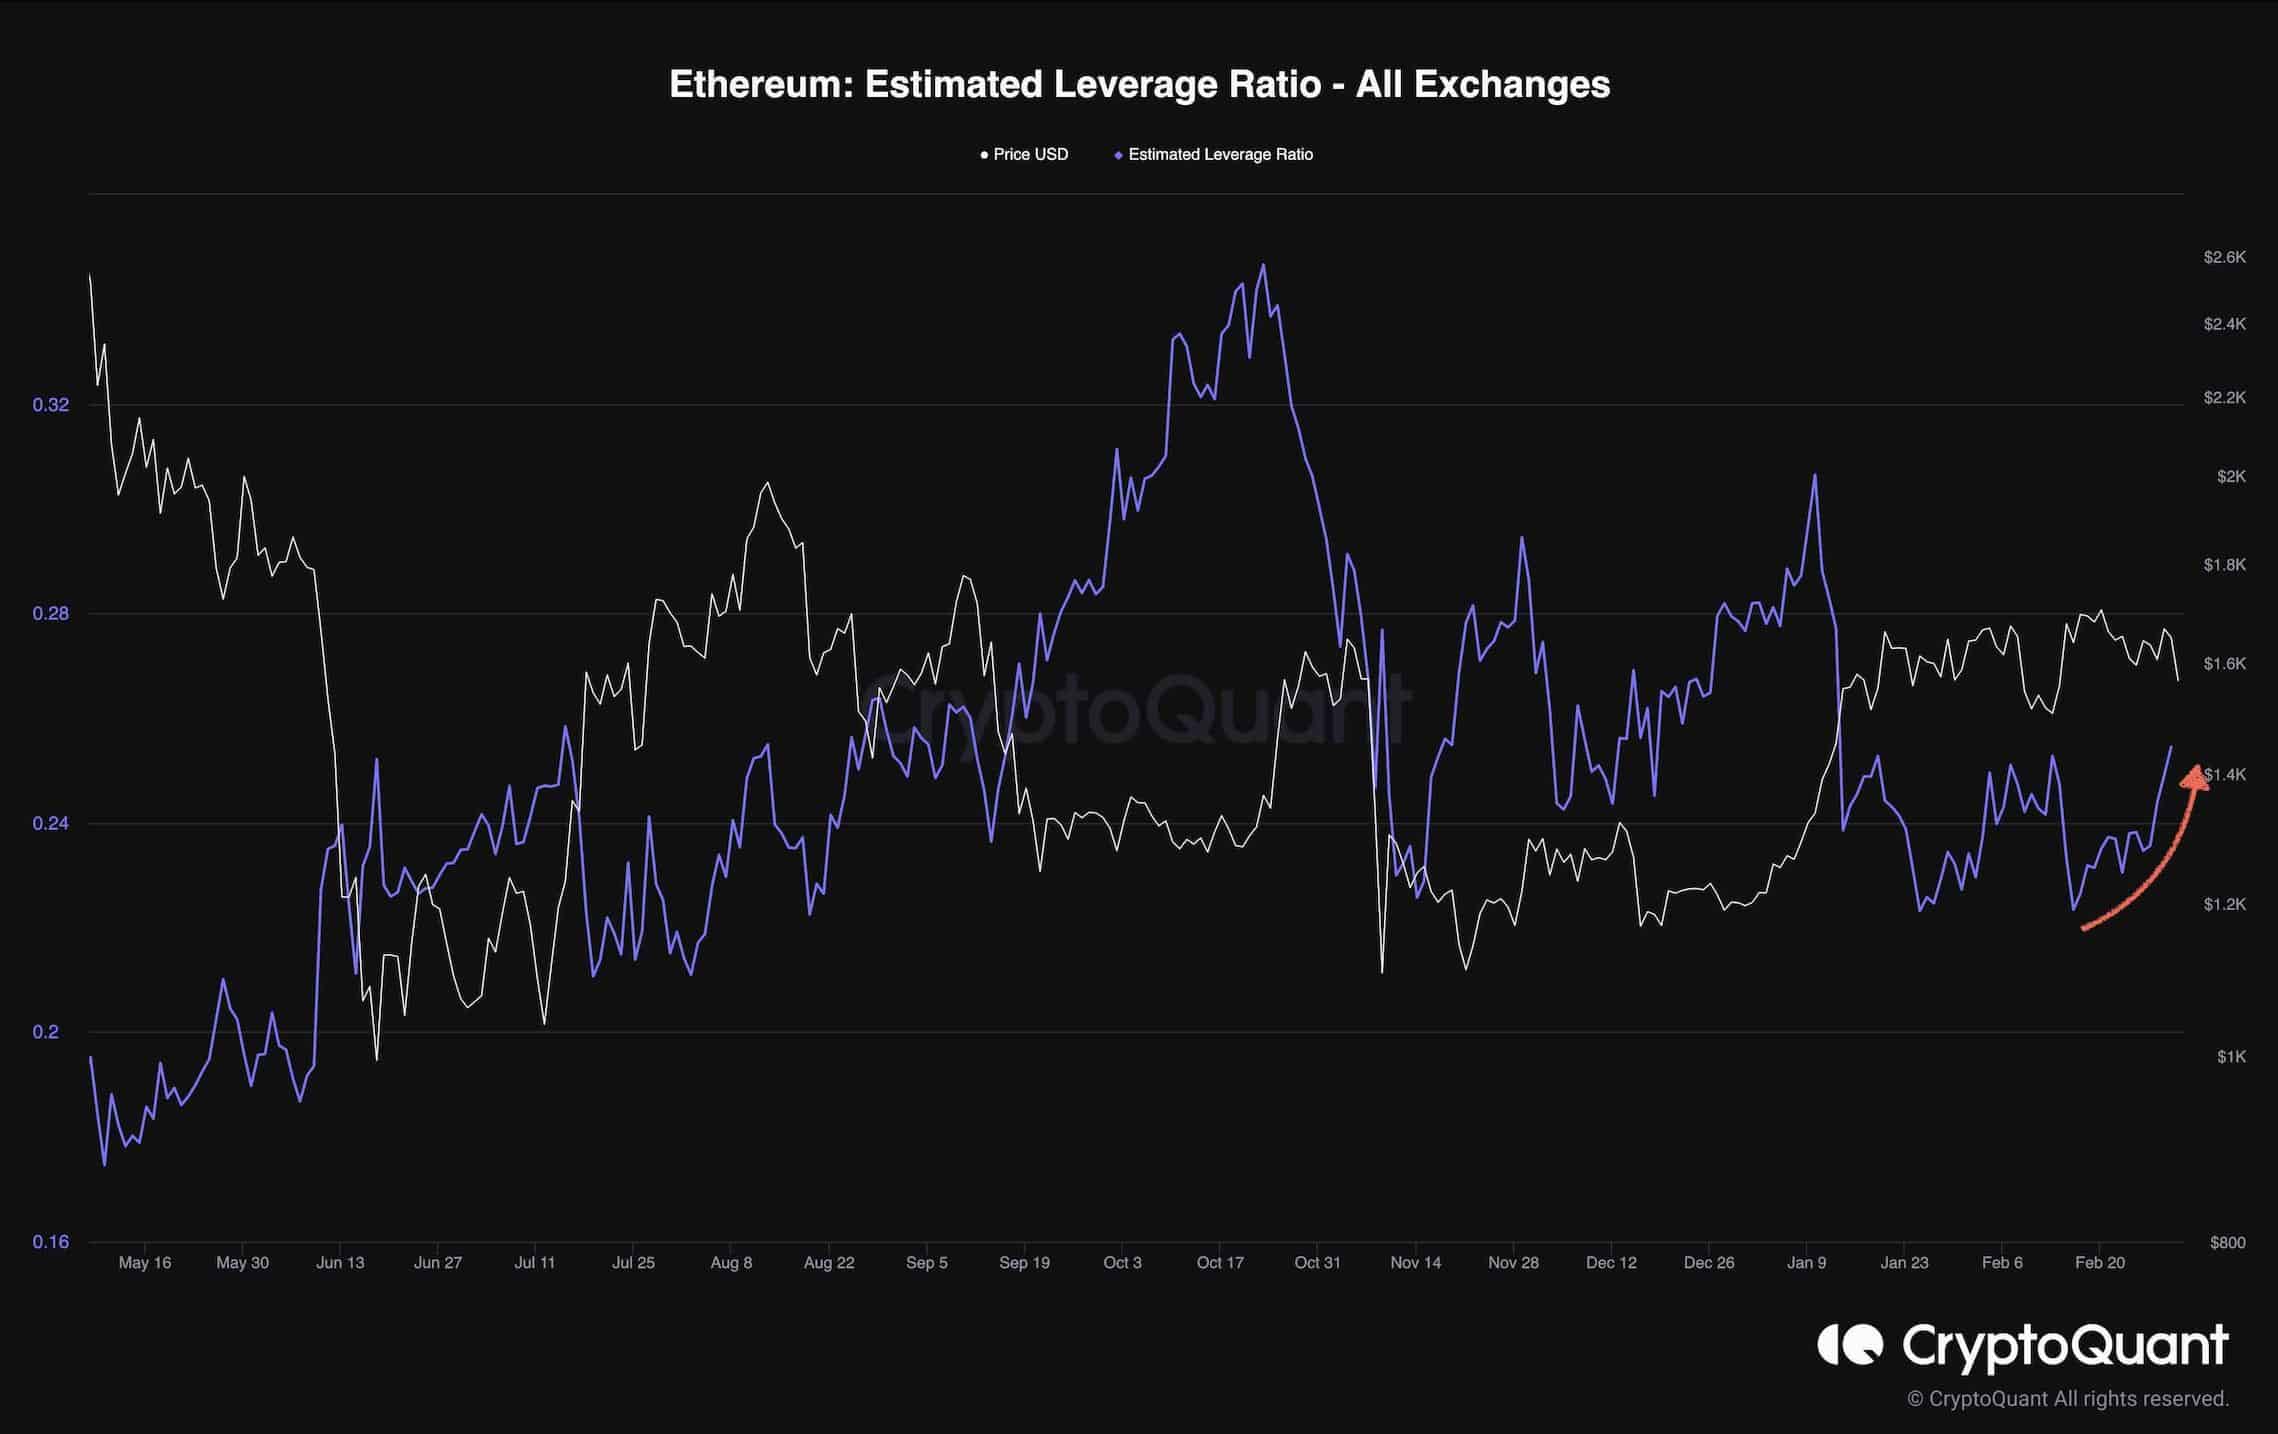
The following chart demonstrates the Estimated Leverage Ratio metric alongside ETH’s price. The metric measures the average amount of leverage used by the futures market participants. Typically, increasing values indicate that more investors are taking high-leverage risk in the derivatives market.
The Estimated Leverage Ratio has slightly increased during the last few weeks, showing that the futures market might become overheated due to the recent bullish price moves.
The metric hasn’t reached concerning levels yet, but if it continues spiking, participants should be wary due to the possibility of a short or perhaps even a long-squeeze event. In this case, a sudden impulsive move will occur in Ethereum’s price.
In conclusion, the metric’s behavior should be monitored in the upcoming weeks to prevent further losses.