Ethereum’s price has gradually declined over the past few weeks after being rejected from the psychological resistance level of ,000 once more. However, there is a considerable chance to initiate a new bullish leg in the short term. Technical Analysis By: Edris The Daily Chart: On the daily timeframe, the price has recently demonstrated bearish price action. The 50-day moving average, located around the ,900 mark, was broken to the downside after holding the mark for a few weeks. The 200-day moving average, trending around the ,800 area, and the ,750 support level are likely targets for the market to reach in the coming days. Yet, a rebound from these support elements seems likely, leading to another run toward the ,000 mark and even higher. Source:
Topics:
CryptoVizArt considers the following as important: ETH Analysis, ETHBTC, Ethereum (ETH) Price, ethusd
This could be interesting, too:
Mandy Williams writes Ethereum Derivatives Metrics Signal Modest Downside Tail Risk Ahead: Nansen
Jordan Lyanchev writes Weekly Bitcoin, Ethereum ETF Recap: Light at the End of the Tunnel for BTC
CryptoVizArt writes Will Weak Momentum Drive ETH to .5K? (Ethereum Price Analysis)
Jordan Lyanchev writes Bybit Hack Fallout: Arthur Hayes, Samson Mow Push for Ethereum Rollback
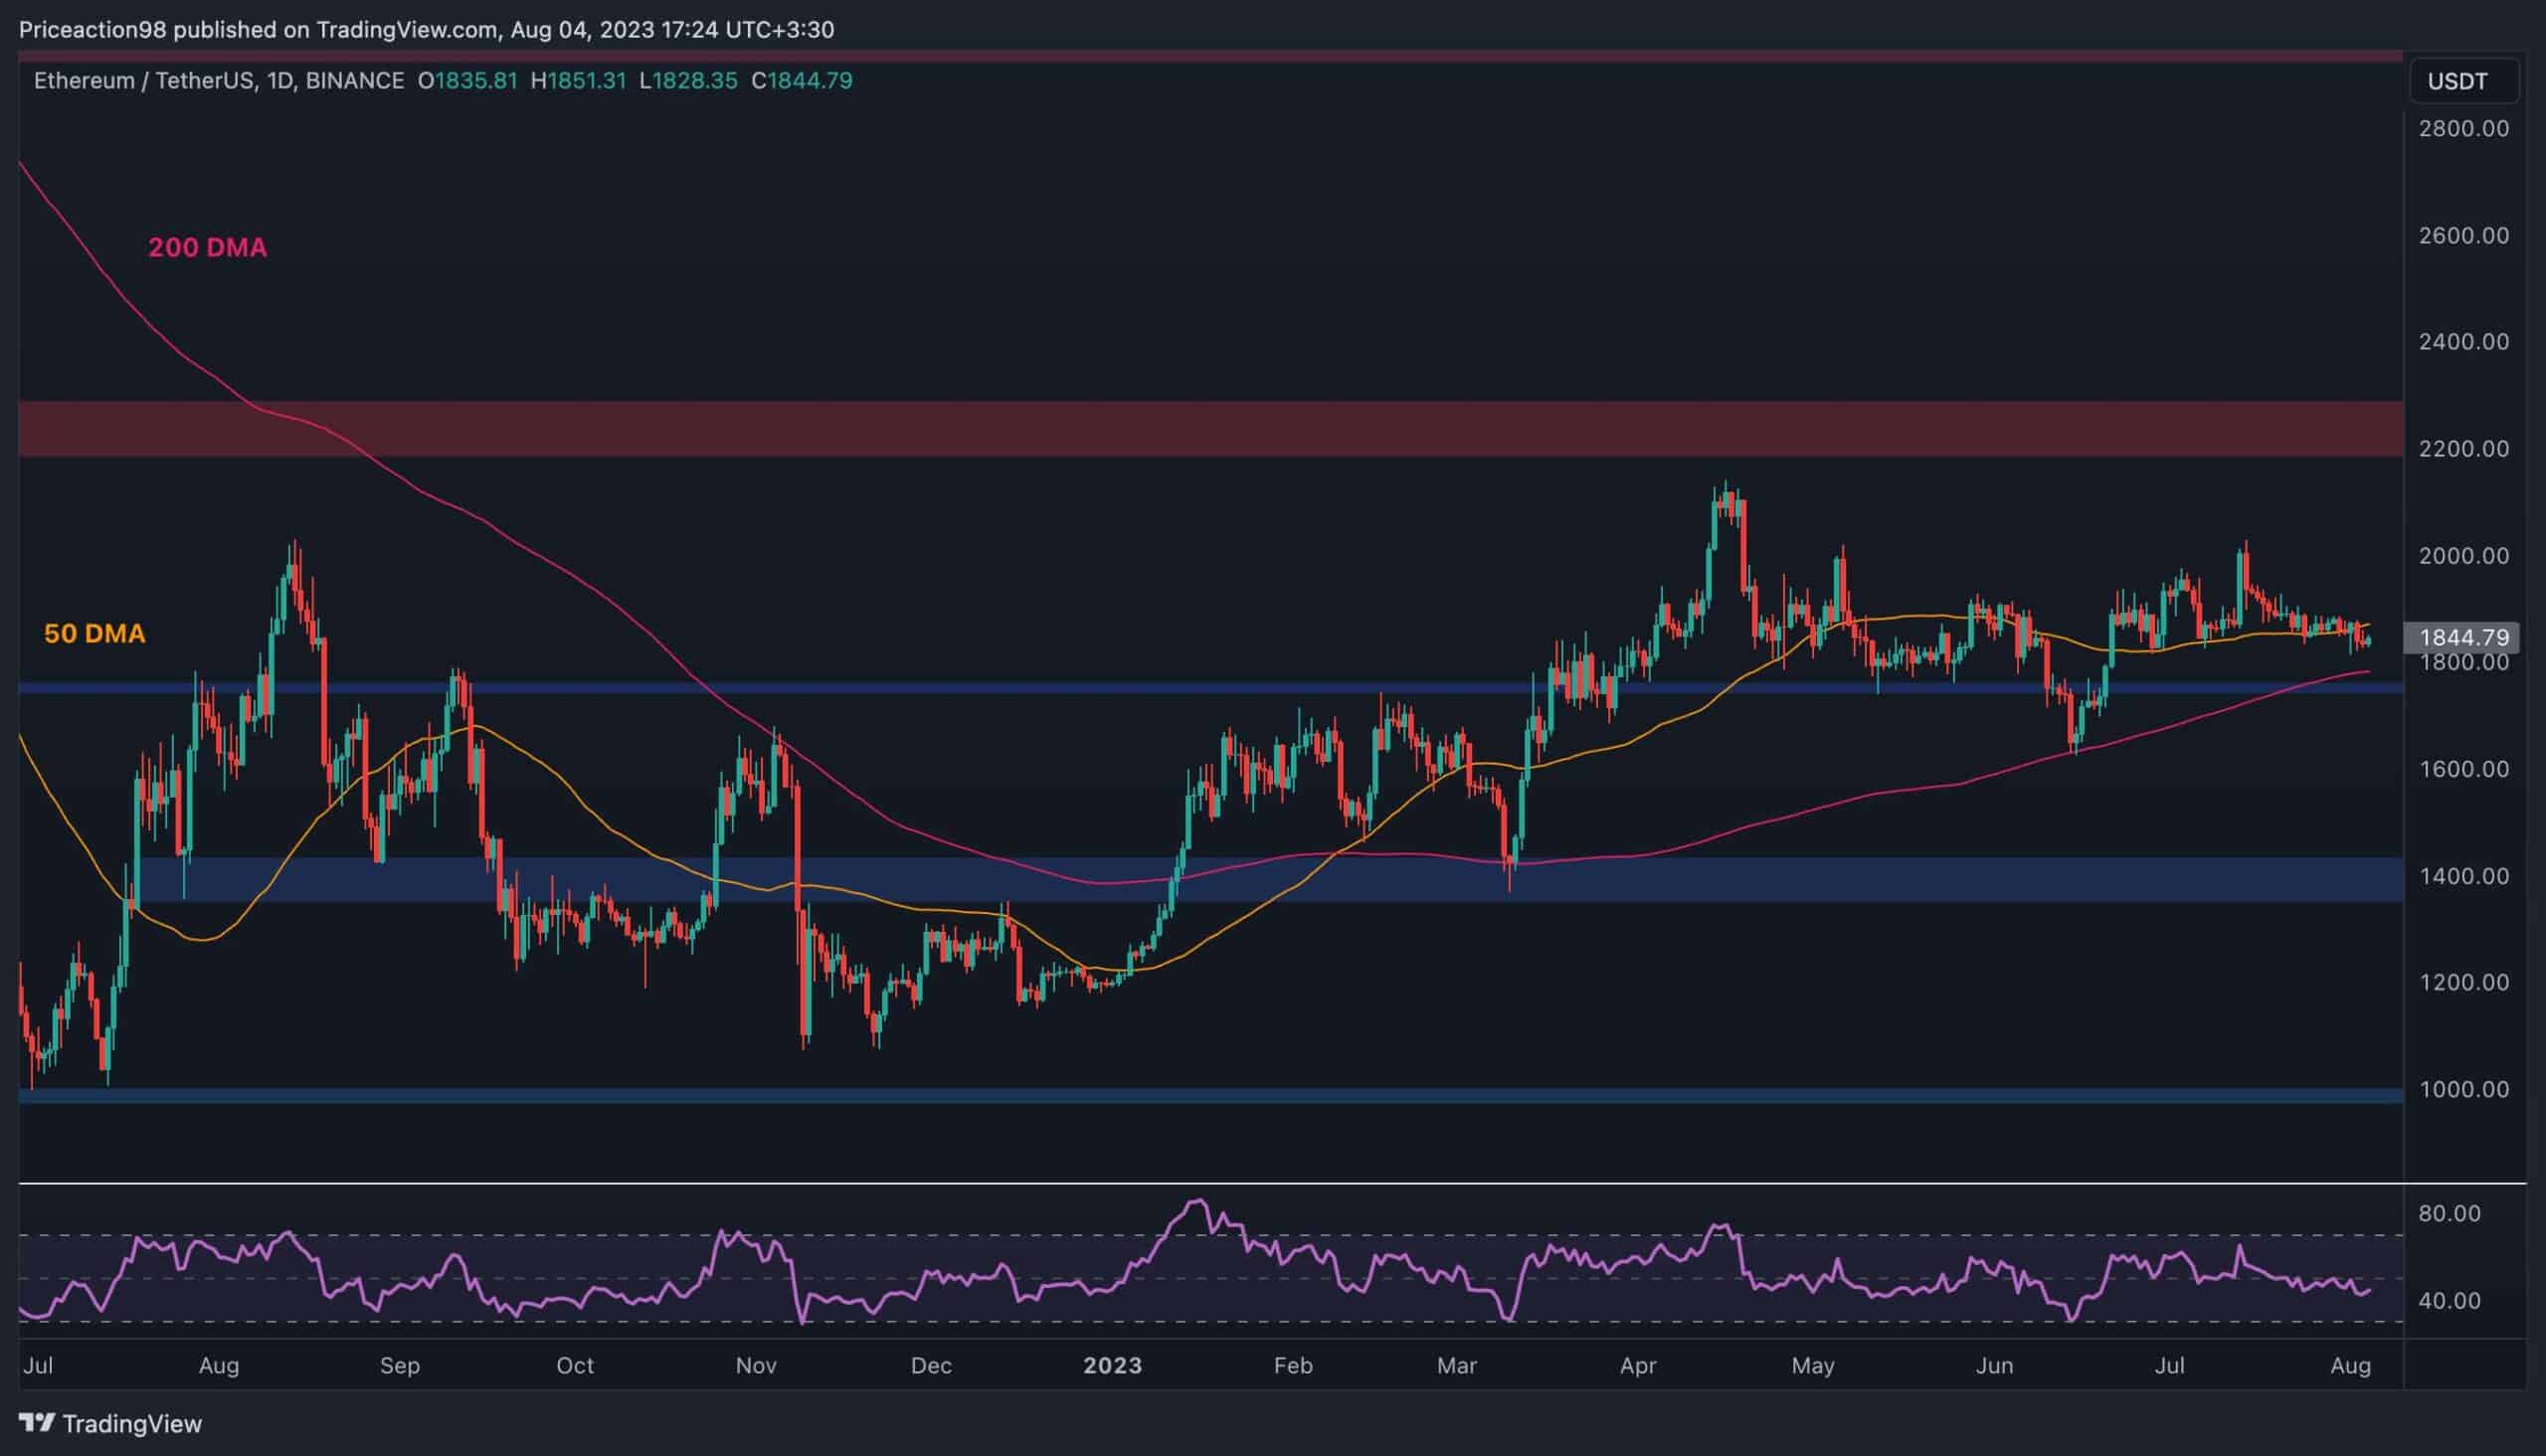
Ethereum’s price has gradually declined over the past few weeks after being rejected from the psychological resistance level of $2,000 once more. However, there is a considerable chance to initiate a new bullish leg in the short term.
Technical Analysis
By: Edris
The Daily Chart:
On the daily timeframe, the price has recently demonstrated bearish price action. The 50-day moving average, located around the $1,900 mark, was broken to the downside after holding the mark for a few weeks.
The 200-day moving average, trending around the $1,800 area, and the $1,750 support level are likely targets for the market to reach in the coming days. Yet, a rebound from these support elements seems likely, leading to another run toward the $2,000 mark and even higher.
The 4-Hour Chart:
Looking at the 4-hour chart, the price has failed to hold above the $1,930 level and is currently testing the $1,830 support zone. If this level holds, the market is likely to rally toward the $2,000 level once more, with a high likelihood of finally breaking through it.
On the other hand, a breakdown of the $1,830 level would likely result in a further decline toward the $1,750 level in the coming days.

Sentiment Analysis
By: Edris
Ethereum Taker Buy Sell Ratio
Over the past few weeks, Ethereum’s price has been oscillating in a very tight range, leaving investors wondering about the direction of the next move. In this situation, analyzing the futures market sentiment might provide valuable insight.
This chart shows the taker buy-sell ratio, which indicates whether long or short traders are more aggressive. Values above 1 are considered bullish, while values below 1 indicate aggressive selling pressure on aggregate.
As the chart depicts, this metric has been constantly dropping lower below 1, showing little intent to recover. This selling pressure in the futures market is probably offsetting the spot market demand, leading to range-bound price action.
Therefore, investors should look forward to the taker buy-sell ratio rising above 1, which could potentially result in a new higher high in the short term.
