Ethereum’s price has encountered a significant obstacle at the critical .4K resistance, leading to an extended consolidation phase within this pivotal range. This situation and the bullish sentiment in the futures market have heightened expectations for a potential bullish breakout. By Shayan Ethereum Price Analysis: The Daily Chart A detailed examination of Ethereum’s daily chart reveals an ascending consolidation period, with the price approaching a substantial resistance at .4K. This zone includes the static .4K resistance and aligns with the upper boundary of a multi-month wedge pattern, forming a robust barrier. Despite this, ETH is displaying bullish momentum, attempting to break above this crucial range. A successful breach could see the price reclaim the
Topics:
CryptoVizArt considers the following as important: ETH Analysis, ETHBTC, Ethereum (ETH) Price, ethusd
This could be interesting, too:
Mandy Williams writes Ethereum Derivatives Metrics Signal Modest Downside Tail Risk Ahead: Nansen
Jordan Lyanchev writes Weekly Bitcoin, Ethereum ETF Recap: Light at the End of the Tunnel for BTC
CryptoVizArt writes Will Weak Momentum Drive ETH to .5K? (Ethereum Price Analysis)
Jordan Lyanchev writes Bybit Hack Fallout: Arthur Hayes, Samson Mow Push for Ethereum Rollback
Ethereum’s price has encountered a significant obstacle at the critical $2.4K resistance, leading to an extended consolidation phase within this pivotal range.
This situation and the bullish sentiment in the futures market have heightened expectations for a potential bullish breakout.
By Shayan
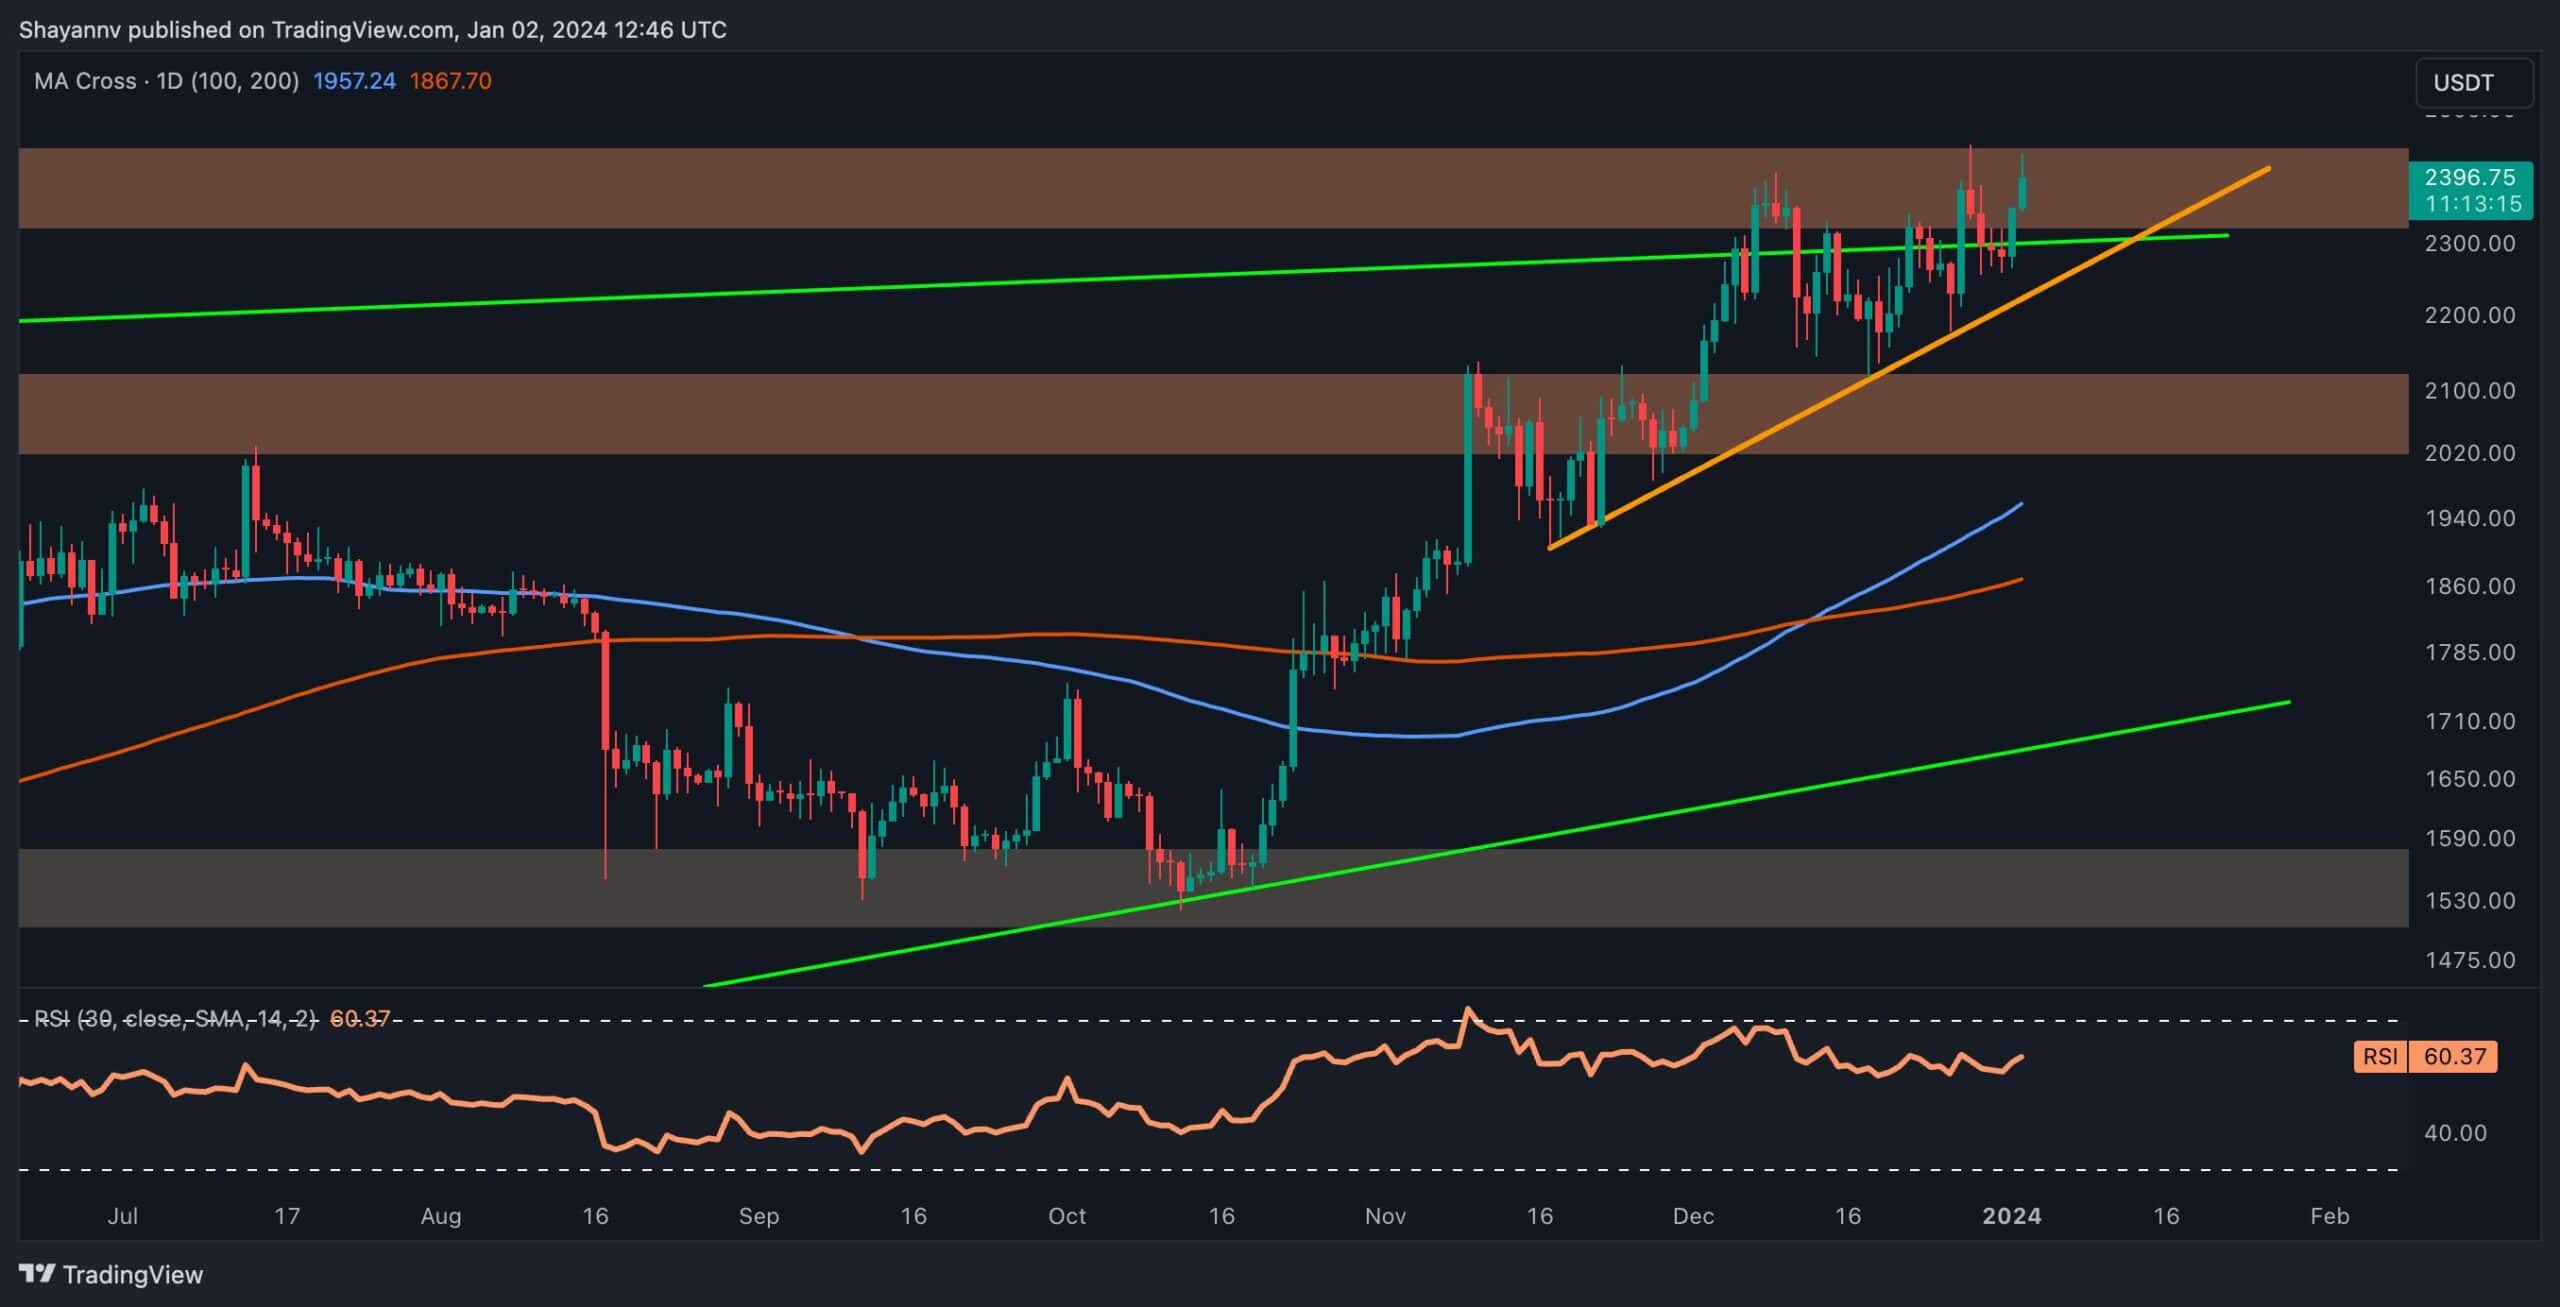
Ethereum Price Analysis: The Daily Chart
A detailed examination of Ethereum’s daily chart reveals an ascending consolidation period, with the price approaching a substantial resistance at $2.4K. This zone includes the static $2.4K resistance and aligns with the upper boundary of a multi-month wedge pattern, forming a robust barrier. Despite this, ETH is displaying bullish momentum, attempting to break above this crucial range. A successful breach could see the price reclaim the $2.4K resistance, setting the stage for a renewed bullish surge.
However, considering the bearish divergence between the price and the RSI indicator, there is still a possibility of a bearish reversal.
Despite the overall bullish market conditions, a sudden rejection may lead to a sustained cascade towards the 100-day and 200-day moving averages. Therefore, caution is advised during these market conditions, given the potential for sudden impulsive movements.
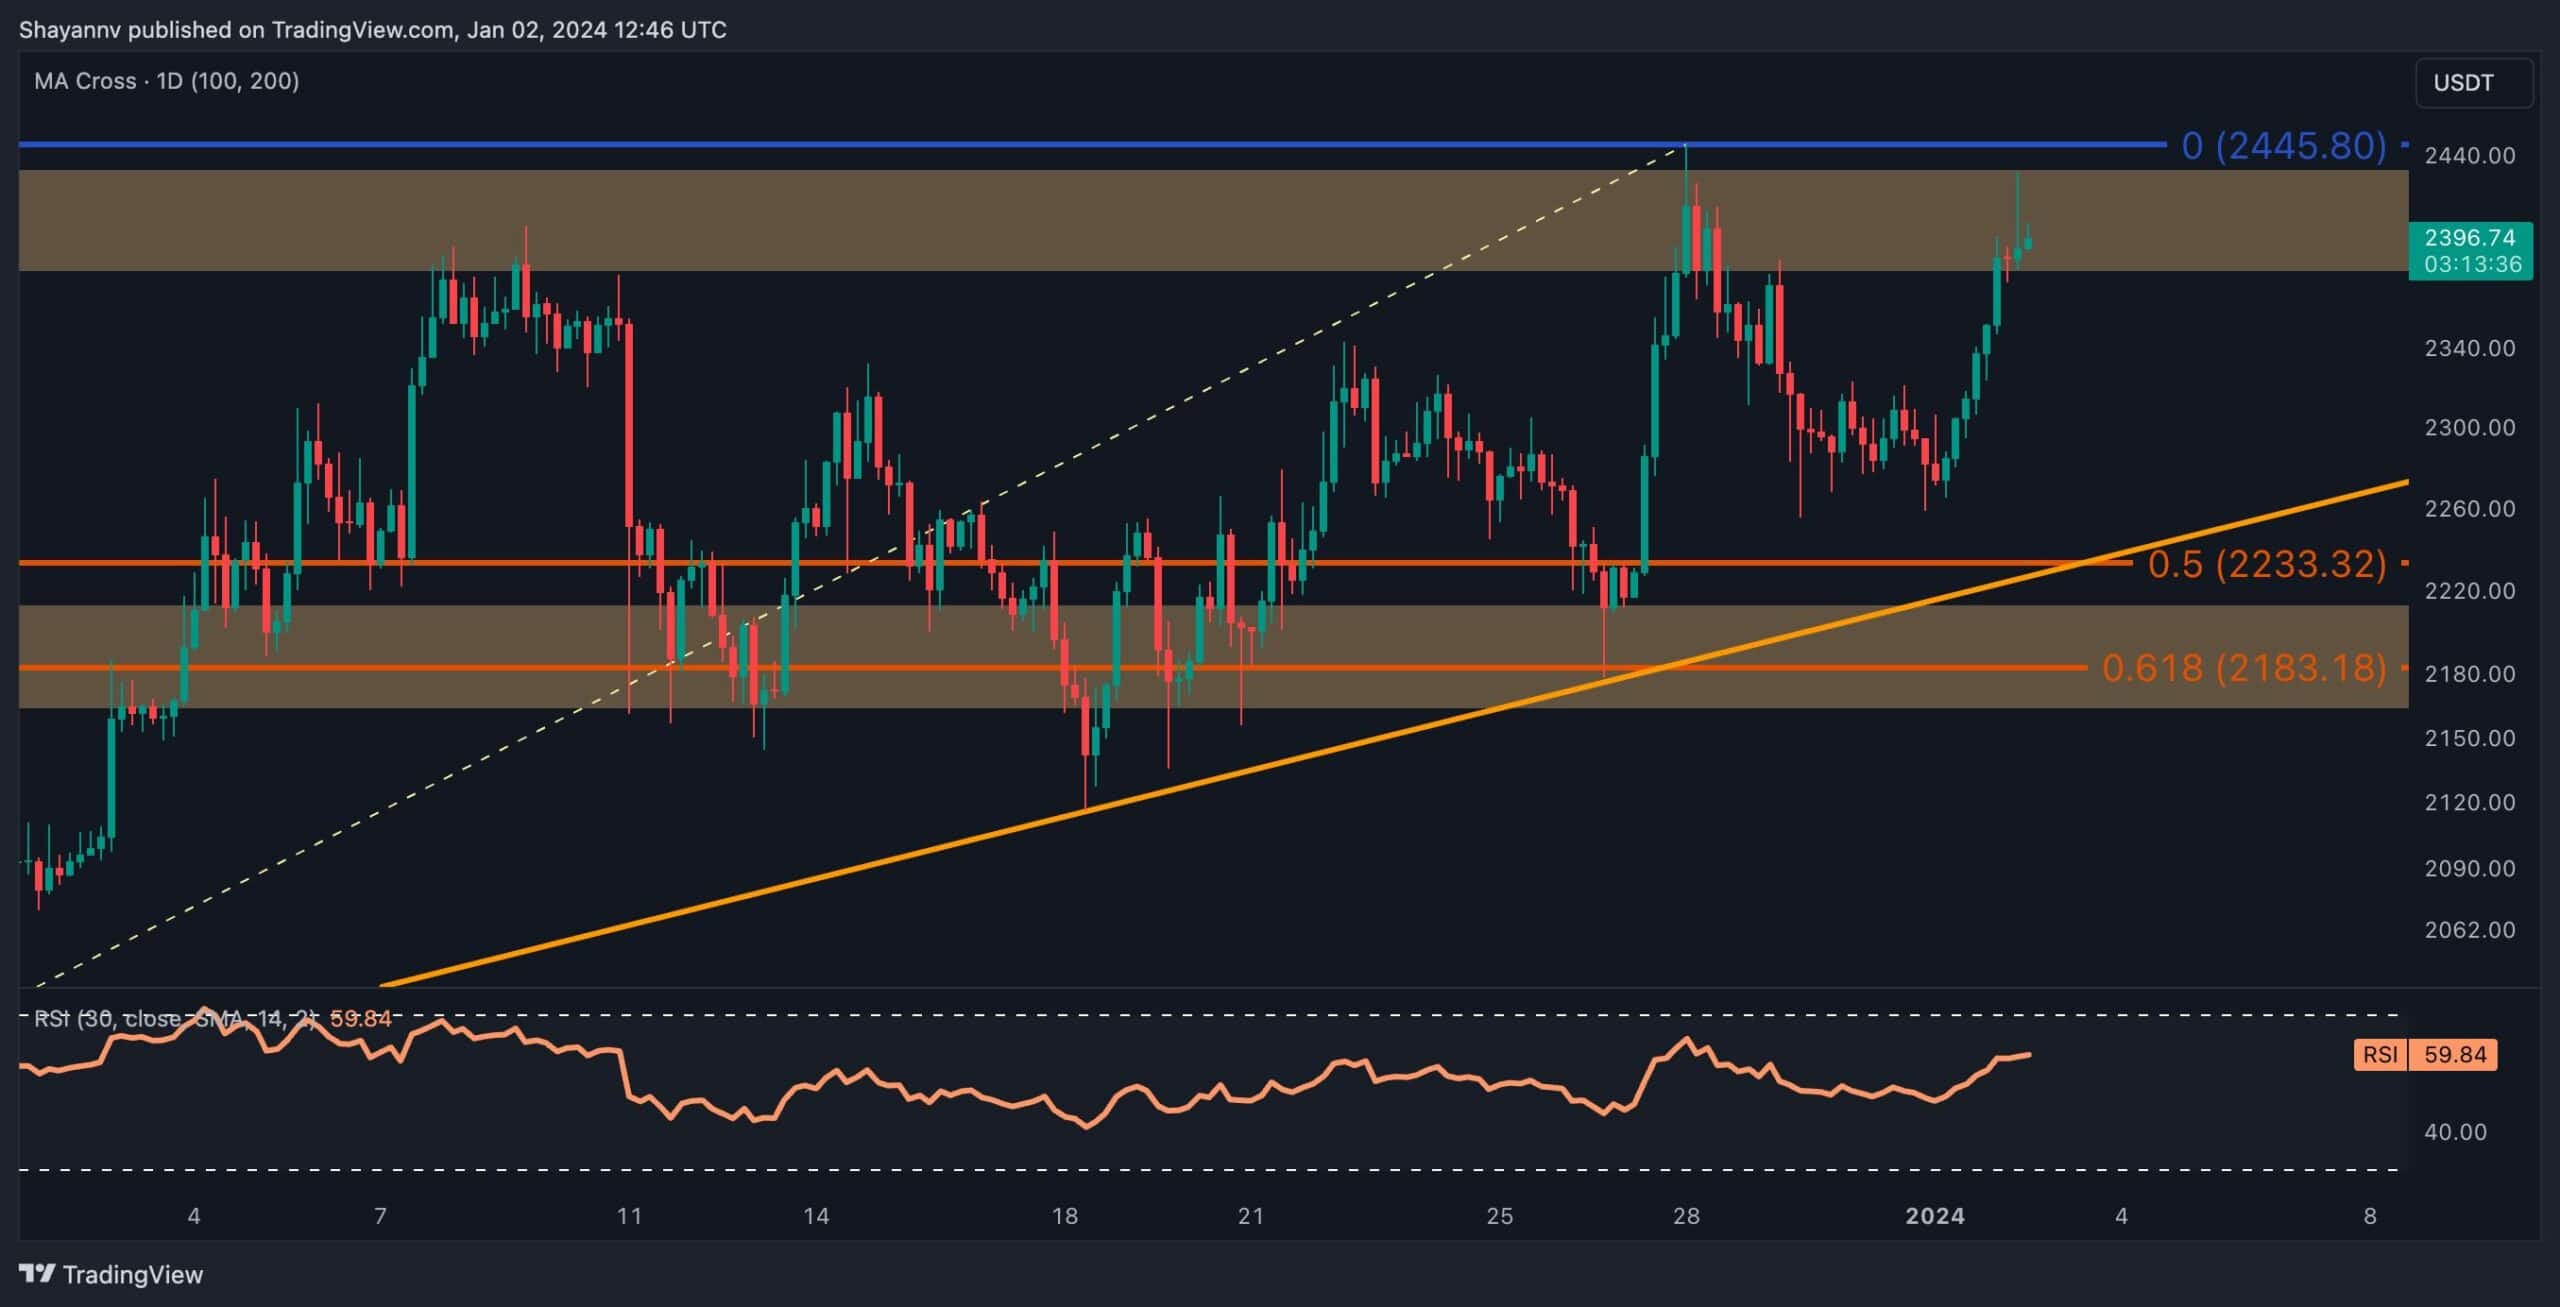
The 4-Hour Chart
Examining the 4-hour chart, Ethereum appears to be confined within a critical range, bordered by the substantial support at $2.1K and the significant resistance at $2.4K, resulting in sideways consolidation. Notably, the $2.1K level aligns with the crucial range between the 0.5 and 0.618 levels of the Fibonacci retracement, acting as a notable barrier against sellers.
Despite this consolidation, the price has recently surged, reaching its prior major high near the $2440 mark. However, the outcome hinges on whether buyers can reclaim the $2.4K resistance. If successful, an ascending trend is likely. Conversely, a rejection could lead to a market decline towards the lower threshold of the range.
By Shayan
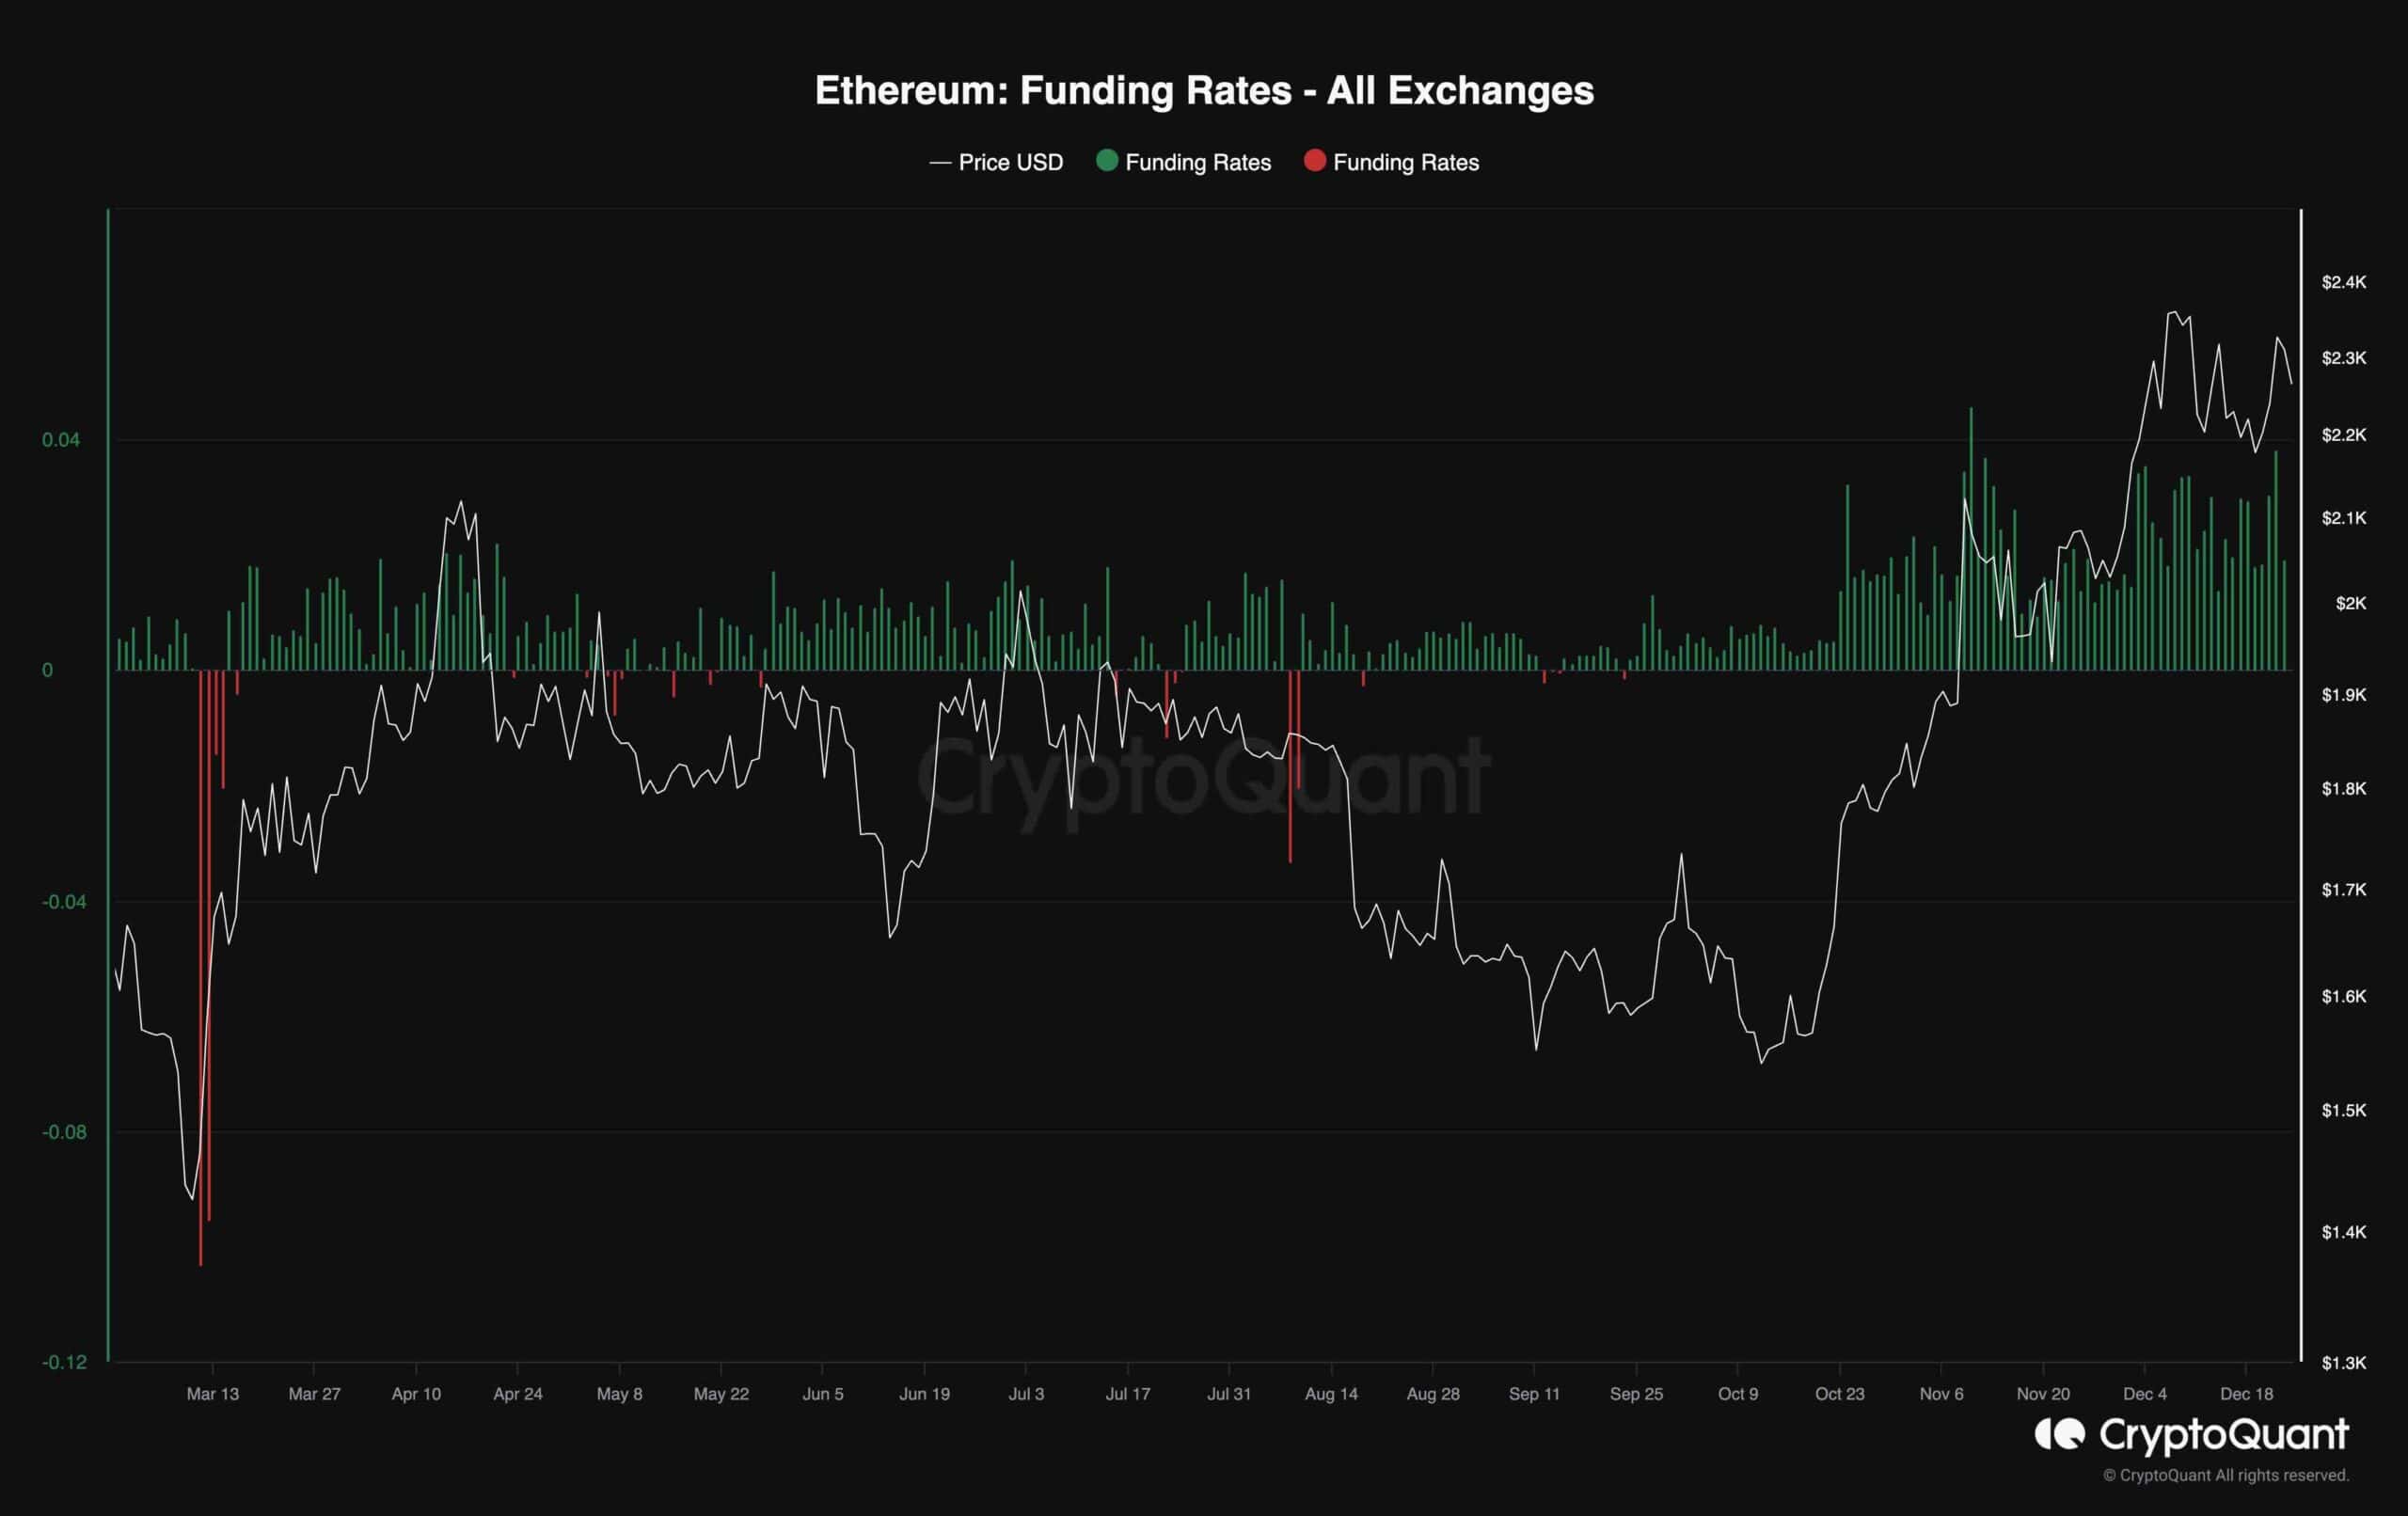
Ethereum’s recent price performance has been notably bullish, bringing the market close to the $2.4 resistance region. However, a recent shift into a prolonged consolidation phase has raised questions among market participants about whether this marks the end of the mid-term bullish phase or is simply a correction.
Examining the sentiment in the futures market becomes crucial to address this uncertainty. The provided chart illustrates funding rates, a valuable metric indicating the sentiment in the futures market by showing whether buyers or short-sellers are executing orders more aggressively. Positive values generally indicate a bullish sentiment, while negative values suggest pessimism among futures traders.
Notably, the funding rates have consistently been positive, with recent trends showing an upward trajectory, signaling heightened bullish sentiment in the perpetual markets and fostering expectations for a bullish breakout. However, caution is advised, as excessively high funding rates could be interpreted as a bearish signal.
This scenario suggests the market might be on the verge of a long liquidation cascade. If such liquidations occur, the price is likely to experience a rapid decline toward the 200 and 100-day moving averages. Monitoring these metrics becomes crucial for anticipating potential shifts in market dynamics and adjusting strategies accordingly.