Ethereum has recently surged with notable momentum, signaling a bullish uptrend. This increase has seen the price reclaim a critical resistance level, reflecting strong buyer confidence and market participant optimism. By Shayan The Daily Chart A thorough analysis of Ethereum’s daily chart reveals a significant shift in market sentiment, characterized by an impulsive uptrend and heightened bullish momentum. Accordingly, the price has approached a crucial multi-year resistance zone – the psychological barrier at .9K and successfully surpassed it. This indicates a prevailing bullish sentiment among market participants, with buyers dominating the market. The trend appears sustainable, with eyes set on surpassing the major yearly swing high at .6K. However, it’s worth
Topics:
CryptoVizArt considers the following as important: ETH Analysis, ETHBTC, Ethereum (ETH) Price, ethusd
This could be interesting, too:
Mandy Williams writes Ethereum Derivatives Metrics Signal Modest Downside Tail Risk Ahead: Nansen
Jordan Lyanchev writes Weekly Bitcoin, Ethereum ETF Recap: Light at the End of the Tunnel for BTC
CryptoVizArt writes Will Weak Momentum Drive ETH to .5K? (Ethereum Price Analysis)
Jordan Lyanchev writes Bybit Hack Fallout: Arthur Hayes, Samson Mow Push for Ethereum Rollback
Ethereum has recently surged with notable momentum, signaling a bullish uptrend.
This increase has seen the price reclaim a critical resistance level, reflecting strong buyer confidence and market participant optimism.
By Shayan
The Daily Chart
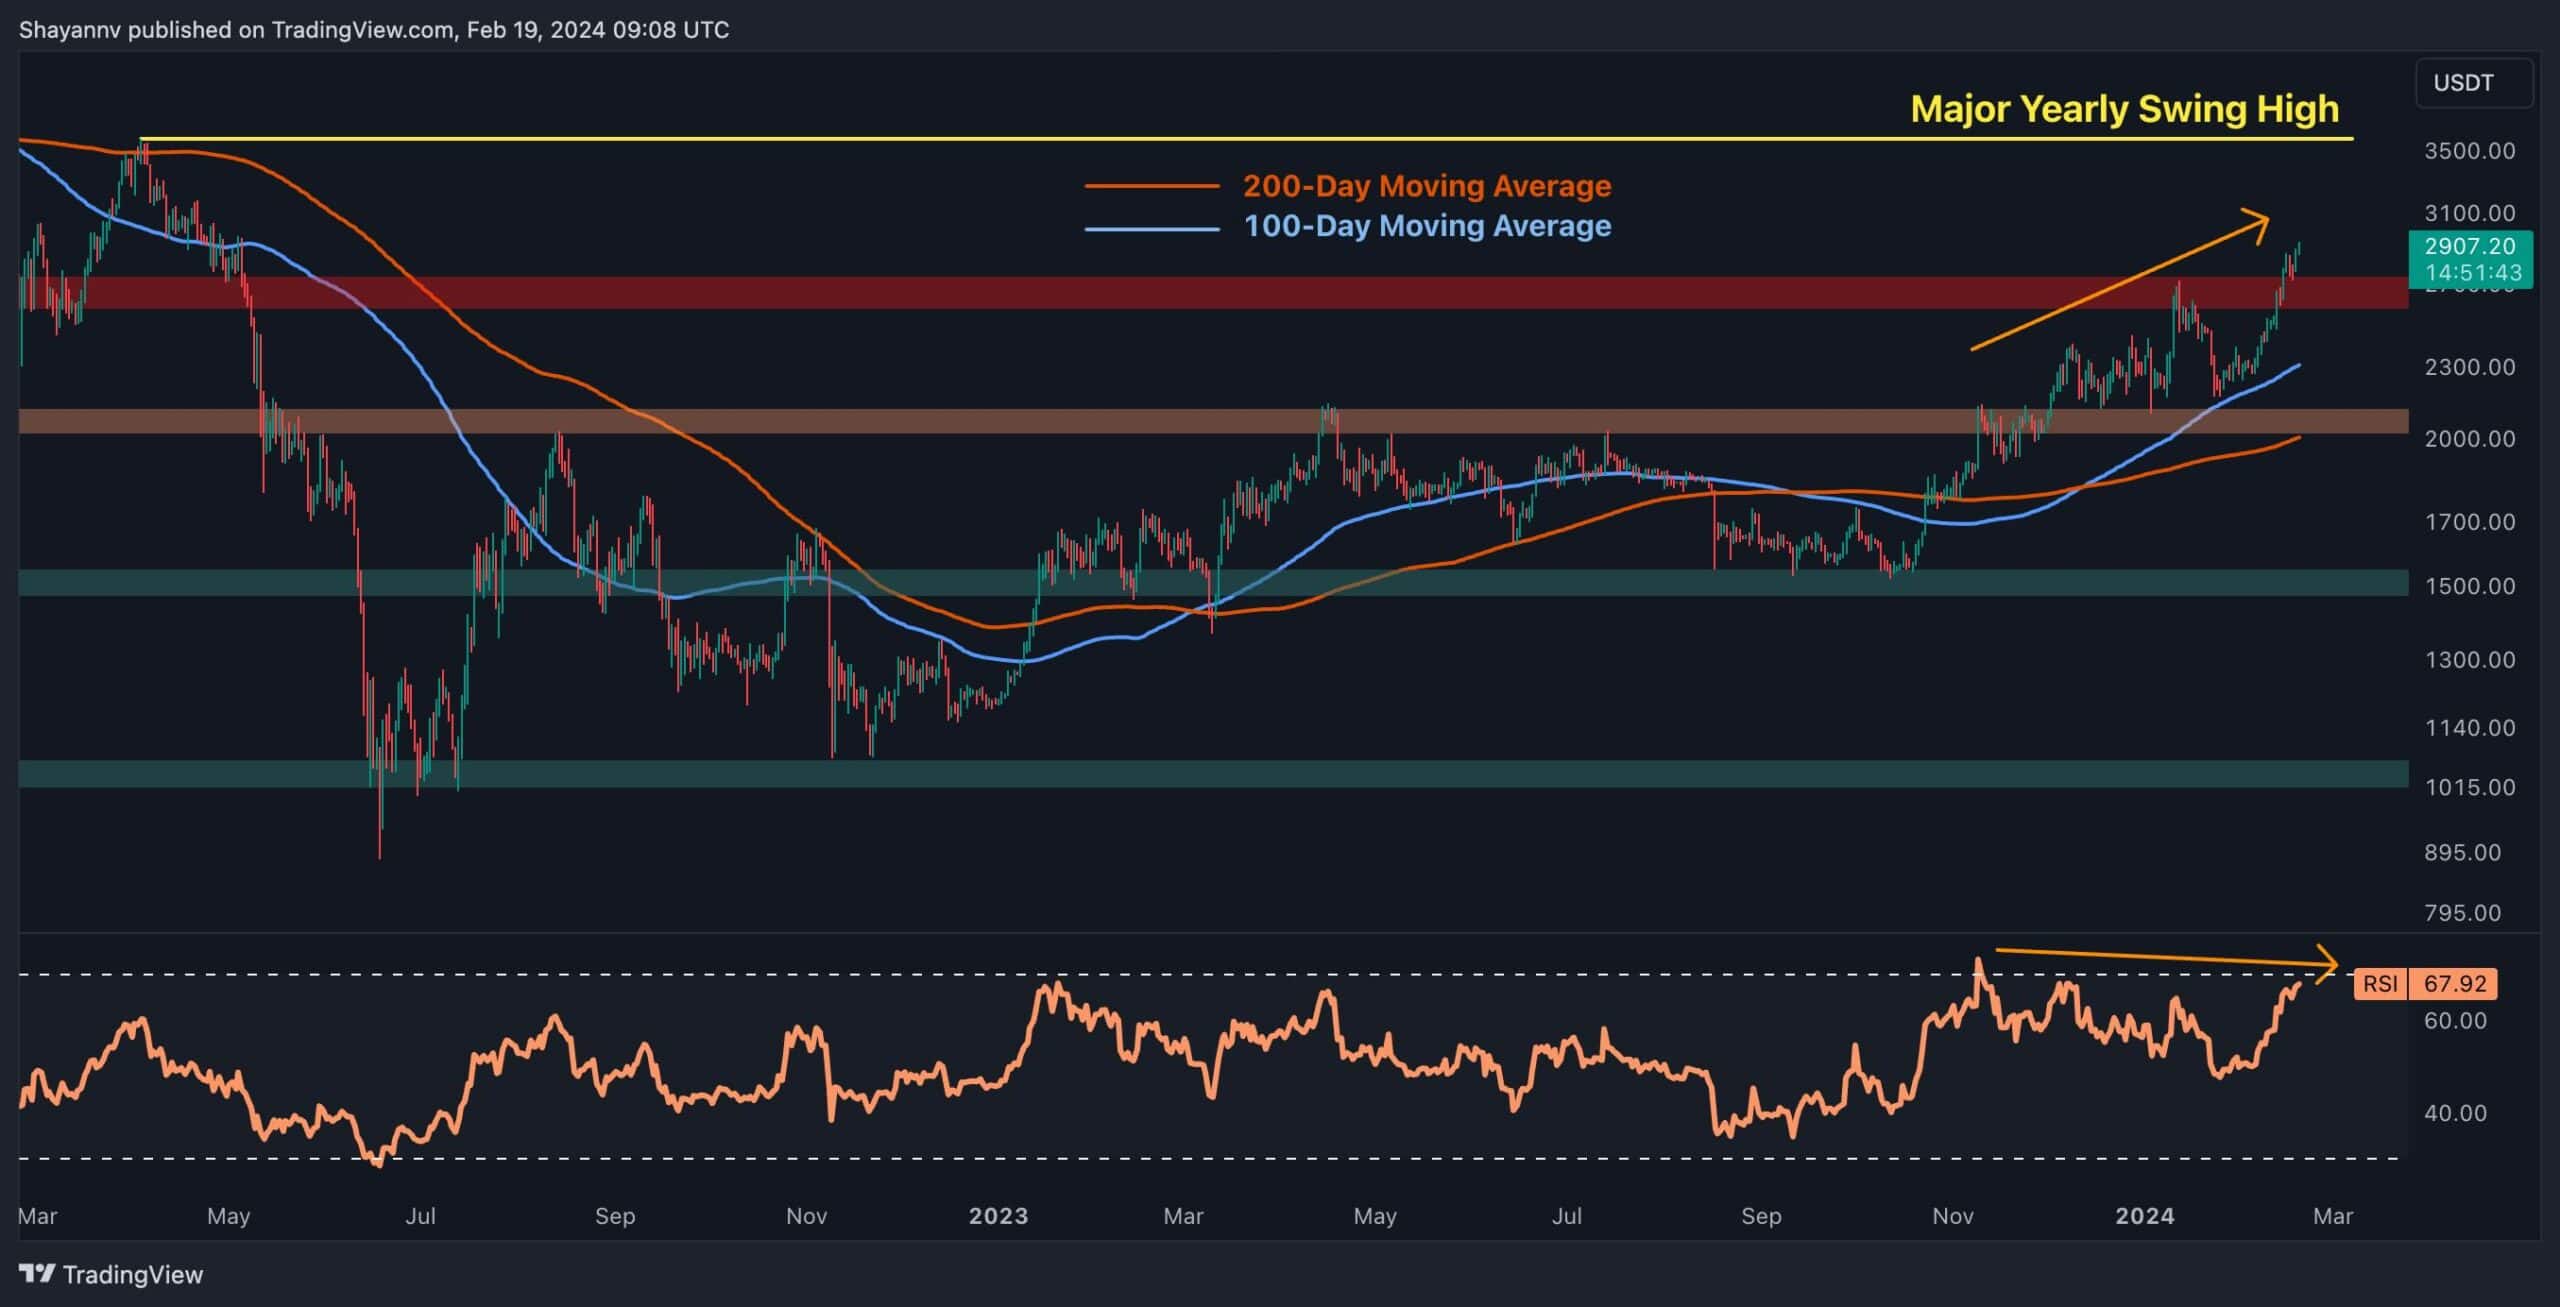
A thorough analysis of Ethereum’s daily chart reveals a significant shift in market sentiment, characterized by an impulsive uptrend and heightened bullish momentum.
Accordingly, the price has approached a crucial multi-year resistance zone – the psychological barrier at $2.9K and successfully surpassed it.
This indicates a prevailing bullish sentiment among market participants, with buyers dominating the market. The trend appears sustainable, with eyes set on surpassing the major yearly swing high at $3.6K. However, it’s worth noting that the only concern is the emergence of an expanded bearish divergence between the price and the RSI indicator, signaling a possible short to mid-term correction or consolidation phase before the next surge.
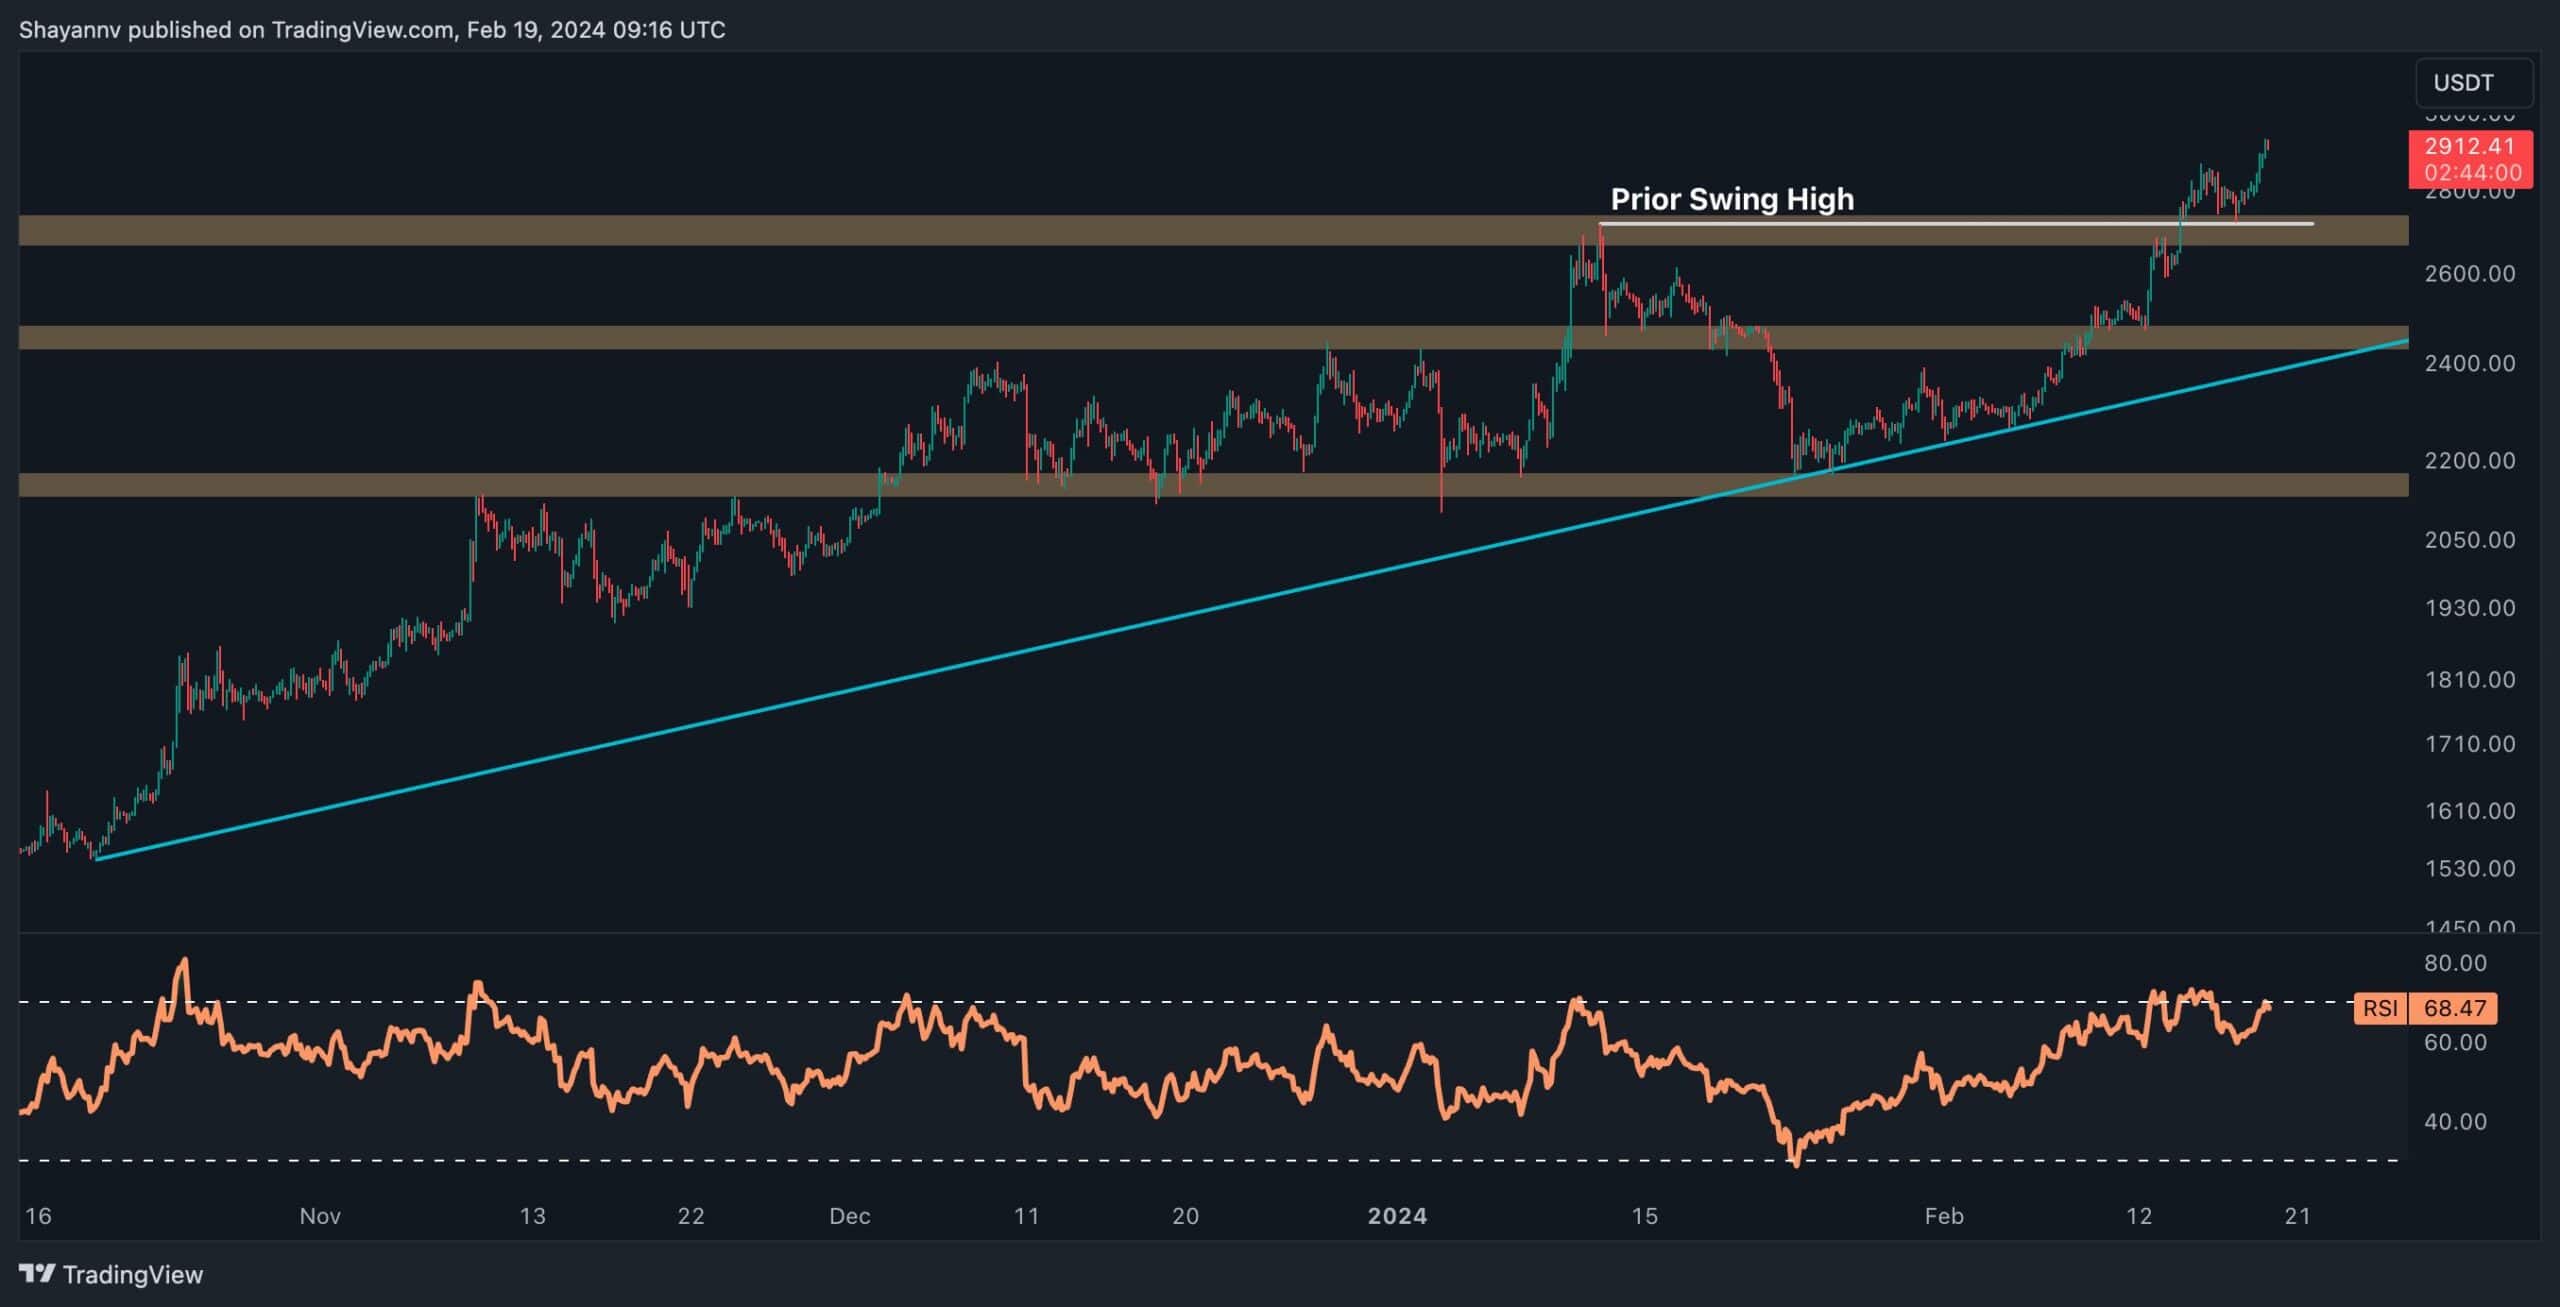
The 4-Hour Chart
Analyzing the 4-hour chart, a significant price reversal can be observed near the multi-month ascending trendline, supported by substantial buying pressure. This upward momentum led to a breakthrough above a crucial prior major swing high, establishing a new higher high. The above underscores the presence of active buyers targeting higher resistance levels.
With the price reclaiming a significant resistance zone and completing a pullback to the broken level, the trajectory is expected to remain bullish with intermittent downward corrections. However, given prevailing market conditions, periods of heightened volatility may lead to notable price fluctuations.
In summary, Ethereum’s recent price surge and reclaiming of crucial resistance levels signify strong buyer confidence and a sustainable bullish trend. While short to mid-term corrections are possible, the overall outlook remains positive, with buyers likely to continue driving the market toward higher price targets.
By Shayan
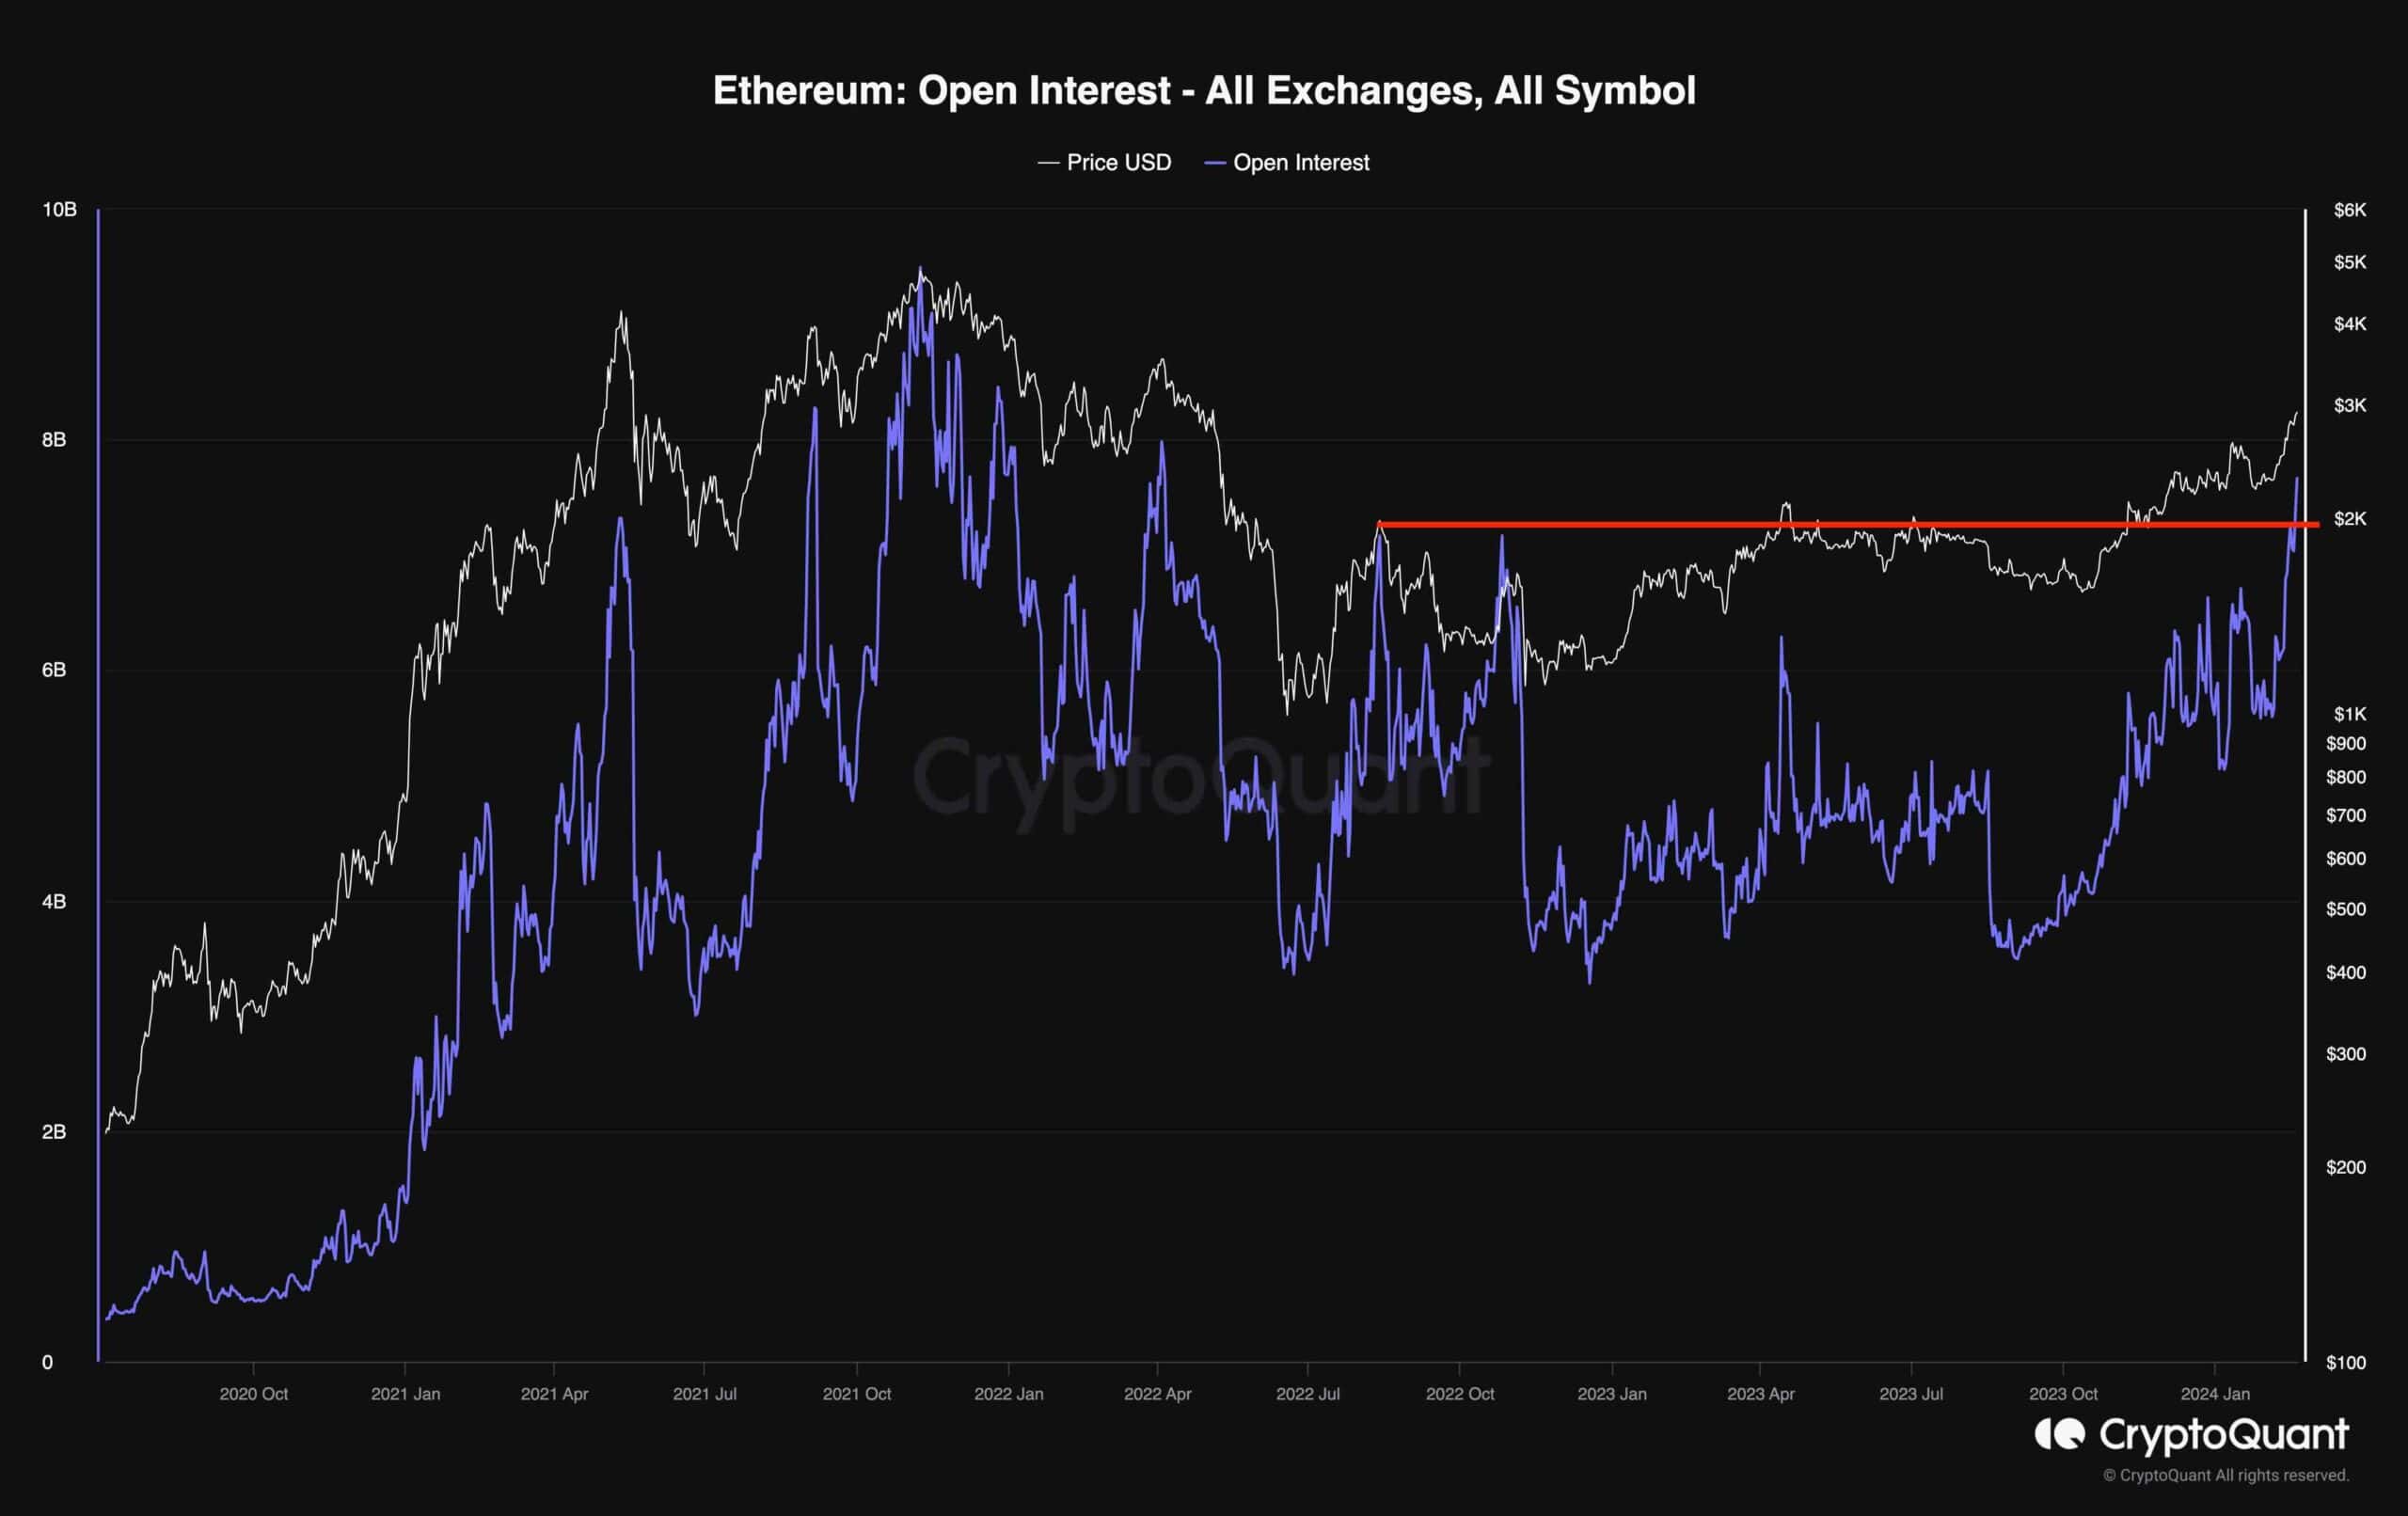
As Ethereum’s price has steadily climbed from the significant support level of $1.5K to surpass $2.8K in recent months, investors are keen to gain insights from futures market sentiment analysis.
The chart illustrates the open interest metric across all exchanges, representing the total number of open futures contracts, regardless of the trade direction. Higher values signify increased confidence among futures traders in the prevailing trend, while lower values indicate uncertainty. Moreover, heightened open interest often correlates with heightened price volatility, as it amplifies the probability of cascading liquidations.
Notably, the chart reveals a significant surge in open interest, coinciding with Ethereum’s upward price trend, reaching its peak levels since July 2022. This surge indicates sustained confidence among futures traders in Ethereum’s current uptrend.
However, given the impulsive nature of the recent ascent, traders should exercise caution and consider the potential for sudden liquidation events, which could trigger notable short to mid-term price declines.