Ethereum’s price has been consolidating after a significant crash a few weeks ago, making market participants hopeful that the price is creating a bottom. Technical Analysis By: Edris Derakhshi The Daily Chart On the daily chart, the price has gradually made higher highs and lows since rebounding from the ,100 support level. Yet, the market is yet to break past the ,700 resistance, while a rejection could lead to another drop to ,100. On the other hand, if the market successfully breaks through this resistance, a rise toward ,000 would be imminent in the short term. Source: TradingViewThe 4-Hour Chart The 4-hour chart clarifies the recent price action, as the market has been moving inside a rising wedge pattern. These are primarily bearish. A breakout below the
Topics:
CryptoVizArt considers the following as important: ETH Analysis, ETHBTC, Ethereum (ETH) Price, ethusd
This could be interesting, too:
Mandy Williams writes Ethereum Derivatives Metrics Signal Modest Downside Tail Risk Ahead: Nansen
Jordan Lyanchev writes Weekly Bitcoin, Ethereum ETF Recap: Light at the End of the Tunnel for BTC
CryptoVizArt writes Will Weak Momentum Drive ETH to .5K? (Ethereum Price Analysis)
Jordan Lyanchev writes Bybit Hack Fallout: Arthur Hayes, Samson Mow Push for Ethereum Rollback
Ethereum’s price has been consolidating after a significant crash a few weeks ago, making market participants hopeful that the price is creating a bottom.
Technical Analysis
By: Edris Derakhshi
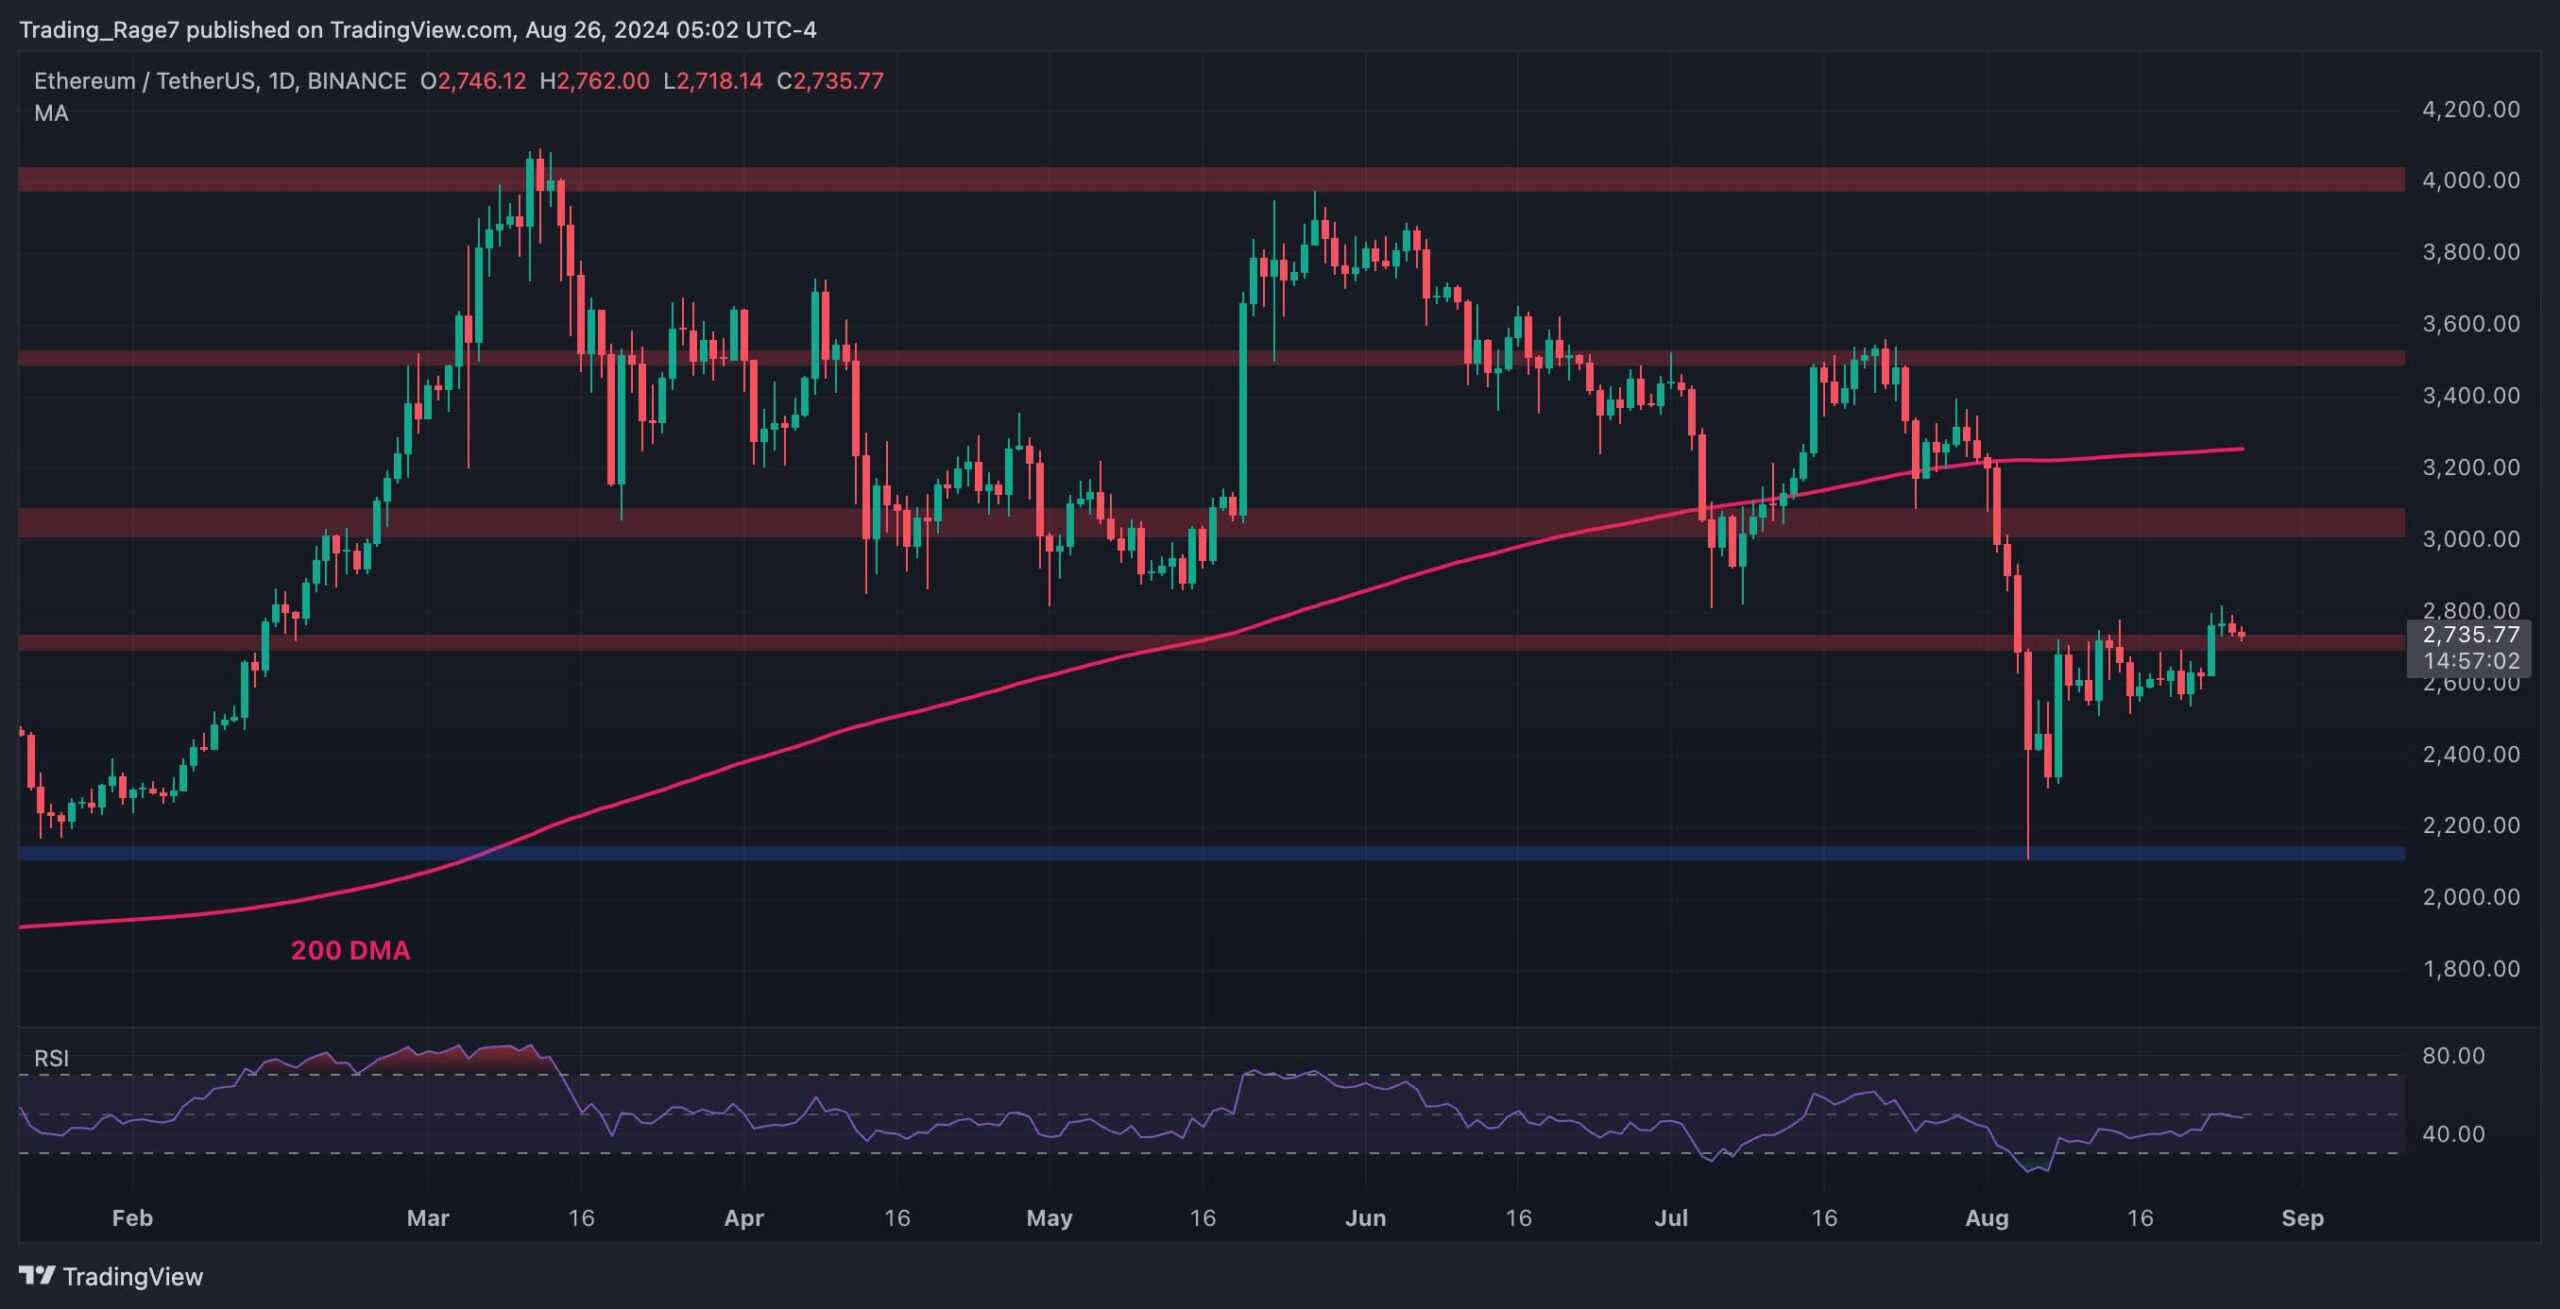
The Daily Chart
On the daily chart, the price has gradually made higher highs and lows since rebounding from the $2,100 support level. Yet, the market is yet to break past the $2,700 resistance, while a rejection could lead to another drop to $2,100.
On the other hand, if the market successfully breaks through this resistance, a rise toward $3,000 would be imminent in the short term.
The 4-Hour Chart
The 4-hour chart clarifies the recent price action, as the market has been moving inside a rising wedge pattern.
These are primarily bearish. A breakout below the wedge could continue toward the $2,100 level and even lower. However, if the market somehow breaks the pattern to the upside, a quick surge toward the $3,000 resistance zone and even higher could be expected.

Sentiment Analysis
Ethereum Open Interest
Ethereum’s recent downtrend has led many investors to change their views on the direction, believing the bull run is over. This is particularly observable in the perpetual futures market sentiment.
This chart presents the Ethereum Open Interest (OI), which measures the number of open perpetual futures positions across all derivatives exchanges. High OI values usually hint at bullish sentiment among futures traders and vice versa.
As the chart demonstrates, the Open Interest has dropped significantly during the recent massive price drop and is yet to recover. This can be a good sign, as the price will be less volatile and more spot-driven. Therefore, with sufficient demand in the spot market, Ethereum could begin a sustainable rally soon.
