Ethereum’s price has been correcting over the past few weeks after setting a local high around the ,000 mark. While the price is yet to recover, the bull market may be far from over. Technical Analysis By TradingRage The Daily Chart On the daily timeframe, the price has been consolidating between ,000 and ,600. Following the recent rejection from ,600, the market is once again targeting the support at ,000. The Relative Strength Index has also dropped below 50%, as the momentum has seemingly shifted bearish. A break below ,000 would lead to a potential crash toward the 200-day moving average around the ,400 mark. On the contrary, a rebound from the ,000 zone could push the price back toward ,600 and likely higher this time around. Source: TradingViewThe
Topics:
CryptoVizArt considers the following as important: ETH Analysis, ETHBTC, Ethereum (ETH) Price, ethusd
This could be interesting, too:
Mandy Williams writes Ethereum Derivatives Metrics Signal Modest Downside Tail Risk Ahead: Nansen
Jordan Lyanchev writes Weekly Bitcoin, Ethereum ETF Recap: Light at the End of the Tunnel for BTC
CryptoVizArt writes Will Weak Momentum Drive ETH to .5K? (Ethereum Price Analysis)
Jordan Lyanchev writes Bybit Hack Fallout: Arthur Hayes, Samson Mow Push for Ethereum Rollback
Ethereum’s price has been correcting over the past few weeks after setting a local high around the $4,000 mark. While the price is yet to recover, the bull market may be far from over.
Technical Analysis
By TradingRage
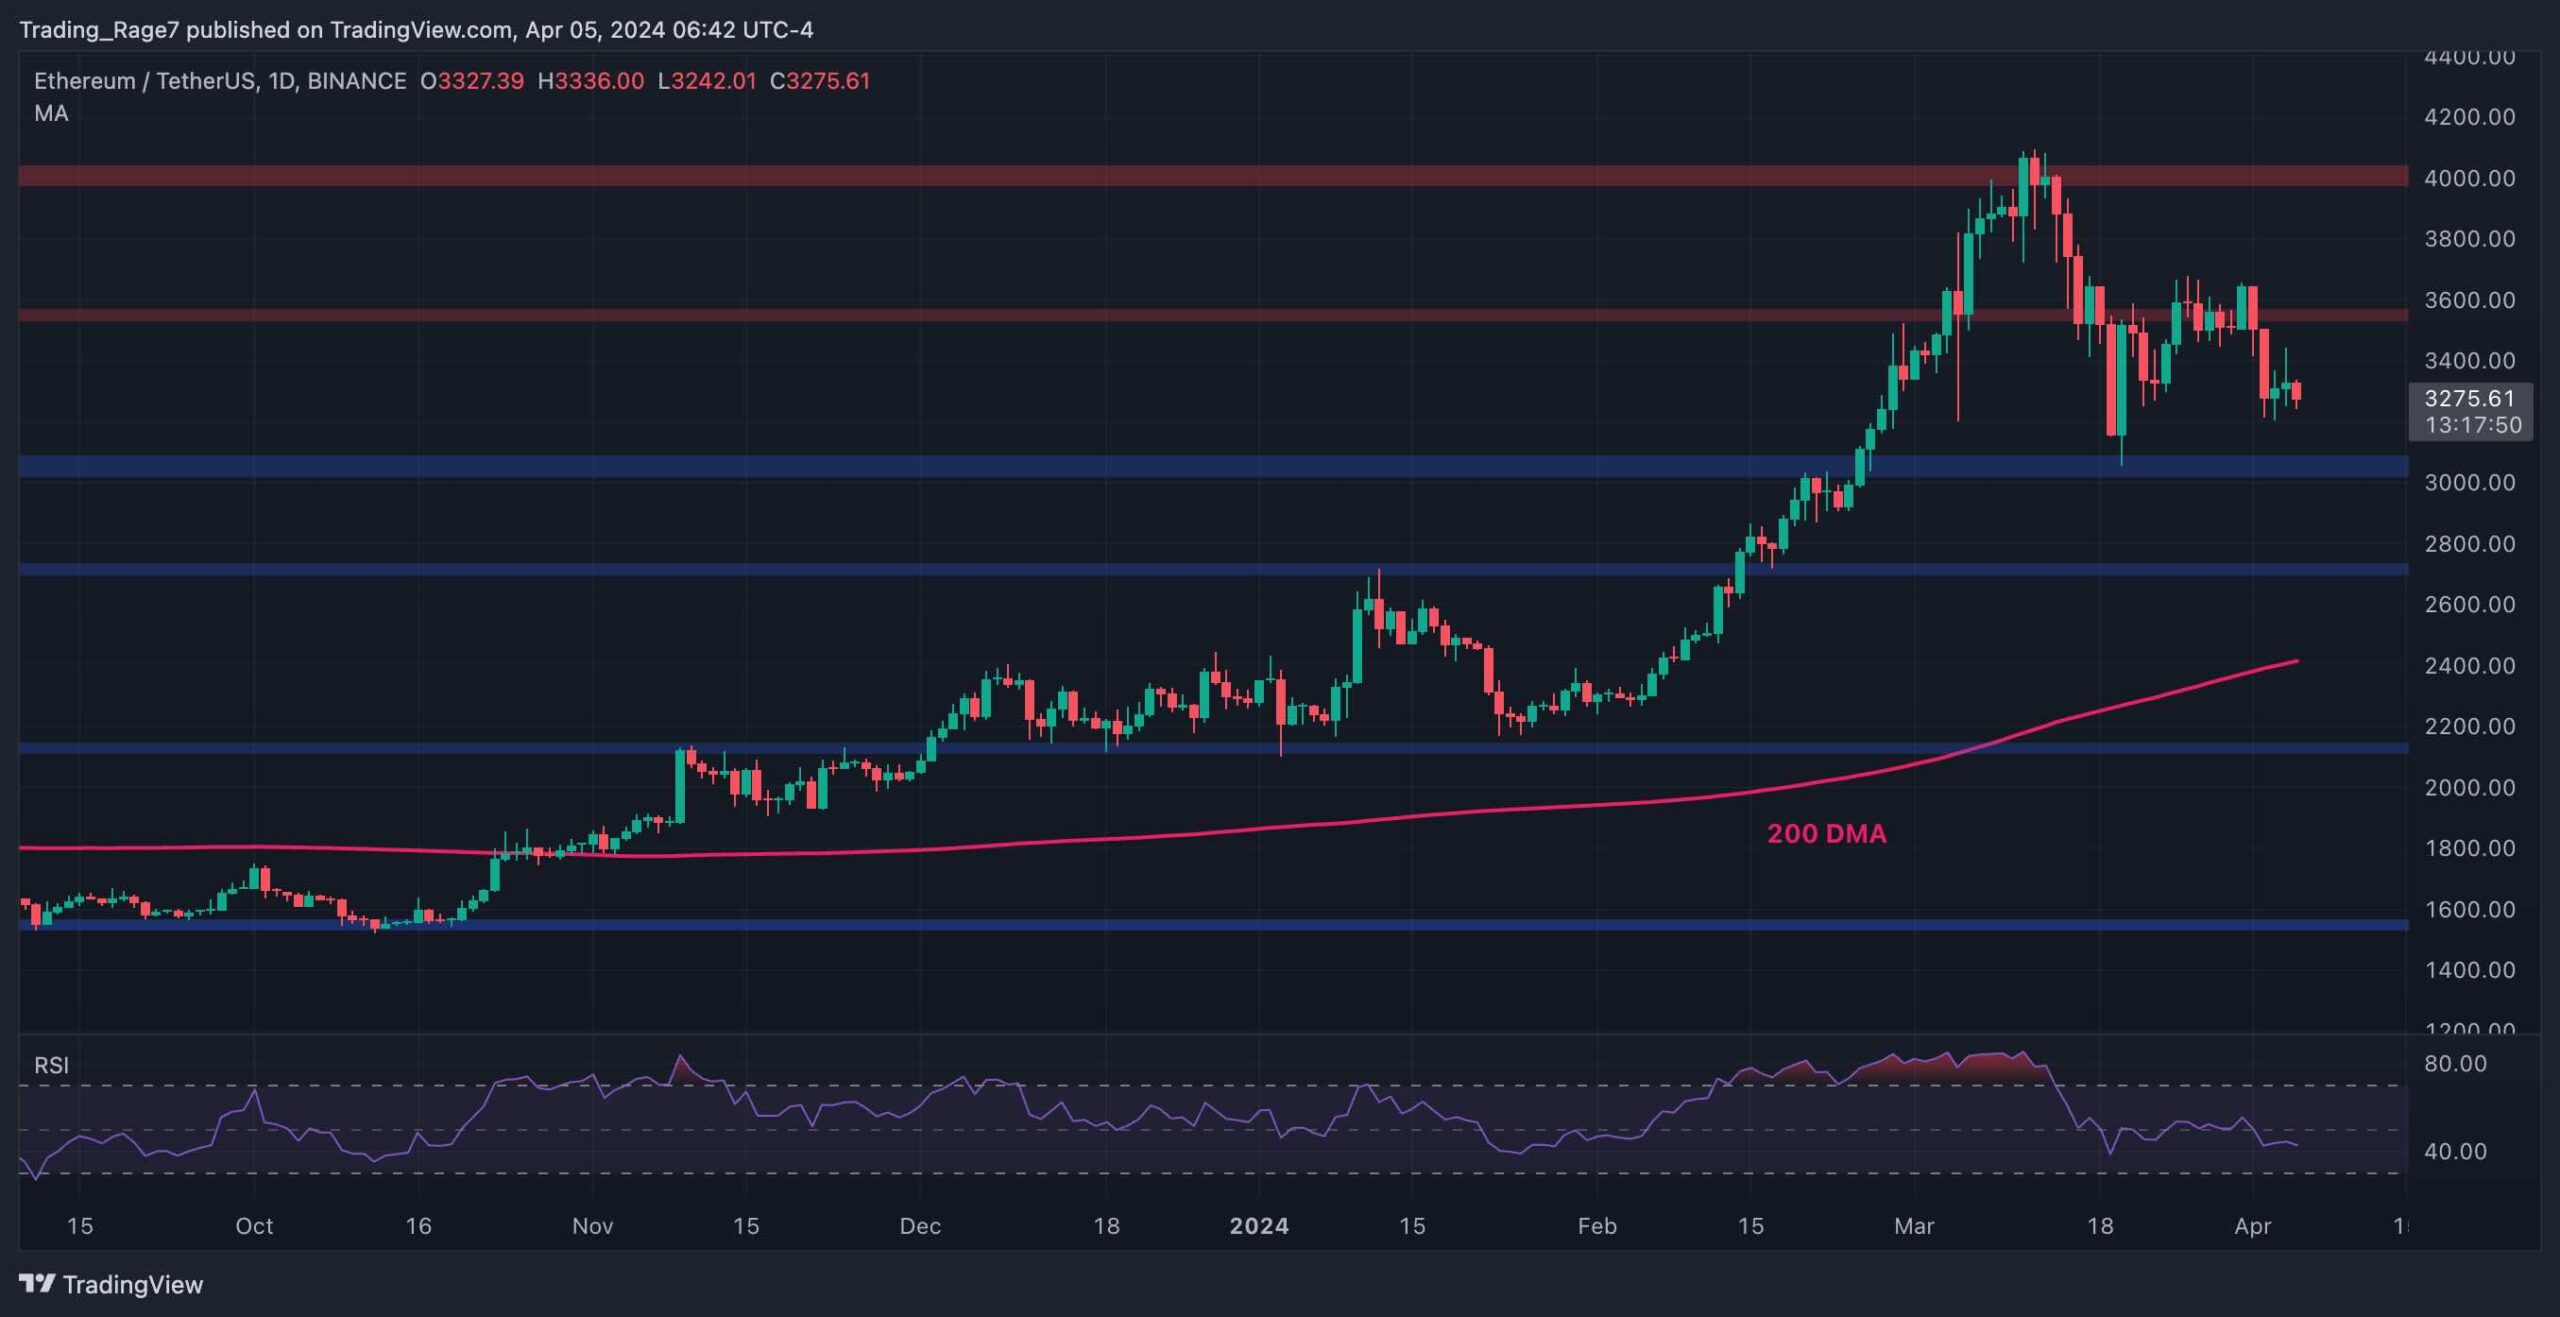
The Daily Chart
On the daily timeframe, the price has been consolidating between $3,000 and $3,600. Following the recent rejection from $3,600, the market is once again targeting the support at $3,000.
The Relative Strength Index has also dropped below 50%, as the momentum has seemingly shifted bearish. A break below $3,000 would lead to a potential crash toward the 200-day moving average around the $2,400 mark.
On the contrary, a rebound from the $3,000 zone could push the price back toward $3,600 and likely higher this time around.
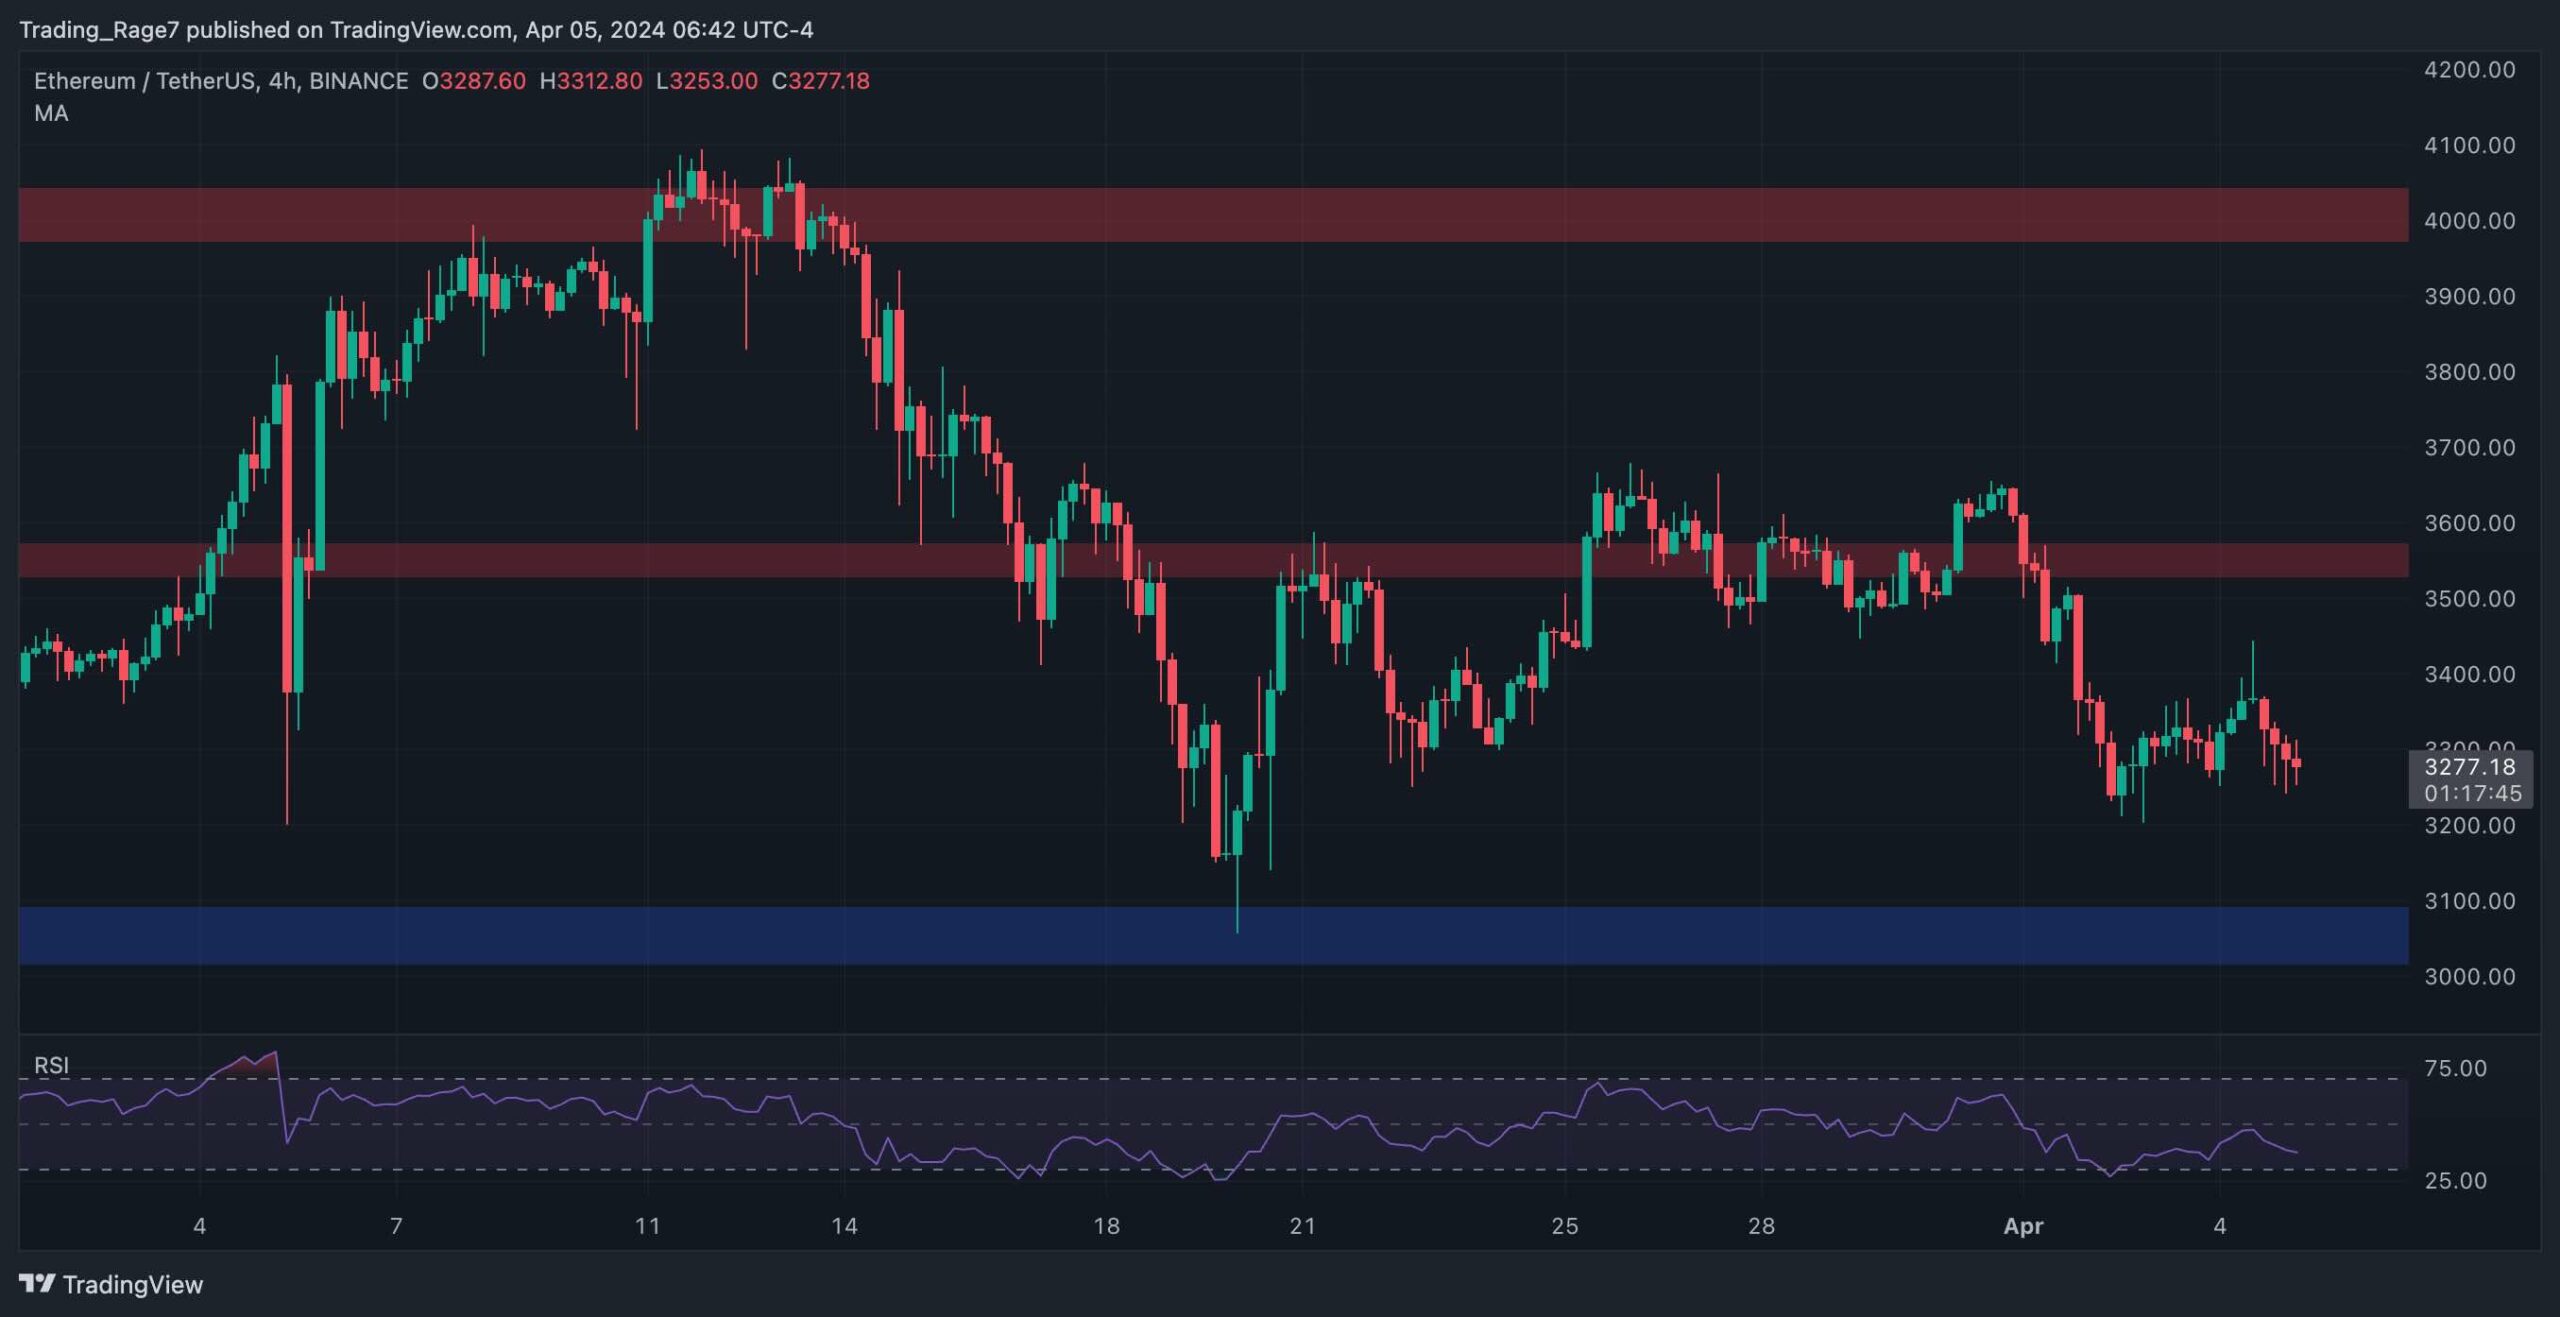
The 4-Hour Chart
Looking at the 4-hour chart, the recent price action seems very choppy. The price has tested the $3,600 resistance zone several times but has failed to continue higher toward $4,000.
The market structure is clearly bearish in the short term, as the price has been making lower highs and lows consistently. Therefore, a drop back toward the $3,000 zone will be imminent, if the price breaks below $3,200.