Ethereum’s recent price action has seen it find support around the critical 100-day moving average, signaling a shift in market sentiment from bearish to bullish. ETH has embarked on a bullish retracement and has now reached a pivotal resistance region, setting the stage for its next move. By Shayan The Daily Chart A comprehensive examination of Ethereum’s daily chart unveils a shift in market sentiment, with the significant 100-day moving average at 25 providing robust support. Concurrently, Ethereum experienced a rebound, propelling the price toward a critical resistance region, which encompasses the lower boundary of the expanding wedge pattern and the static .6K price zone. Should ETH surpass this critical resistance, it could herald a new phase of bullish
Topics:
CryptoVizArt considers the following as important: ETH Analysis, ETHBTC, Ethereum (ETH) Price, ethusd
This could be interesting, too:
Mandy Williams writes Ethereum Derivatives Metrics Signal Modest Downside Tail Risk Ahead: Nansen
Jordan Lyanchev writes Weekly Bitcoin, Ethereum ETF Recap: Light at the End of the Tunnel for BTC
CryptoVizArt writes Will Weak Momentum Drive ETH to .5K? (Ethereum Price Analysis)
Jordan Lyanchev writes Bybit Hack Fallout: Arthur Hayes, Samson Mow Push for Ethereum Rollback
Ethereum’s recent price action has seen it find support around the critical 100-day moving average, signaling a shift in market sentiment from bearish to bullish. ETH has embarked on a bullish retracement and has now reached a pivotal resistance region, setting the stage for its next move.
By Shayan
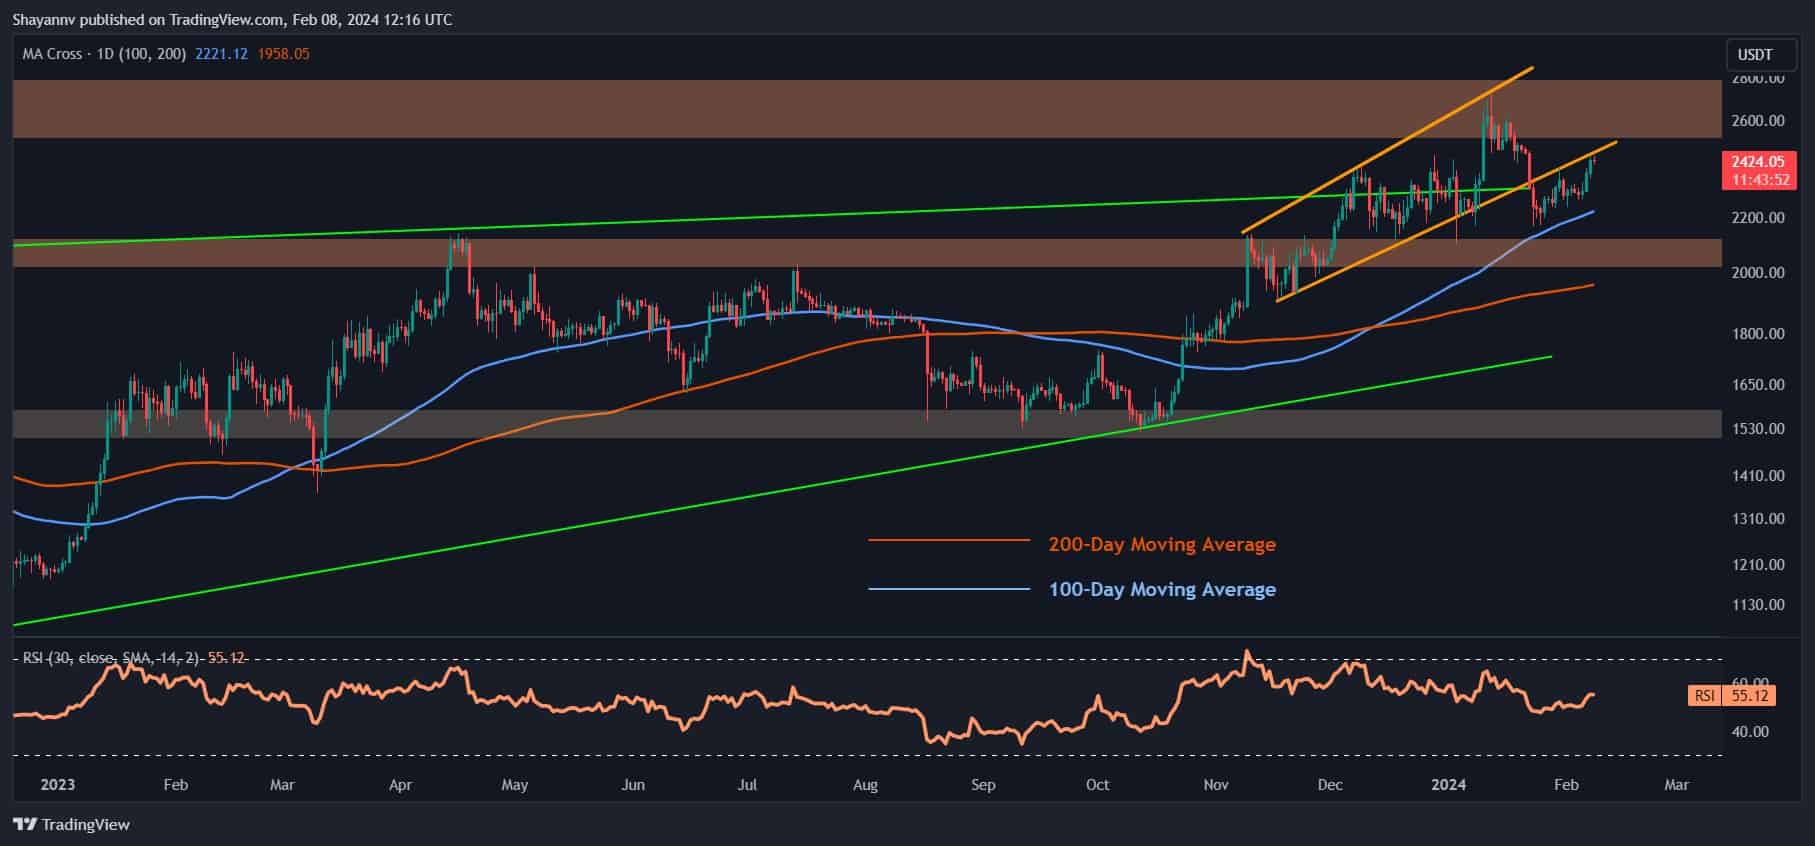
The Daily Chart
A comprehensive examination of Ethereum’s daily chart unveils a shift in market sentiment, with the significant 100-day moving average at $2225 providing robust support. Concurrently, Ethereum experienced a rebound, propelling the price toward a critical resistance region, which encompasses the lower boundary of the expanding wedge pattern and the static $2.6K price zone.
Should ETH surpass this critical resistance, it could herald a new phase of bullish movements, leading to heightened volatility in the market. Thus, Ethereum’s price action near this crucial range holds paramount importance in determining the cryptocurrency’s forthcoming trend.
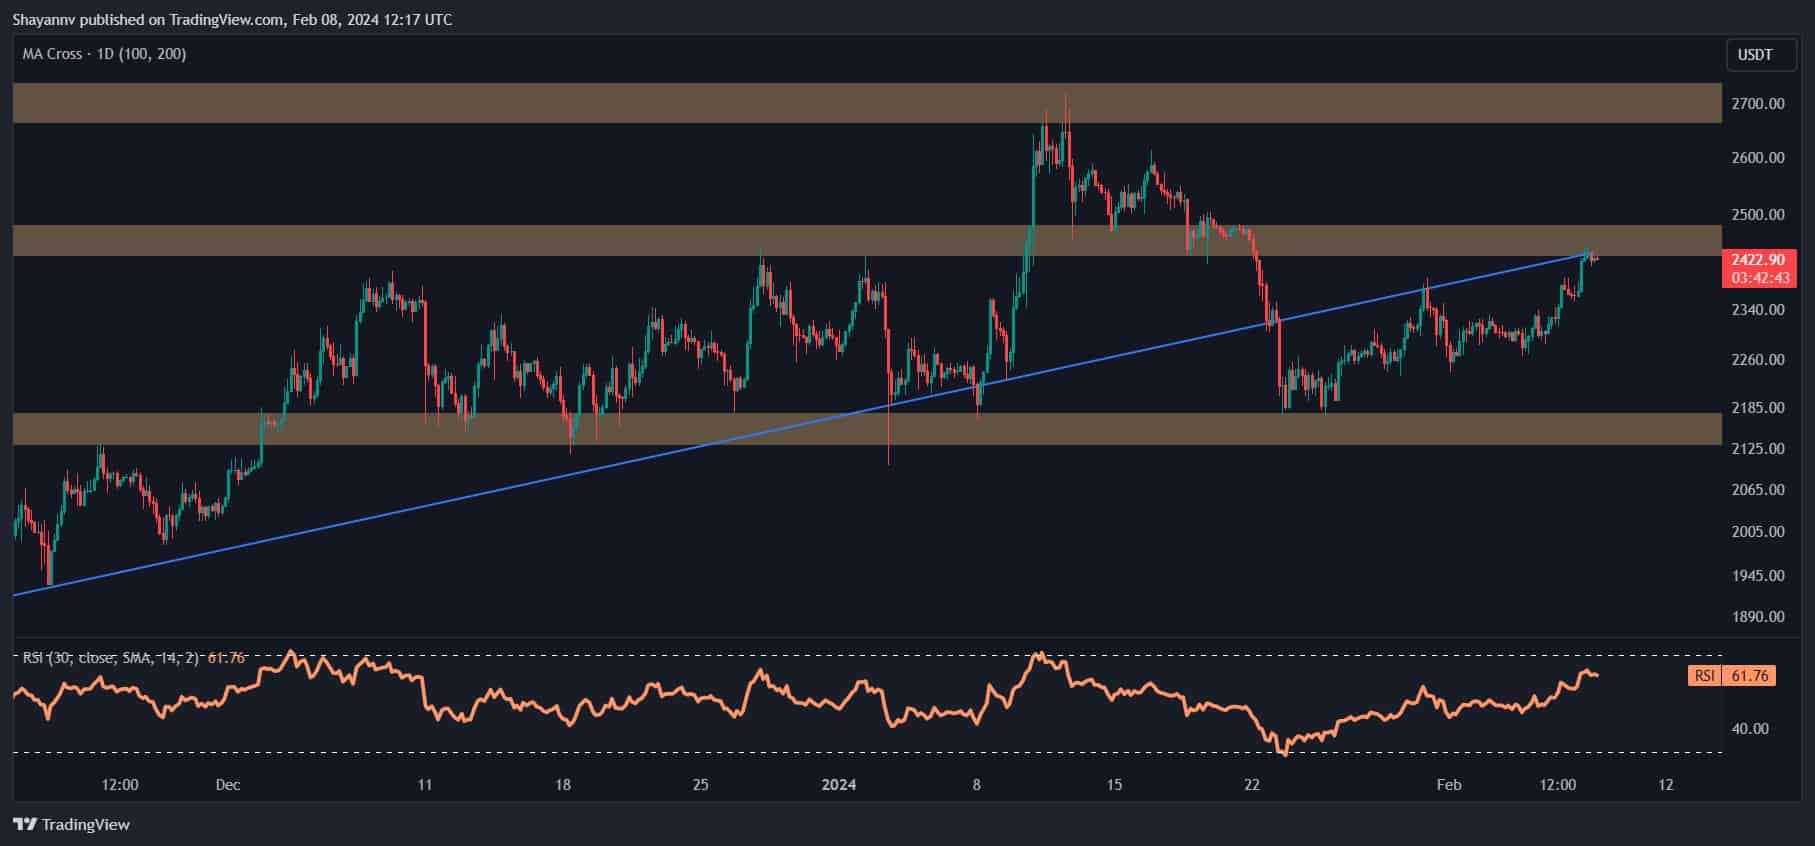
The 4-Hour Chart
An analysis of the 4-hour chart reveals that following an impulsive cascade, Ethereum faced substantial buying pressure, triggering a reversal. This surge in buying activity propelled the price upward, leading to a retracement towards the ascending trendline in an attempt to reclaim it.
Currently, the price has encountered a significant resistance region, marked by the static zone at $2450 and the ascending trendline.
This crucial resistance has thwarted recent attempts by the buyers to breach it, establishing itself as a formidable barrier.
Nonetheless, the forthcoming price action around this critical resistance will likely determine Ethereum’s next direction, with expectations of heightened market activity in the short term. Continued monitoring of these key levels will be essential for assessing ETH’s potential trajectory.
By Shayan
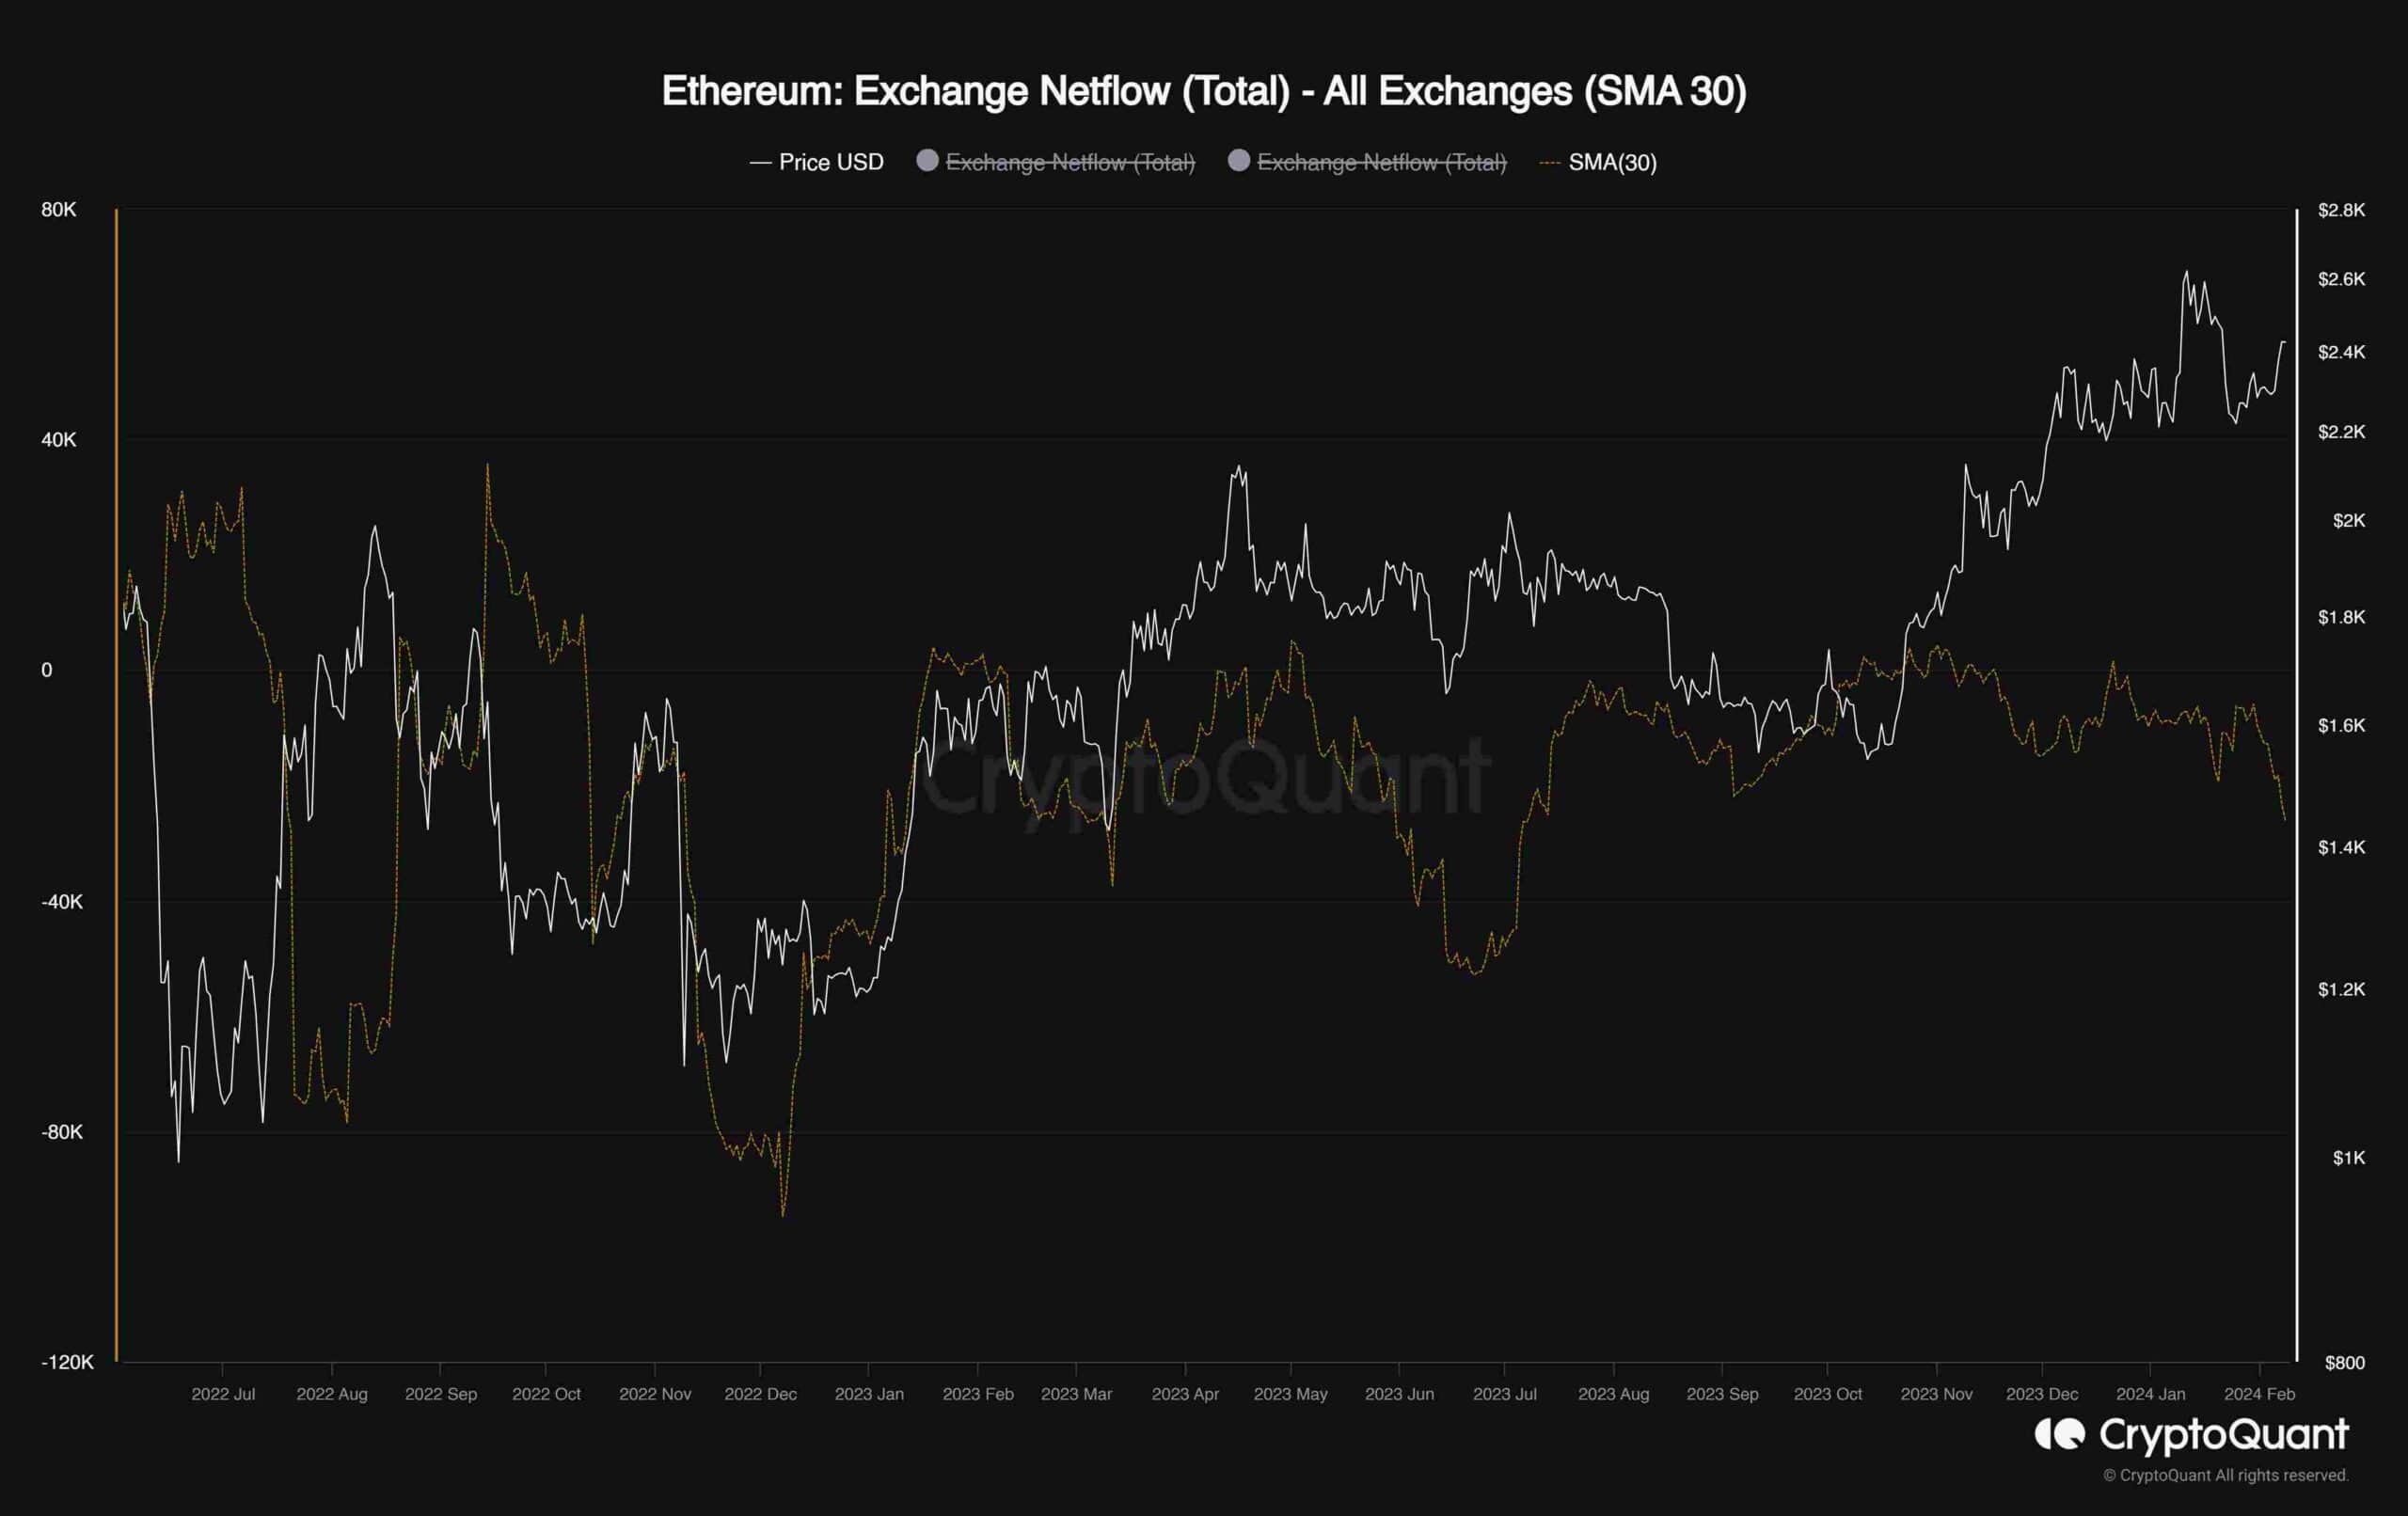
The chart depicted illustrates Ethereum’s exchange netflow metric alongside its price, representing the disparity between coins entering and exiting exchanges. Notably, positive values signify an increase in exchange reserves, indicating potential heightened selling pressure, whereas negative values indicate a decrease in reserves, suggesting ongoing accumulation.
An insightful observation from the chart is that each sustained uptrend coincided with the metric trending downwards in the negative region.
Presently, after a period of consolidation, the metric is exhibiting a decline, signaling potential accumulation in the market. Should this behavior persist, Ethereum can anticipate another upward rally in the mid-term.