Ethereum’s price has been rallying aggressively over the past few days. Yet, the market is approaching a strong resistance level that could determine the mid-term fate of ETH. Technical Analysis By TradingRage The Daily Chart On the daily chart, the price has been rallying since a rebound from the ,200 zone. The ,400 resistance level has also been broken with ease. Currently, ETH is climbing toward the ,700 resistance level and the higher boundary of the large ascending channel. However, the Relative Strength Index has also been rising, entering the overbought region. This might trigger a possible pullback or reversal as the price reaches the ,700 resistance level. Source: TradingViewThe 4-Hour Chart Looking at the 4-hour chart, the recent rally becomes much more
Topics:
George Georgiev considers the following as important: ETH Analysis, ETHBTC, Ethereum (ETH) Price, ethusd
This could be interesting, too:
Mandy Williams writes Ethereum Derivatives Metrics Signal Modest Downside Tail Risk Ahead: Nansen
Jordan Lyanchev writes Weekly Bitcoin, Ethereum ETF Recap: Light at the End of the Tunnel for BTC
CryptoVizArt writes Will Weak Momentum Drive ETH to .5K? (Ethereum Price Analysis)
Jordan Lyanchev writes Bybit Hack Fallout: Arthur Hayes, Samson Mow Push for Ethereum Rollback
Ethereum’s price has been rallying aggressively over the past few days. Yet, the market is approaching a strong resistance level that could determine the mid-term fate of ETH.
Technical Analysis
By TradingRage
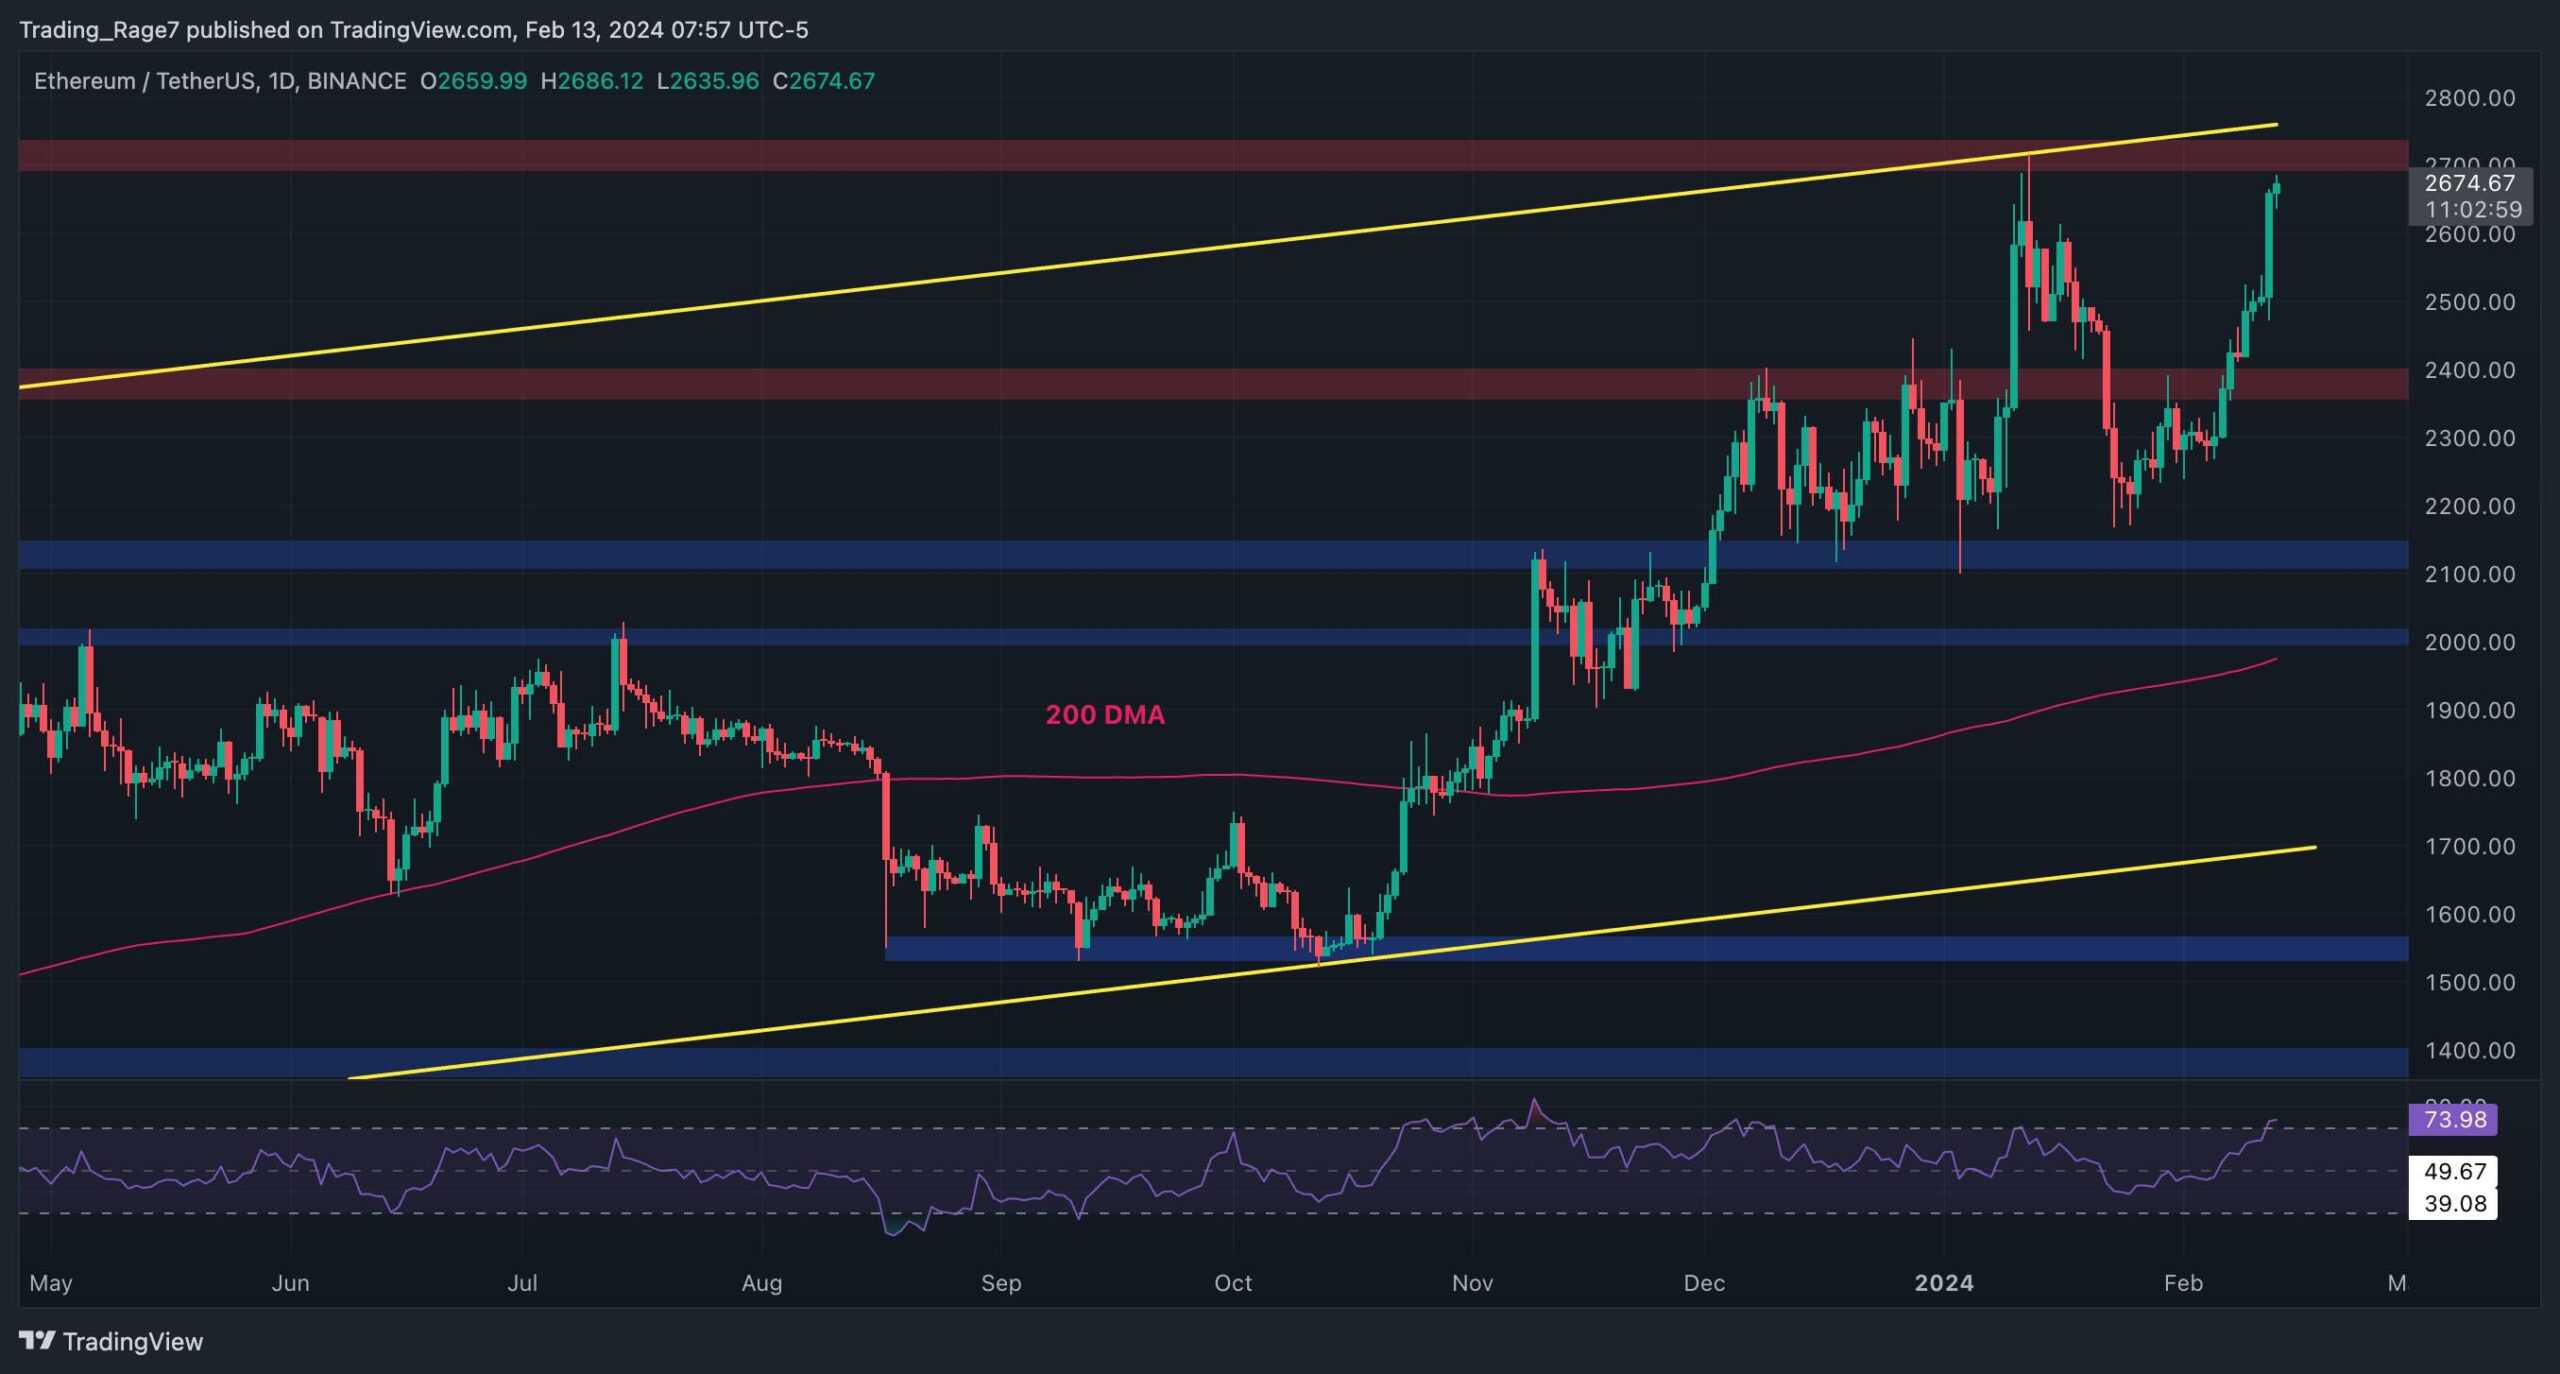
The Daily Chart
On the daily chart, the price has been rallying since a rebound from the $2,200 zone. The $2,400 resistance level has also been broken with ease.
Currently, ETH is climbing toward the $2,700 resistance level and the higher boundary of the large ascending channel. However, the Relative Strength Index has also been rising, entering the overbought region. This might trigger a possible pullback or reversal as the price reaches the $2,700 resistance level.
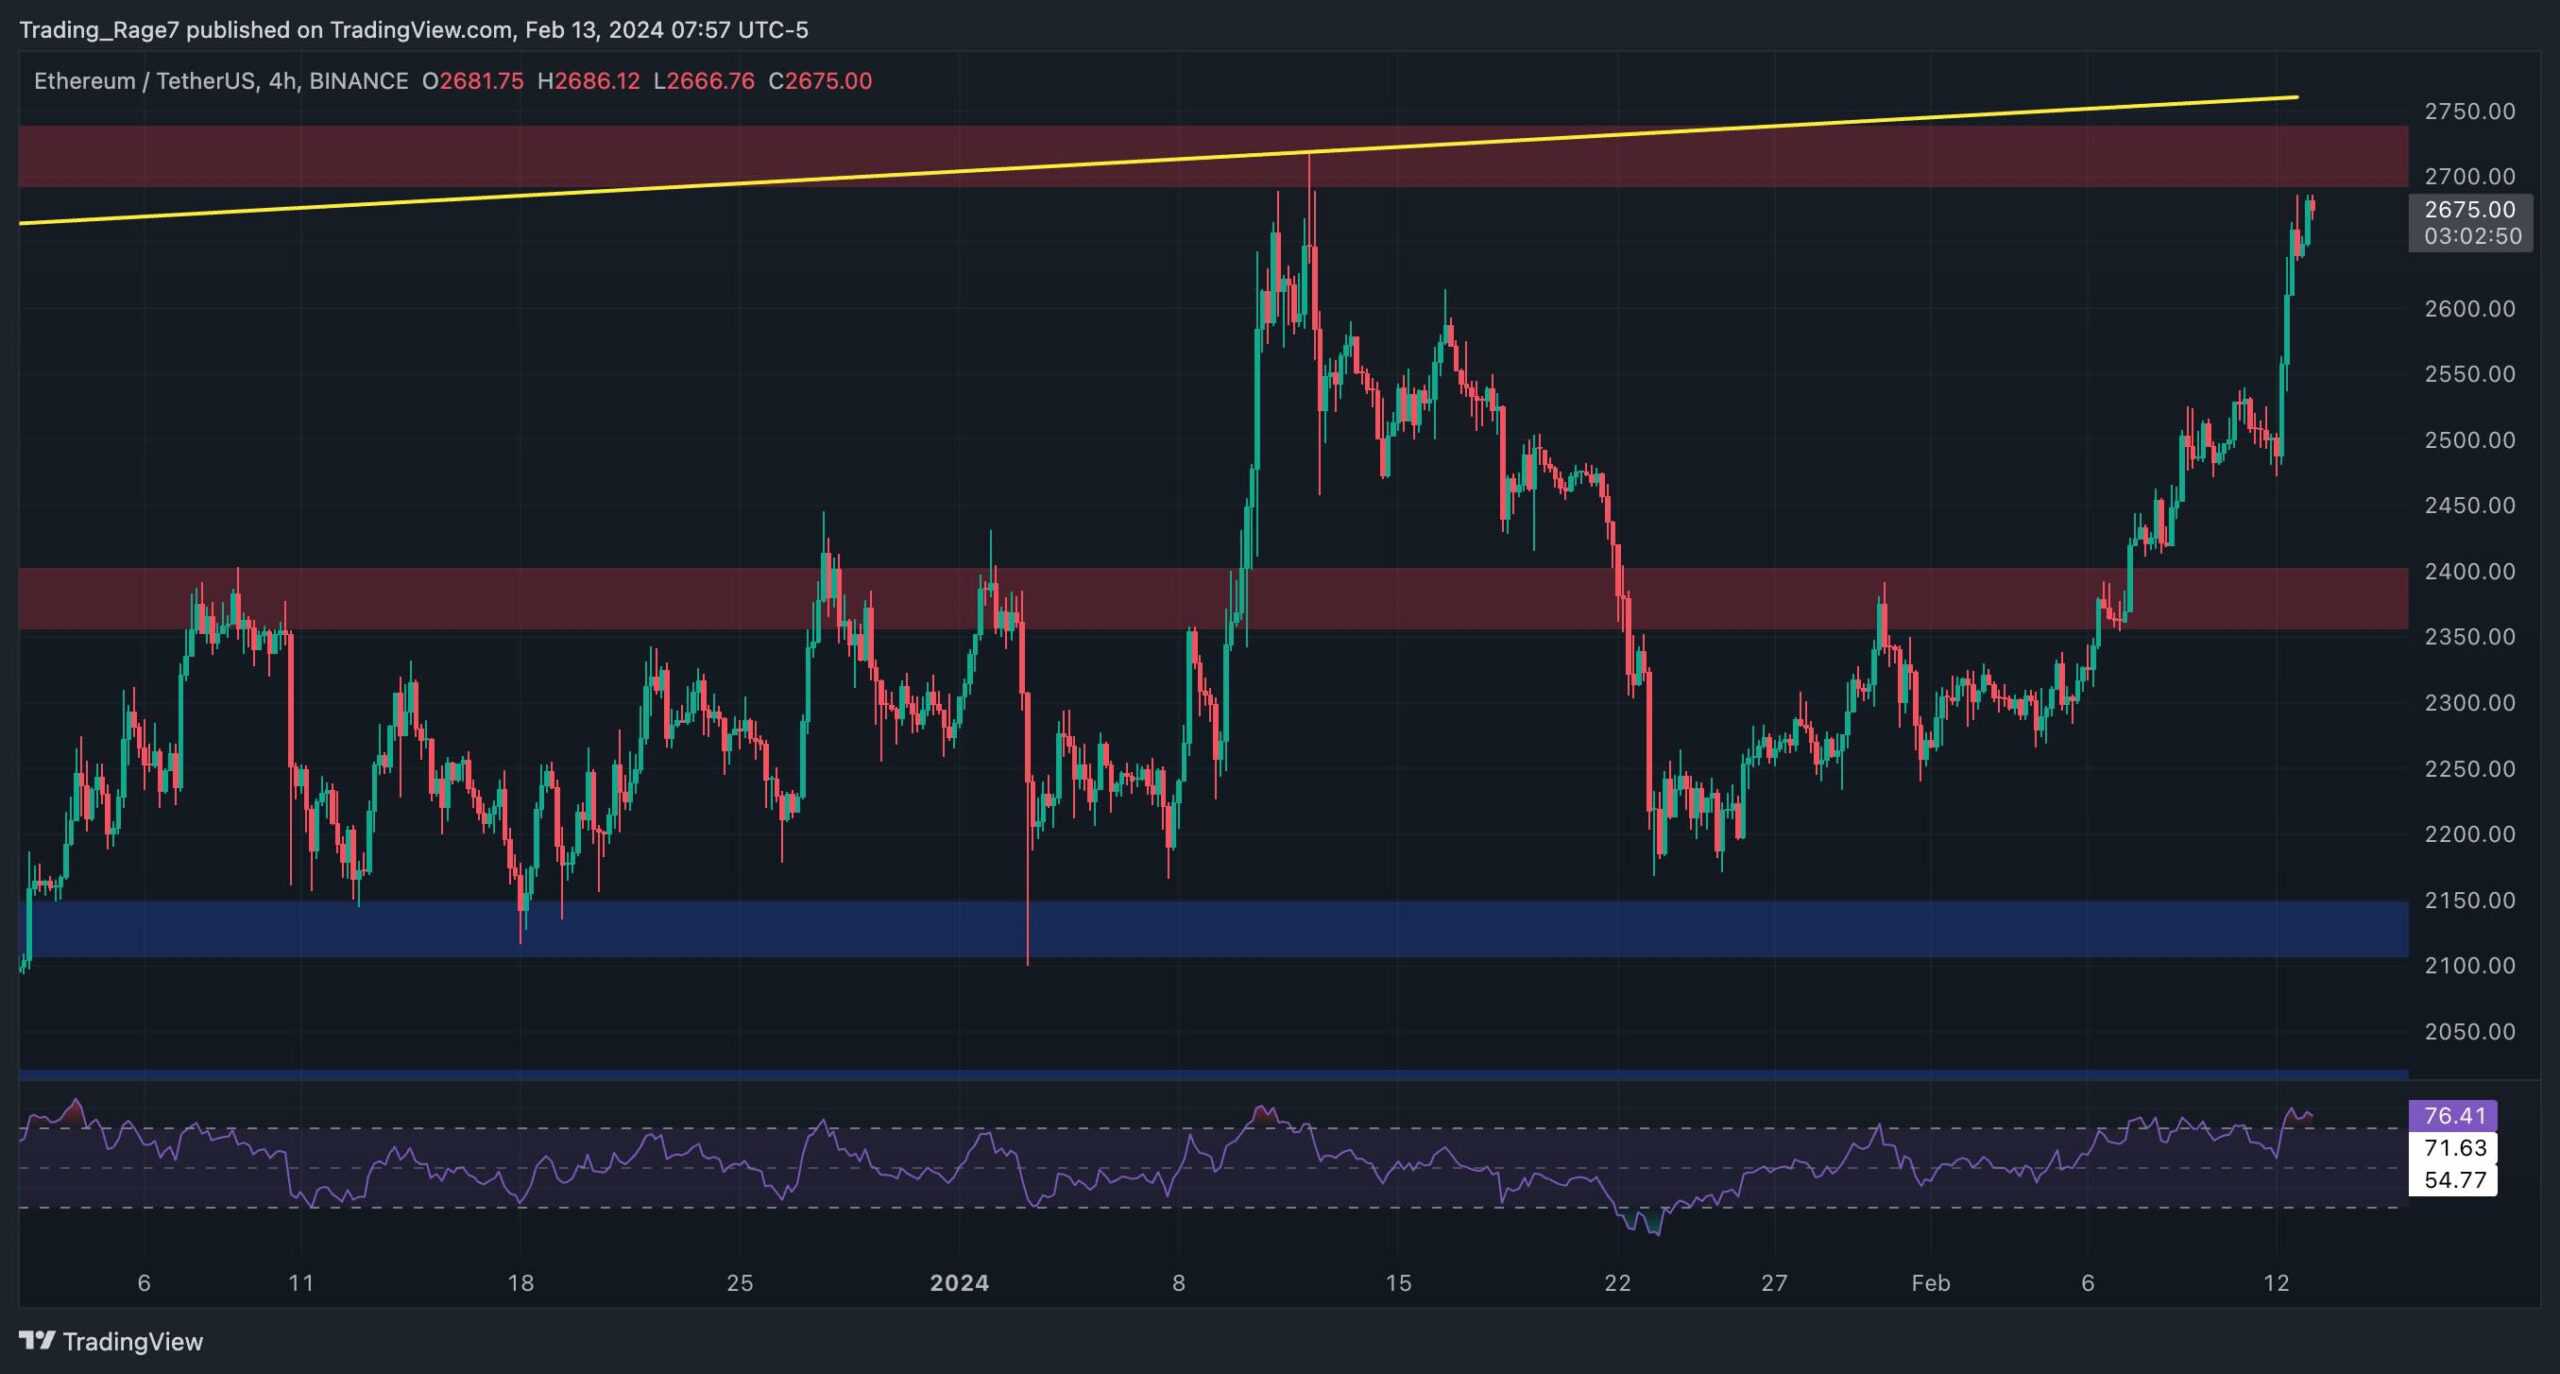
The 4-Hour Chart
Looking at the 4-hour chart, the recent rally becomes much more clear. The price is approaching the $2,700 resistance level almost vertically.
This highly bullish momentum is also supported by the Relative Strength Index, which is above the 70% level. Yet, with the RSI being oversold on the daily and the 4-hour charts, the probability of a correction after testing the $2,700 level is significant.
Sentiment Analysis
By TradingRage
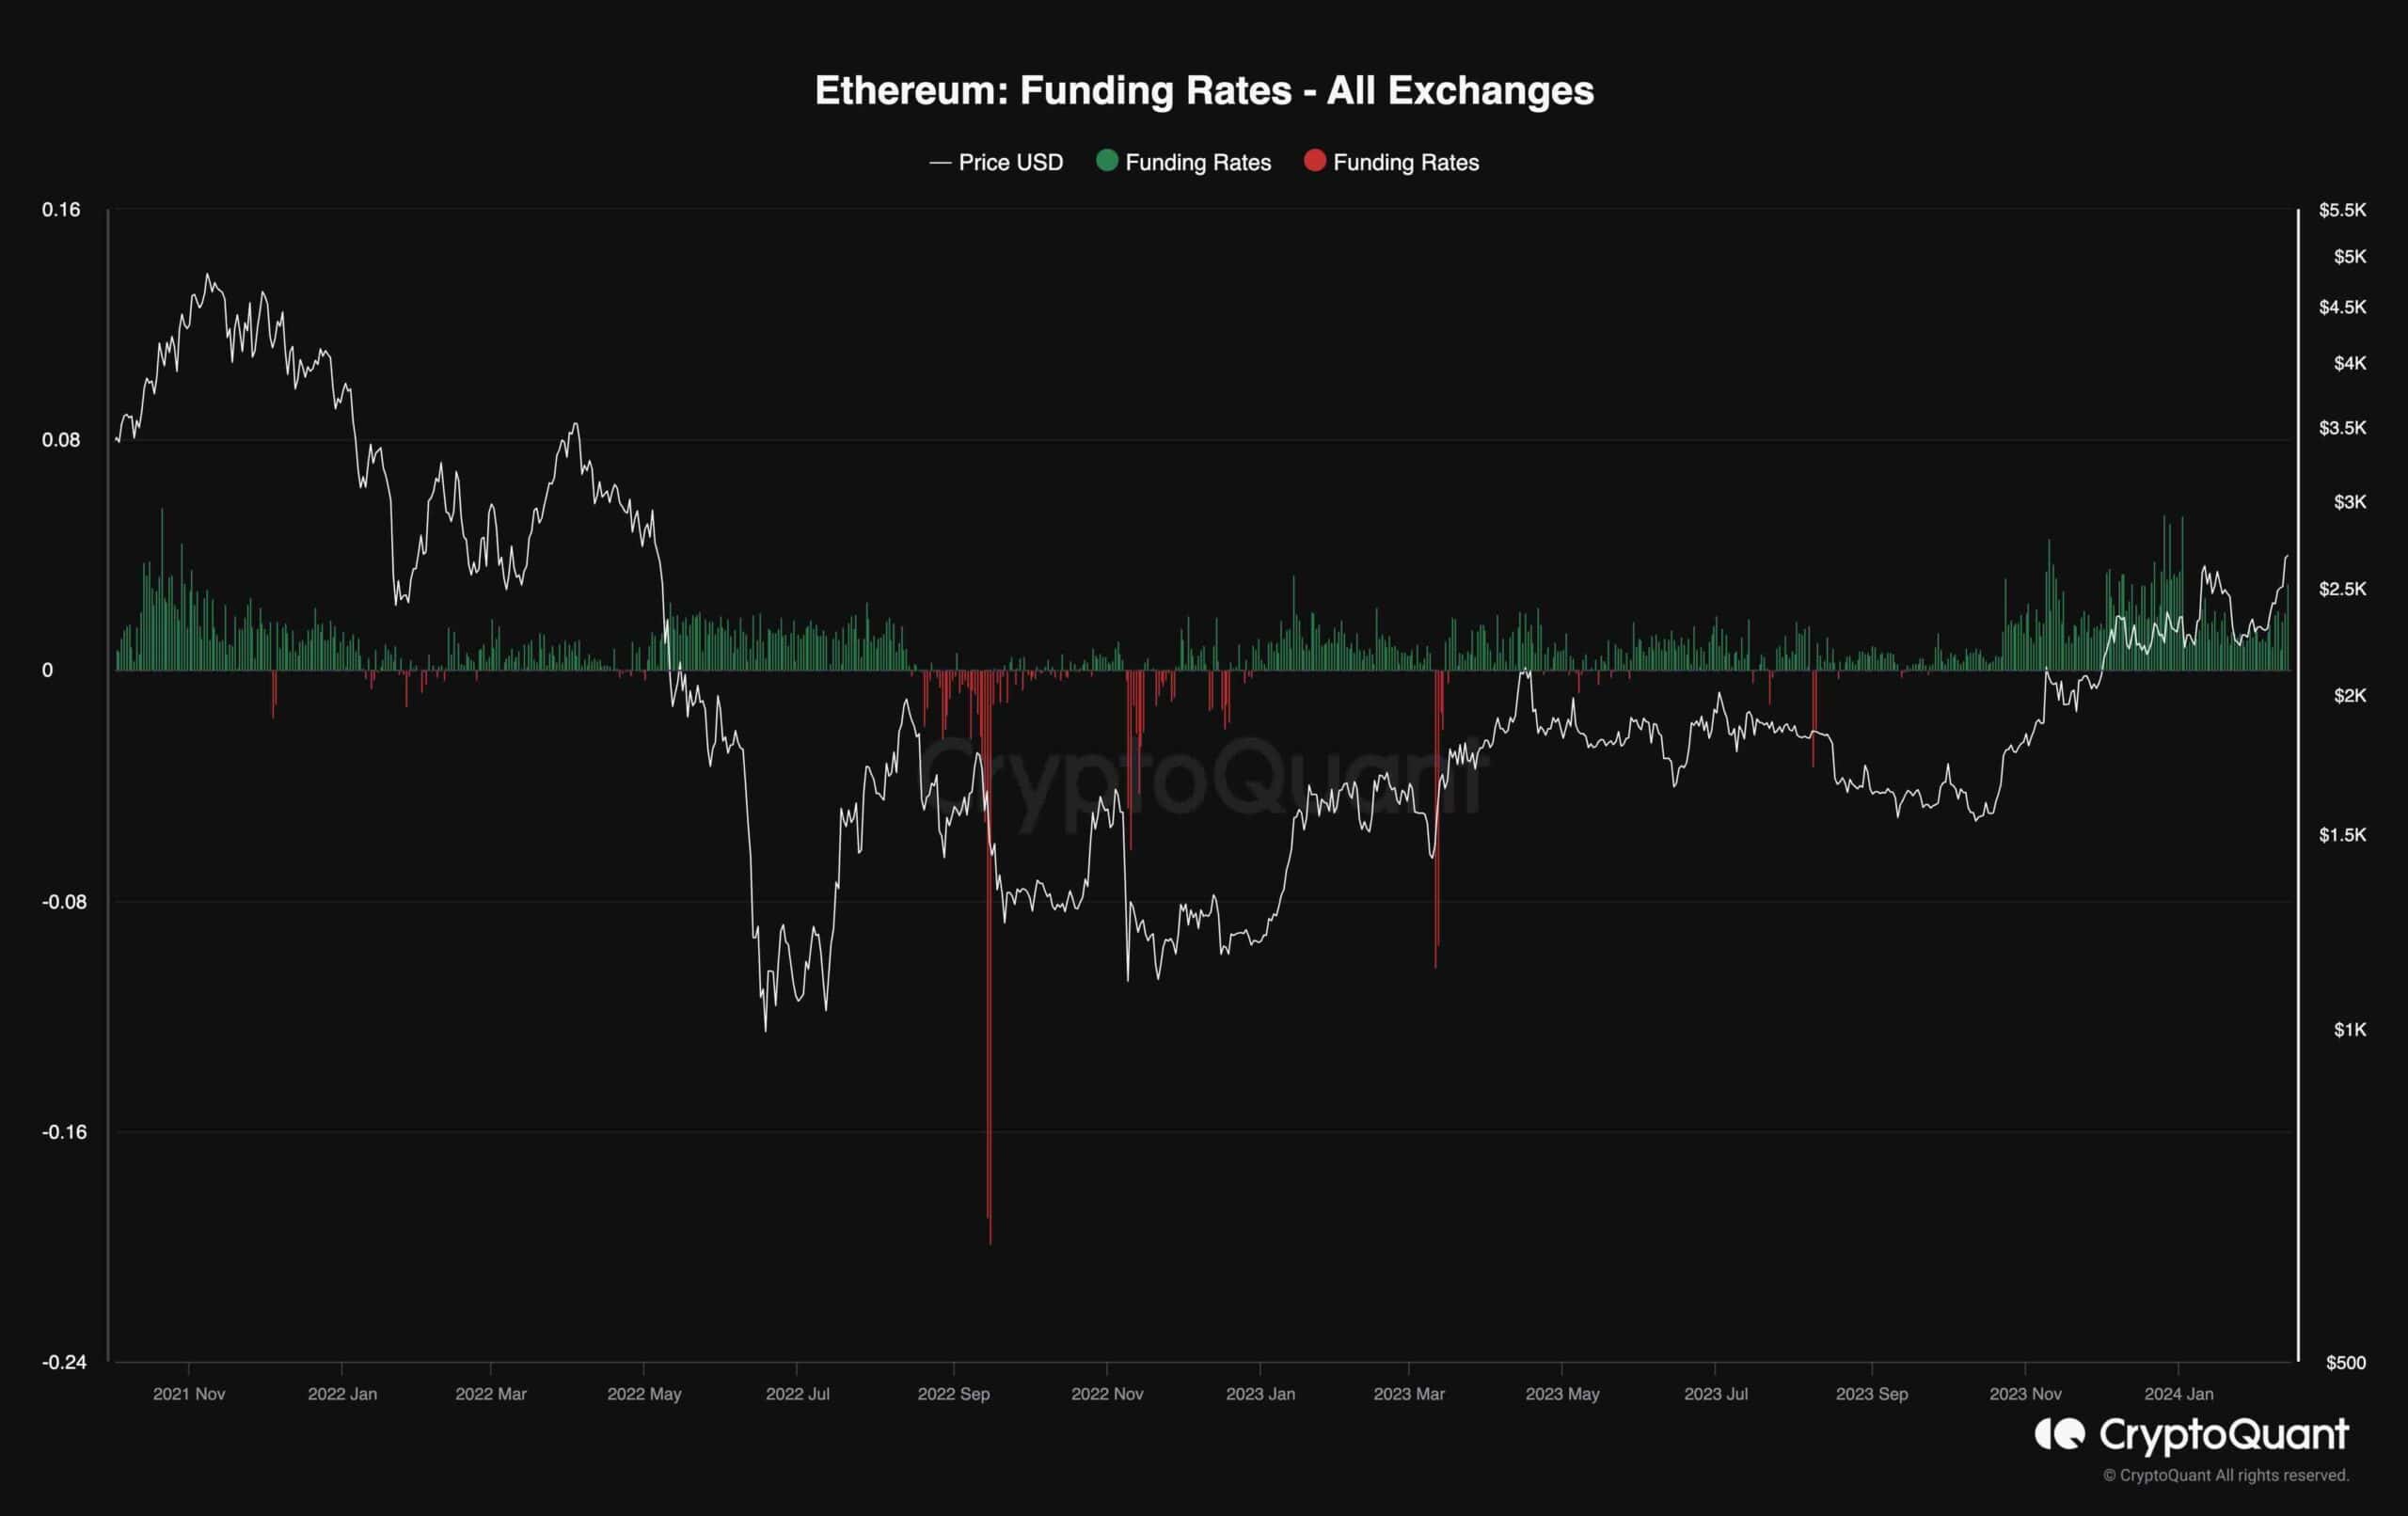
Ethereum Funding Rates
Ethereum’s price has been increasing rapidly over the past few weeks. Investors are becoming optimistic once again, expecting the market to make a new all-time high in the coming months. Yet, to gain an insight into potential short-term price developments, it would be beneficial to evaluate futures market sentiment.
This chart presents the Ethereum funding rates. They indicate whether the buyers or the sellers are executing their orders more aggressively on aggregate. Positive values show bullish sentiment, while negative values imply aggregate pessimism by futures traders.
As the chart shows, the price drop a few weeks ago has decreased the funding rates. However, they are once again rising as the price rallies. While being a positive signal, high funding rates are also worrying, as they point to the increased probability of a long-liquidation cascade and, consequently, sudden price drops.