The cryptocurrency market has recovered after a Sunday-Monday crash this week. The recovery is associated with the developments in the US and the drop of the US Dollar overnight.Cardano is one of the coins to watch as there are signs of a bullish continuation. As seen on a 4H chart ADA/USD has established a descending channel and is proceeding within its support and resistance levels. As seen on the chart the current setup, support from EMA50 and MACD demonstrate a bullish run up to a resistance near %excerpt%.322270.Cardano price on OverbitHowever, to do so, Cardano has to overtake another short-term dynamic resistance, described on an hourly chart below. As seen on the chart, both uptrend and downtrend scenarios are valid. The bet on an uptrend could be higher as Cardano cleared off the upper
Topics:
<title> considers the following as important:
This could be interesting, too:
Emmanuel (Parlons Bitcoin) writes Un code moral pour l’âge d’or, la règle Bitcoin
Bitcoin Schweiz News writes April-Boom an den Märkten: Warum Aktien und Bitcoin jetzt durchstarten
Bitcoin Schweiz News writes VanEck registriert ersten BNB-ETF in den USA – Nächster Meilenstein für Krypto-ETFs?
Fintechnews Switzerland writes Revolut Hits Milestone of One Million Users in Switzerland
Bitcoin Schweiz News writes US-Rezession als Bitcoin-Turbo? BlackRock überrascht mit kühner Prognose
The cryptocurrency market has recovered after a Sunday-Monday crash this week. The recovery is associated with the developments in the US and the drop of the US Dollar overnight.
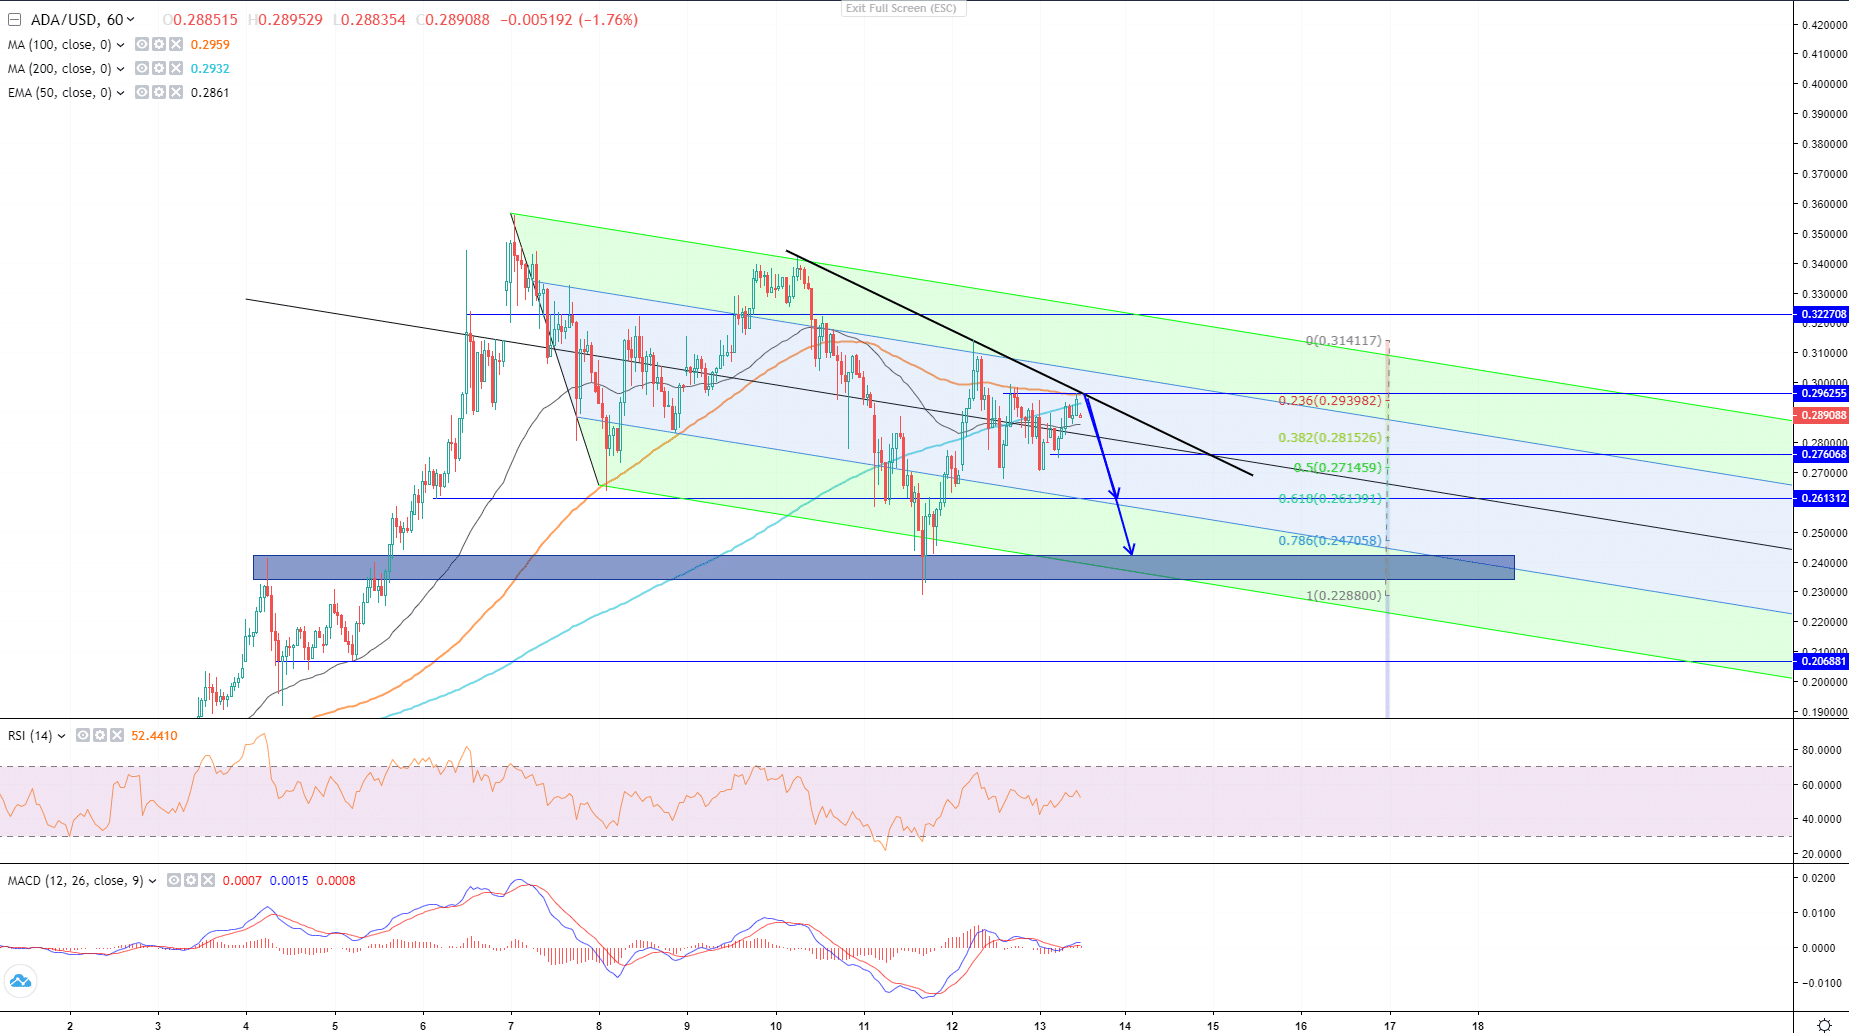
Cardano is one of the coins to watch as there are signs of a bullish continuation. As seen on a 4H chart ADA/USD has established a descending channel and is proceeding within its support and resistance levels. As seen on the chart the current setup, support from EMA50 and MACD demonstrate a bullish run up to a resistance near $0.322270.
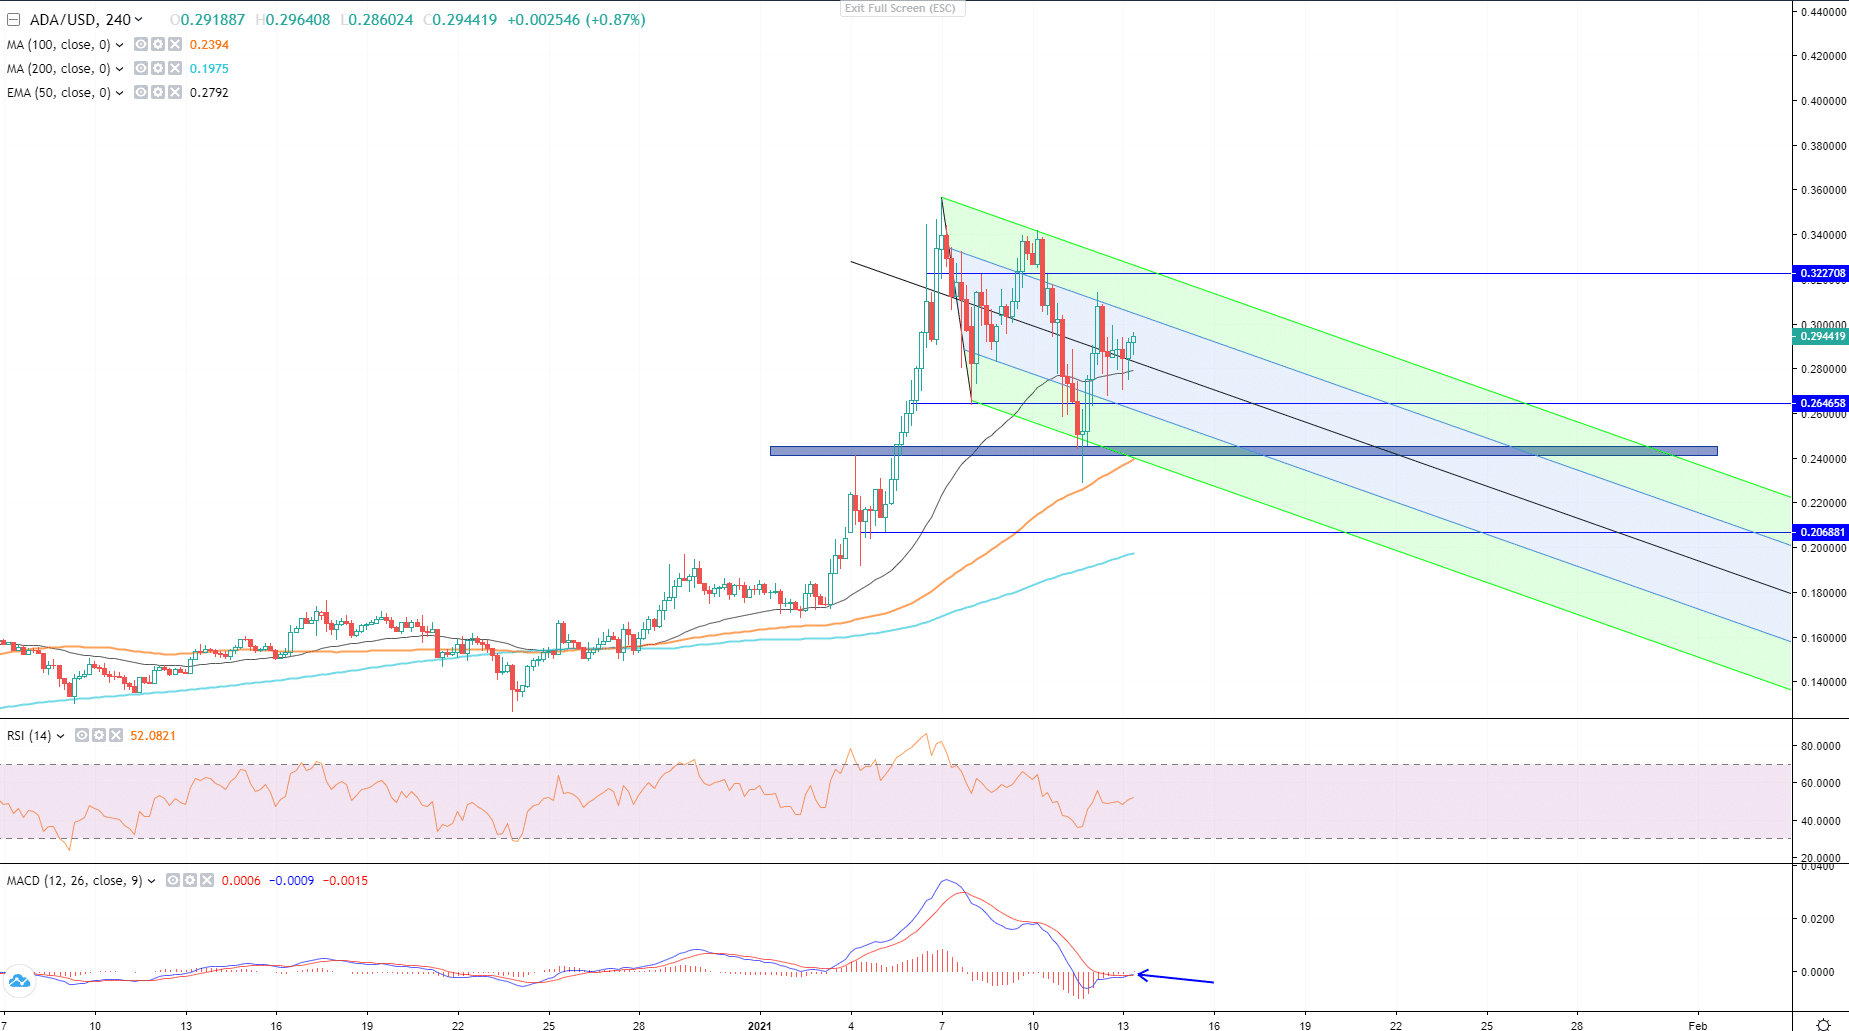
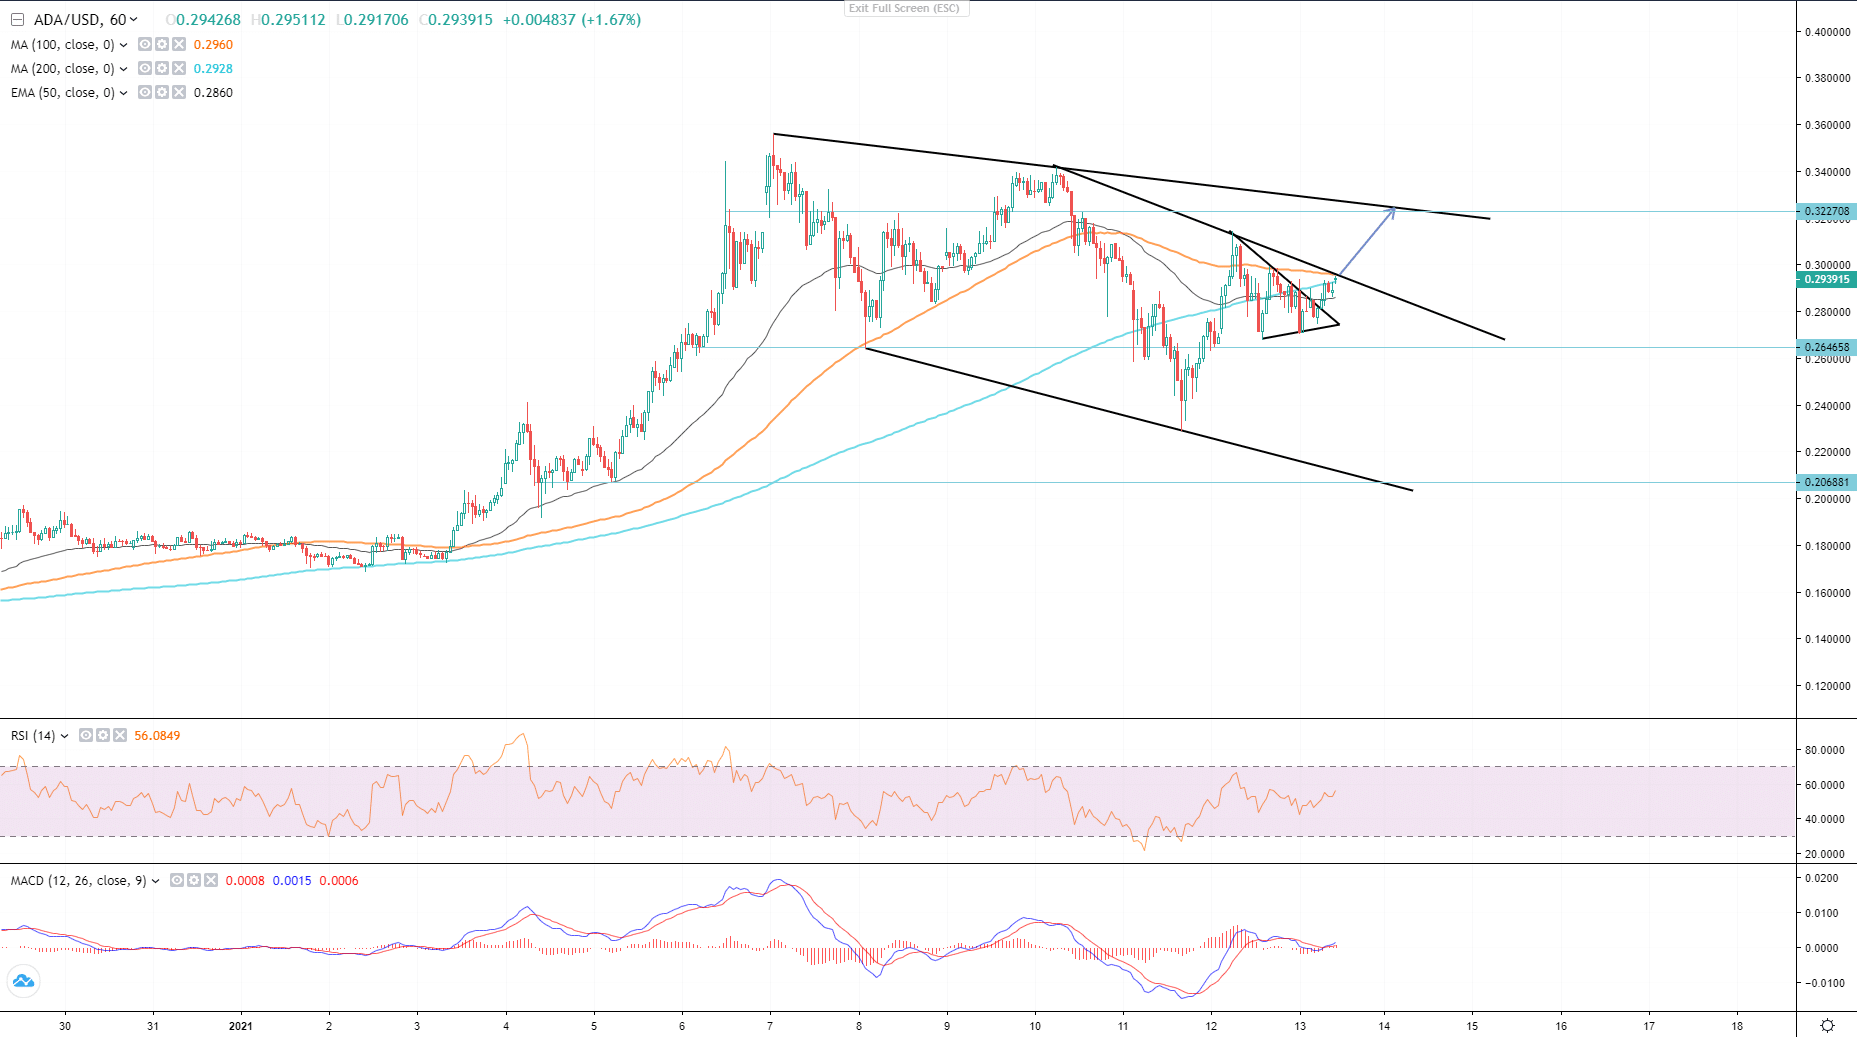
However, to do so, Cardano has to overtake another short-term dynamic resistance, described on an hourly chart below. As seen on the chart, both uptrend and downtrend scenarios are valid. The bet on an uptrend could be higher as Cardano cleared off the upper edge of a triangle on the same chart.
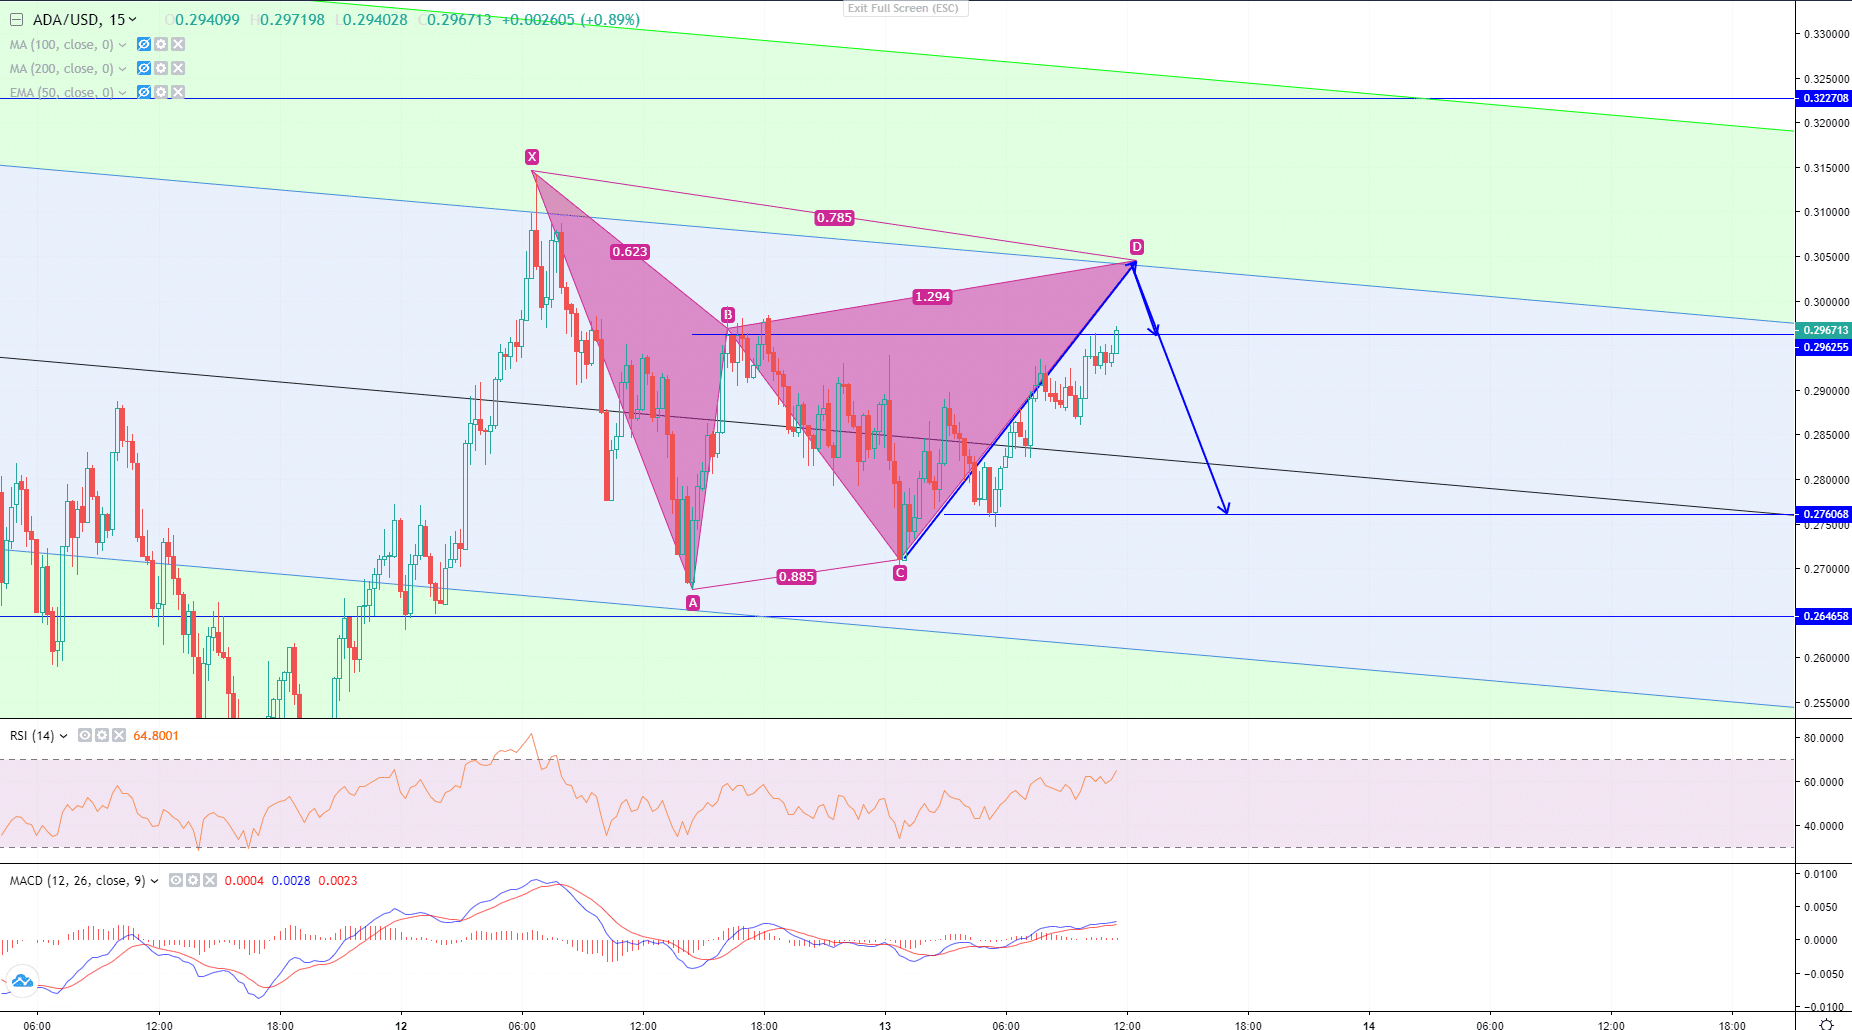
On a 15M chart there are two harmonic patterns on the watch, the first described below is a Gartley pattern.
And a Crab pattern, see the image below.
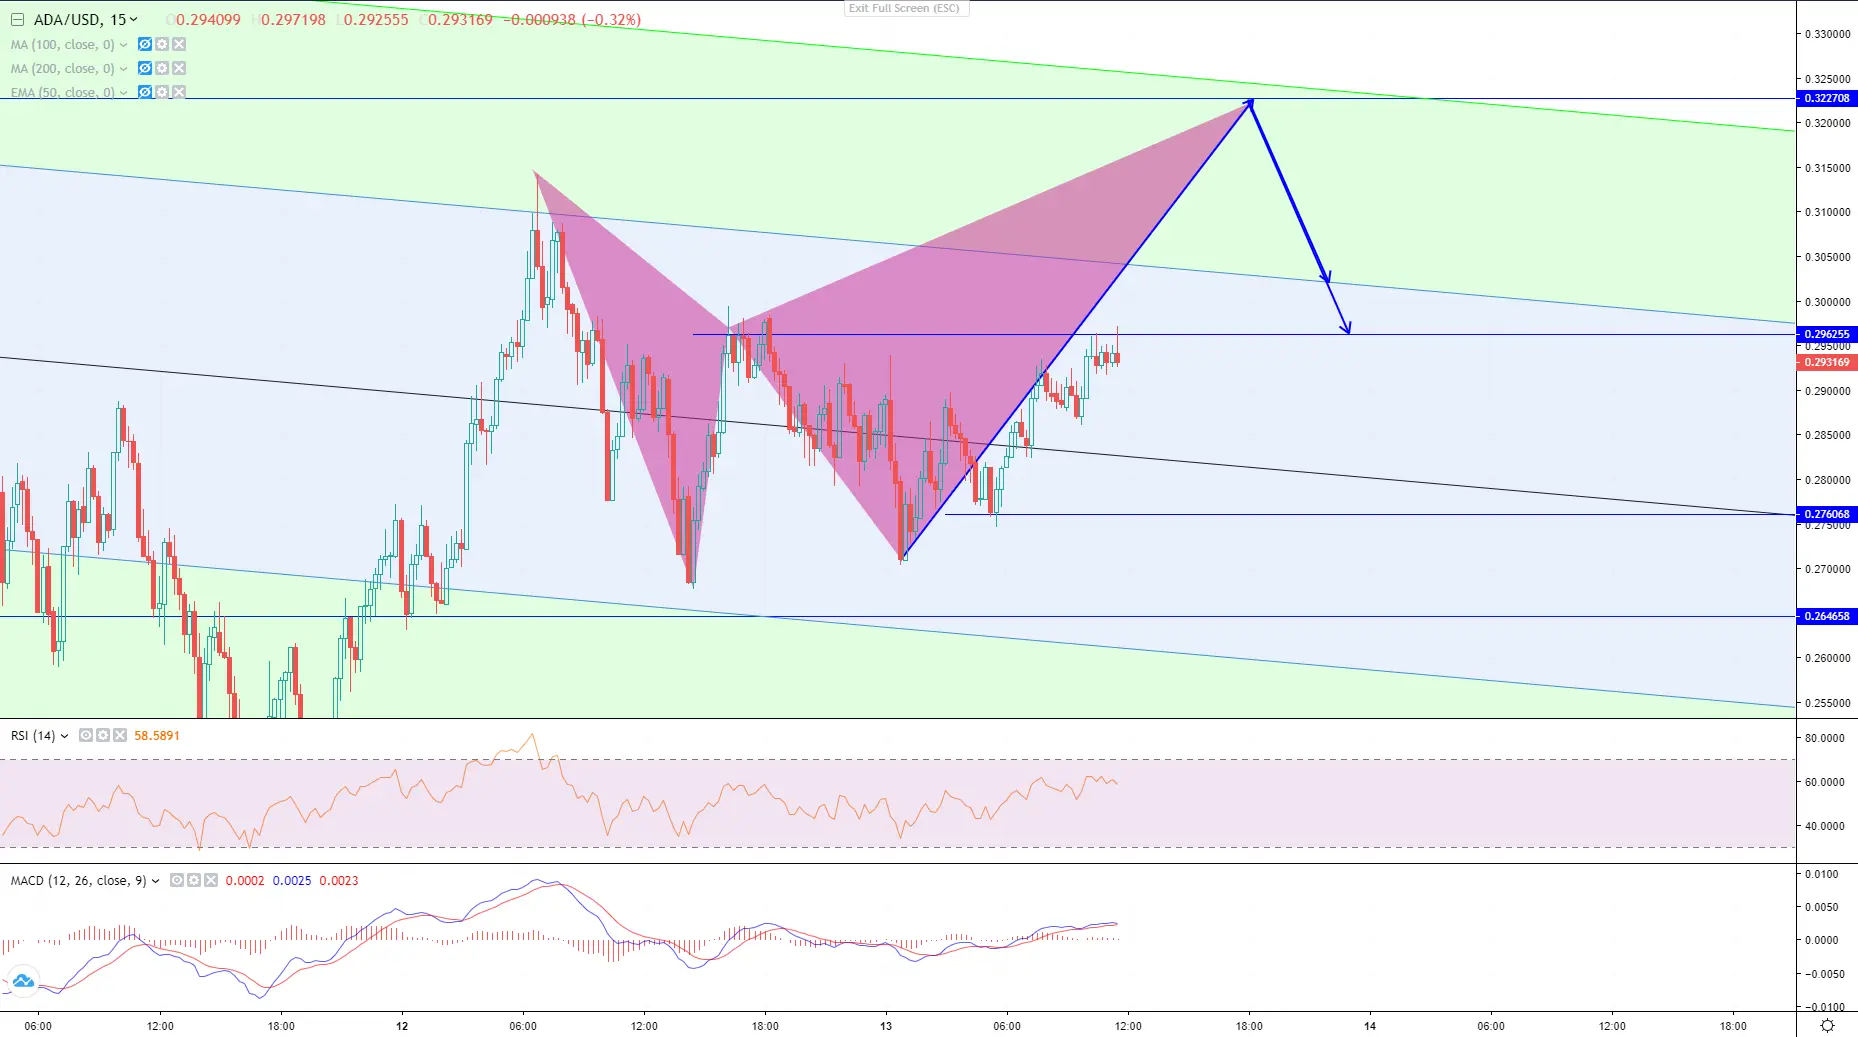
The ending point, point D of both patterns, take place at important resistance levels. It is worth mentioning that harmonic patterns are formations that appear on corrective wave structures and very rarely on an impulse wave.
The alternative to the uptrend scenario is, if Cardano does not close above the dynamic resistance, it will drop to test $0.261400 support which is a Fibo 0.618 level of the last impulse and to $0.244000 below that.
Key Takeaways and Announcements of Data This Week
- Today, January 13 – we are expecting CPI and Core CPI data as well as speeches of the FOMC members.
- Tomorrow, January 14 – Initial Jobless Claims and FED Chairman Mr. Powell speech.
- Friday, January 14 – Core Retail Sales, Retail Sales and PPI.
Almost all of the forecasts for each economic data announcement signal the recovery of the US Dollar, although the unrest in the market due to the Impeachment and possible riots remain.

Senior Vice President at Overbit. Technical analyst, crypto-enthusiast, ex-VP at TradingView, medium and long-term trader, trades and analyses FX, Crypto and Commodities markets.
