After another attempt, Ethereum still could not overcome the key resistance at 00, and the bears quickly took control of the market. This correlates with the overall sentiment, as the DXY index continues to rise, and high-risk assets such as US stocks indices and Bitcoin are dropping. In addition, Gold has lost 3.5% of its value recently as a safe-haven asset. Technical Analysis Technical Analysis By Grizzly The Daily Chart On the daily timeframe, following the 00 rejection, the Seller Takers still have the upper hand in the market, as they were able to impose more than 8% correction on ETH. Below are the two recent uptrends formed within the ascending channel (marked yellow). The price increase has been accompanied by an increase in the strength of Buyer Takers and
Topics:
CryptoVizArt considers the following as important: ETH Analysis, ETHBTC, Ethereum (ETH) Price, ethusd
This could be interesting, too:
Mandy Williams writes Ethereum Derivatives Metrics Signal Modest Downside Tail Risk Ahead: Nansen
Jordan Lyanchev writes Weekly Bitcoin, Ethereum ETF Recap: Light at the End of the Tunnel for BTC
CryptoVizArt writes Will Weak Momentum Drive ETH to .5K? (Ethereum Price Analysis)
Jordan Lyanchev writes Bybit Hack Fallout: Arthur Hayes, Samson Mow Push for Ethereum Rollback
After another attempt, Ethereum still could not overcome the key resistance at $3200, and the bears quickly took control of the market.
This correlates with the overall sentiment, as the DXY index continues to rise, and high-risk assets such as US stocks indices and Bitcoin are dropping. In addition, Gold has lost 3.5% of its value recently as a safe-haven asset.
Technical Analysis
Technical Analysis By Grizzly
The Daily Chart
On the daily timeframe, following the $3200 rejection, the Seller Takers still have the upper hand in the market, as they were able to impose more than 8% correction on ETH.
Below are the two recent uptrends formed within the ascending channel (marked yellow). The price increase has been accompanied by an increase in the strength of Buyer Takers and Volume Delta, something that is not currently being seen in the market.
If sellers continue to control the market, ETH can be expected to drop to retest the channel’s bottom line at $2800. On the bullish side, the main challenge is breaking the resistance at $3200, which ETH does not seem to have enough power to do as of now.
Moving Averages:
MA20: $3117
MA50: $3010
MA100: $2923
MA200: $3483

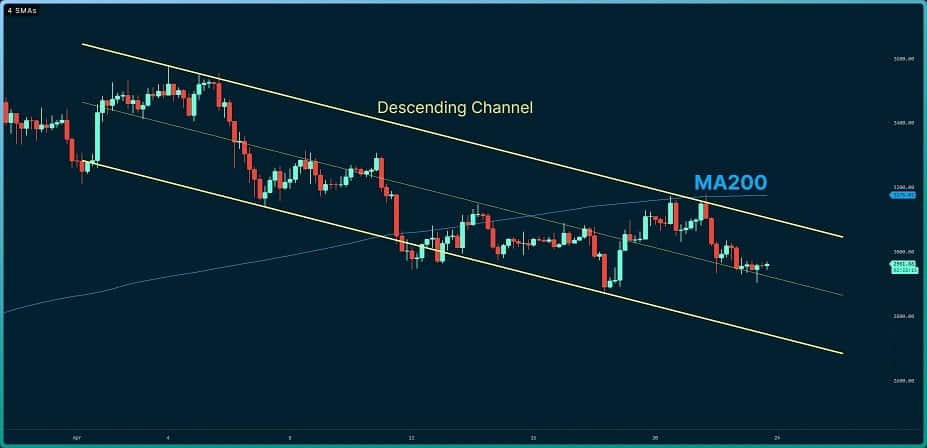
The 4-Hour Chart
On the 4-hour timeframe, ETH moves south in a descending channel and has touched the midline, which acts as a support. The primary resistance in this timeframe is the MA200 line, which lies at $3177, and it intersects with the critical resistance mentioned above.
Based on the review of technical data, the main challenge is overcoming the resistance at $3200, and the bulls must first overcome this level with strength (volume). Ethereum moves upward in the daily ascending channel, so there can be no bearish insight unless the channel is broken down. If this happens, this invalidates the above analysis, and lower levels are likely to be tested.
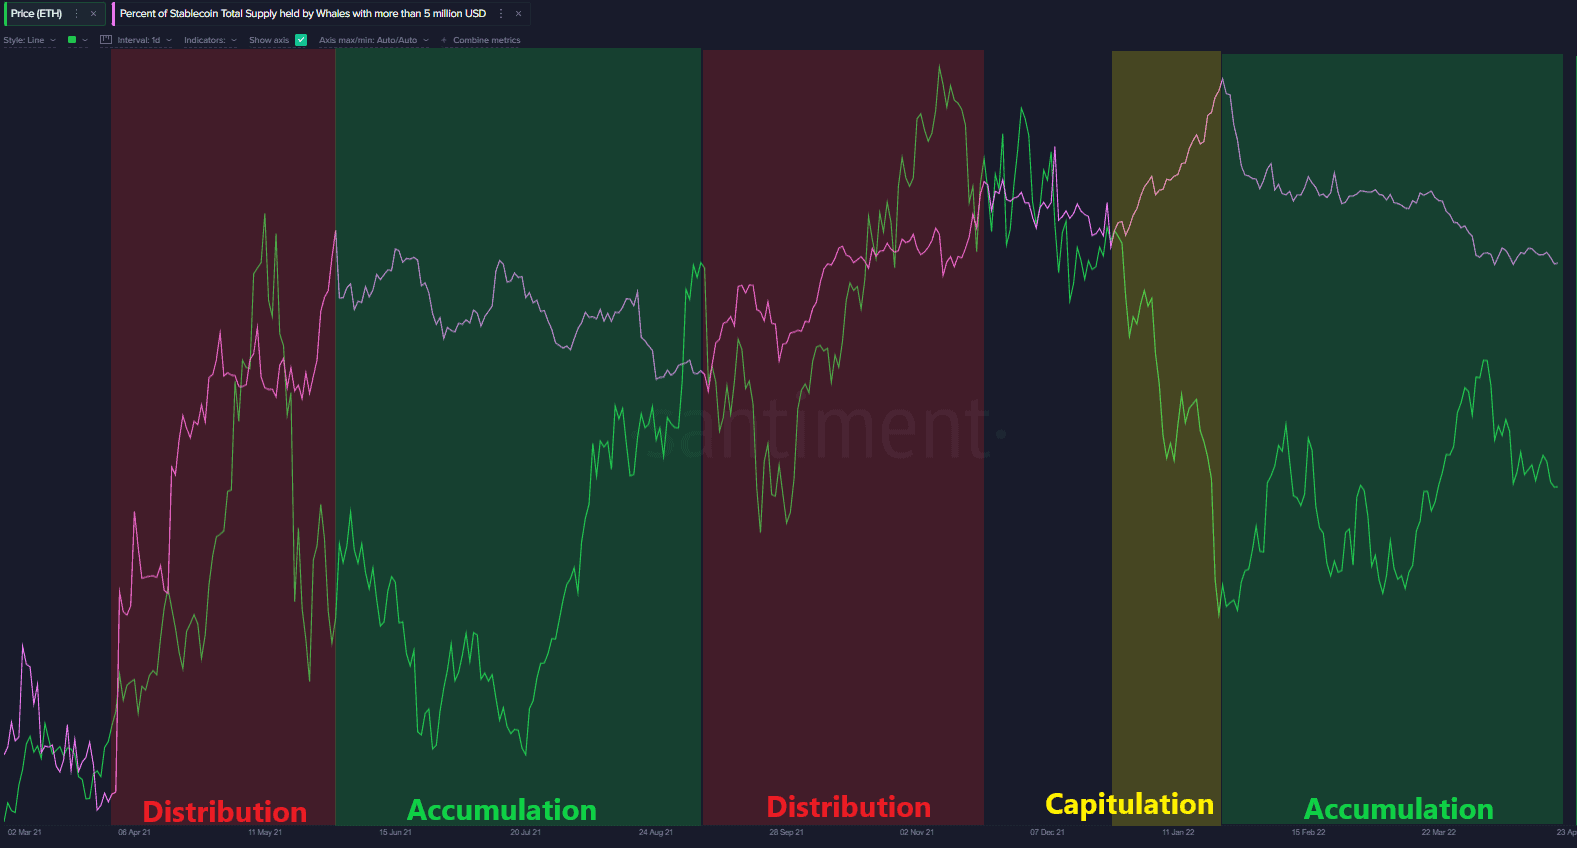
On-Chain: Percent Of Stablecoin Total Supply By Whales With Over $5M
When this metric moves up, the whales are less willing to hold stablecoins and probably convert them to BTC or Altcoins such as ETH.
A low value indicates that the whales realize profits and prefer to hold stablecoins under bearish market conditions. As seen below – the whales are accumulating, and their total supply decreases.