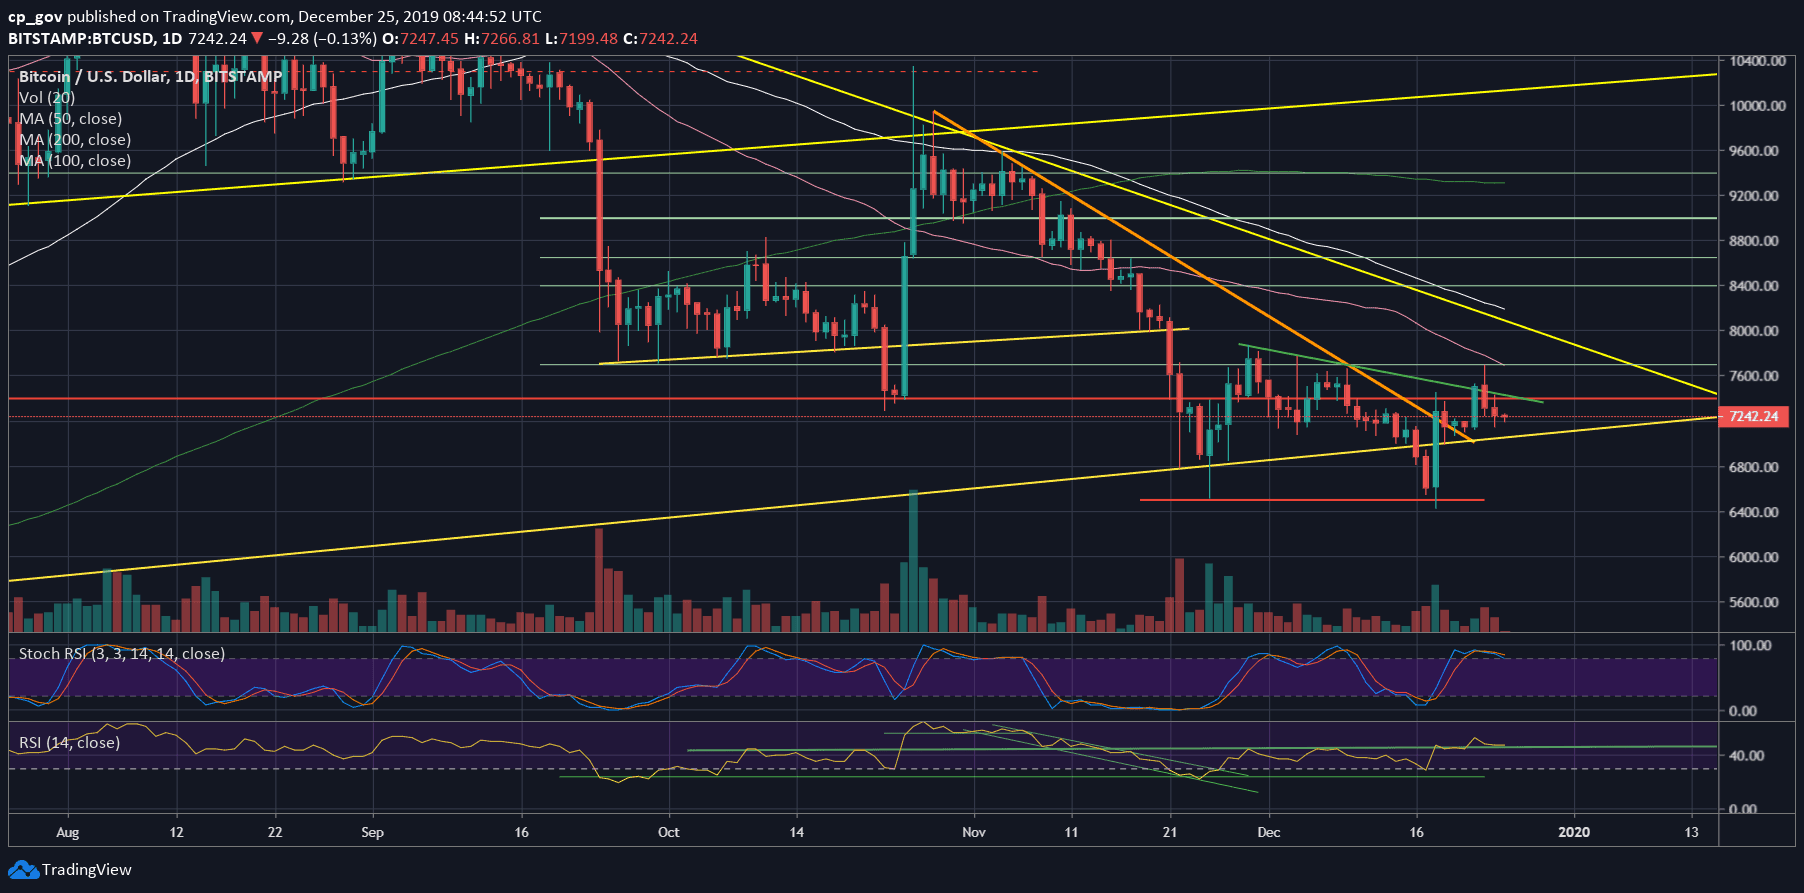
From euphoria to depression: The crypto traders thought they are leaving off for Christmas in an optimistic mood; however, Bitcoin had other plans, as of now.Two days ago, following accurately touching the critical resistance level of 00, which was discussed here many times as the short-term first significant level, the cryptocurrency got poorly rejected.Less than 24 hours, and Bitcoin finds itself seeking support on top of the 00 horizontal line, along with the mid-term ascending trend-line (on the 4-hour chart).As proven once again, Bitcoin can be very volatile, and during days when the market doesn’t signal a clear direction, sometimes it’s advisable to trade less or not to trade at all. The only winners of such situation are the crypto margin exchanges.At the macro level, we can
Topics:
Yuval Gov considers the following as important: Bitcoin (BTC) Price, BTCanalysis
This could be interesting, too:
Mandy Williams writes Bitcoin ETFs Record Over .6B in Outflows in the Past 2 Weeks
Chayanika Deka writes Bitcoin Whales Offload 6,813 BTC as Selling Pressure Mounts
Wayne Jones writes Bitcoin Sentiment Hits 2022 Lows as Fear & Greed Index Falls to 10
Jordan Lyanchev writes Bitcoin Falls Below K for the First Time in 3 Months, How Much Lower Can It Go?
From euphoria to depression: The crypto traders thought they are leaving off for Christmas in an optimistic mood; however, Bitcoin had other plans, as of now.
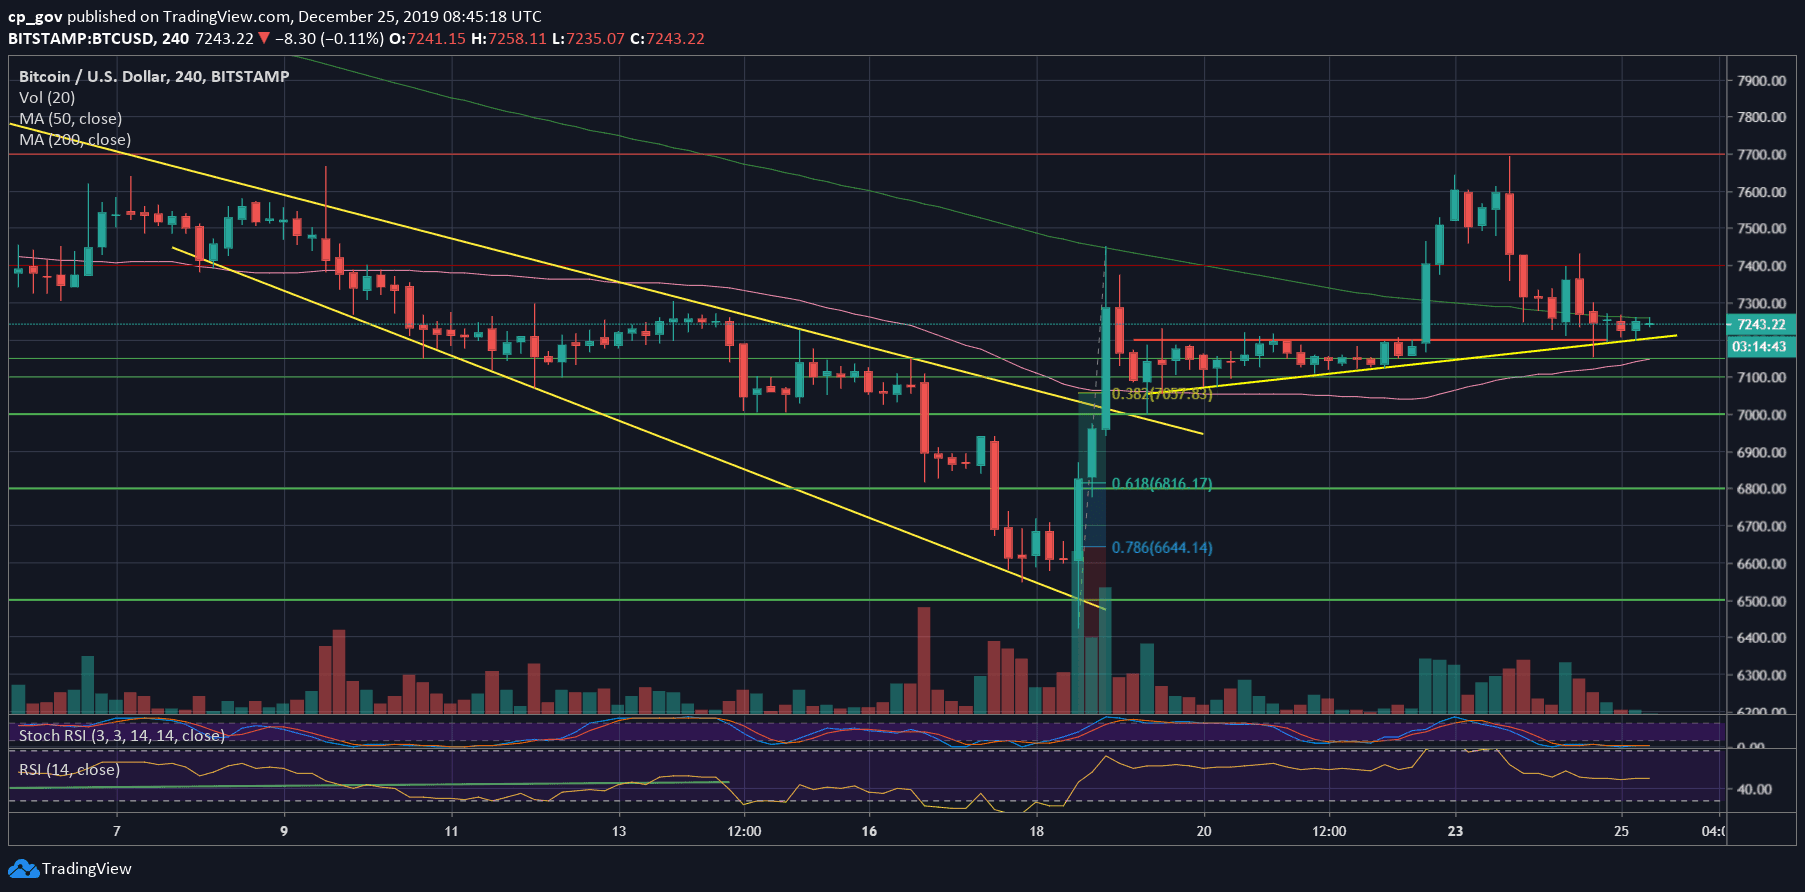
Two days ago, following accurately touching the critical resistance level of $7700, which was discussed here many times as the short-term first significant level, the cryptocurrency got poorly rejected.
Less than 24 hours, and Bitcoin finds itself seeking support on top of the $7200 horizontal line, along with the mid-term ascending trend-line (on the 4-hour chart).
As proven once again, Bitcoin can be very volatile, and during days when the market doesn’t signal a clear direction, sometimes it’s advisable to trade less or not to trade at all. The only winners of such situation are the crypto margin exchanges.
At the macro level, we can see that Bitcoin failed to close above the green descending trend-line, as can be seen on the following daily chart, together with the $7700 price level rejection.
Total Market Cap: $192.7 billion
Bitcoin Market Cap: $132.6 billion
BTC Dominance Index: 68.8%
*Data by CoinGecko
Key Levels to Watch
– Support/Resistance: After rejecting from the $7700 level, Bitcoin dropped severely down to the $7200 support; from there, the coin confirmed the crucial key-level of $7400 as support turned resistance before continuing down to where it trades now (~$7200).
For the past day, Bitcoin’s upper ‘fence’ was the 4-hour MA-200 (the light green line), roughly around $7250. From below is the $7100 – $7200 support area, which includes the 4-hour MA-50 (the pink line) along with horizontal support of $7200, the current daily low, and the long-term ascending trend-line on the daily chart (which started forming on April).
A short-term bullishness can only be approved in case of a higher low above $7400. Further above is the critical $7700.
From below, if the mentioned support area won’t hold, then we will likely see Bitcoin retesting the $7000 area once again. Further below is $6800 and last week’s low at around $6500, which is also the lowest price of Bitcoin since May 2019.
– The RSI Indicator: The breakout form the 44-45 RSI level had turned into a fake one. The recent price drop is reflected on the RSI, which is back to the 44-45 level. This is a deciding point for Bitcoin, whether it will hold or break.
– Trading volume: The recent days’ volume levels are far from the monthly highs. This can be explained because of the Holidays. Be aware that the market is easy to manipulate due to the low volume.
BTC/USD BitStamp 4-Hour Chart
BTC/USD BitStamp 1-Day Chart